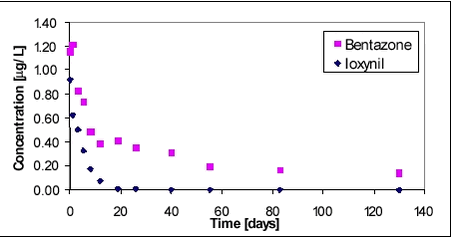
Fate of Pesticides in Surface Waters, Laboraty and Field Experiments8 Results and discussion, field experiments8.1 Bentazone and ioxynil8.2 Pendimethalin and fenpropimorph 8.2.1 Water phase 8.2.2 Sediment 8.3 Glyphosate and AMPA 8.3.1 Water phase 8.3.2 Sediment 8.4 Comparison with effect studies in mesocosm systems 8.1 Bentazone and ioxynilBentazone and ioxynil were sprayed simultaneously. Average water concentration is shown in Figure 8.1 as a function of time.
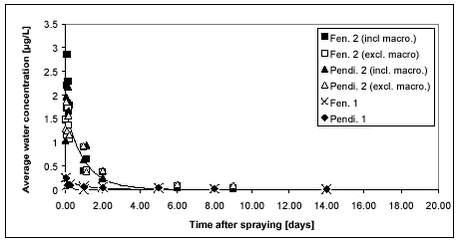
Figure 8.1 Ioxynil is seen to disappear within the first 20 days while bentazone seems more persistent. The long tailing of the bentazone concentration level is in contrast to the relatively rapid drop in the bentazone concentration level during the first few days when the bentazone concentration seems to drop at the same rapid rate as ioxynil. The high initial dissipation rate is probably due to photolysis of the compound in the upper part of the water column where most of the compound is located (Vestergaard, 2002). 8.2 Pendimethalin and fenpropimorph8.2.1 Water phasePendimethalin and fenpropimorph show low water solubility and high Kow compared to bentazone and ioxynil. Two experiments were carried out with mixtures of these two compounds. In the first experiment, the vertical concentration gradient and the sediment uptake were studied along with dissipation from the water column. In the second experiment, the impact of macrophytes on the dissipation and hydraulic mixing was studied in addition to the other processes. The average water concentration of the pesticides is shown in Figure 8.2. The application rate of pesticides was the same for both experiments. Dissipation of pesticides of fen 1 and pendi 1 (1999) was therefore expected to be similar to that of fen 2 (incl. macro) and pendi 2 (incl. macro)(2000). It is thus surprising to see the relatively large difference between the two years. The calculated initial concentration in Table 7.2 was higher for year 2000 compared to year 1999, however, that difference cannot explain the large difference in dissipation rates shown in Figure 8.2. One explanation may be that there are some extra sorption sites in the water phase in 2000 compared to 1999. Removal of macrophytes from the pond was mainly performed 3 weeks prior to spraying of the pond with extra cutting 1 week before spraying. This caused resuspension of the sediment, which had, however, settled again. Two days before spraying, there was a heavy rainfall, which caused flooding of the partition wall and it was necessary to pump the excess water into pond 1. The rainfall and the pumping may have caused resuspension of sediment, which may explain the extra sorption. Sorption of pesticides to suspended matter would hinder the transfer from the water column to solid surfaces due to sorption because the free dissolved part of the substance in the water column was reduced. The chemical analysis of pesticides in the water phase includes dissolved compound as well as compound sorbed to suspended matter. Measurements of turbidity did not show any differences between the two years. However, the turbidity measurement may not suffice to detect the difference in water content of any possible medium for sorption. Such a sorption medium could be either suspended solids or dissolved organic matter.
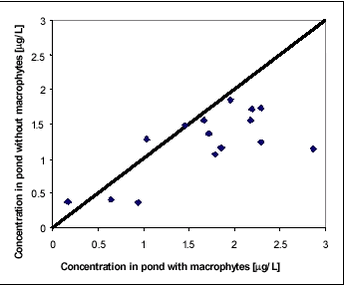
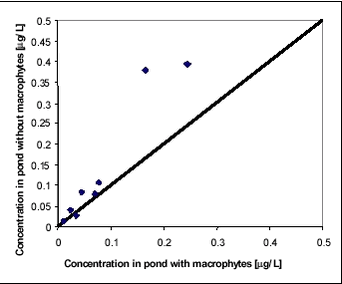
Figure 8.2 While there is significant difference in concentration and dissipation rate between years, there is only little difference within the same year in experiments with and without macrophytes. It may surprise that the water concentration of pesticides is not highly affected by the removal of macrophytes remembering that 713 g dry matter per m2 had been removed from one part of the pond. In this experiment, macrophytes seem to have little significance as sorption medium. Macrophytes do, however, affect the fate of pesticides in the ponds. Figures 8.3-8.4 compare concentrations of fenpropimorph and pendimethalin in the water phase in ponds with and without macrophytes at different times after spraying. Figure 8.3 includes data points before 1.13 days while Figure 8.4 includes data points after 1.13 days. For the first 1.13 days, the macrophytes result in a higher water concentration while, after 1.13 days, they result in a lower water concentration. The significance of this observation was tested statistically using a binomial test on pairs of observations (bigger than/smaller than). Significance level for data in Figure 8.3 is 0.999 and for data in Figure 8.4 it is 0.965.
Figure 8.3
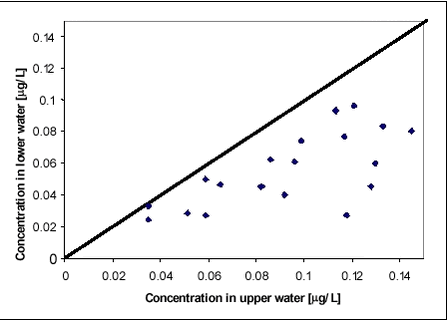
Figure 8.4 The explanation of the observed differences may be that the macrophytes hinder the turbulence in the water column and thus the initial high rate of removal from the water column caused by transport and sorption to sediment. After about one day, the increased surface for sorption related to macrophytes results in a lower concentration level in the water. The model used for prediction of environmental fate of pesticides assumes momentarily mixing of pesticide into the waterbody. If that is the case, the concentration of pesticide should be the same in the upper and lower parts of the water column. The assumption was investigated by analysing water samples from different depths of the pond. Figure 8.5 compares concentrations of pendimethalin and fenpropimorph in the upper part of the pond with concentrations at the same time about 35 cm from the bottom. A distinct concentration increase can be observed in upward direction. The sampling method introduced some turbulence in the water and thus the actual concentration differences may be larger than the measurements indicate. The observation is in accordance with previous observations of concentration gradients in ponds sprayed with pyrethoid insecticides (Mogensen et al., 2002).
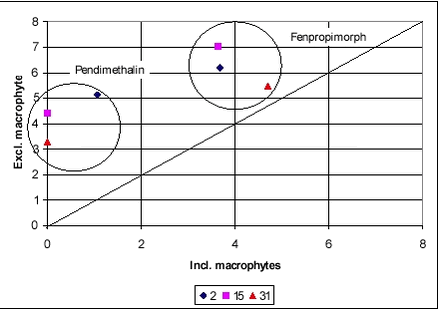
Figure 8.5 8.2.2 SedimentIn the pond with macrophytes, there were only traces of the two pesticides in the sediment. In the pond without macrophytes, the concentrations of both compounds were measurable. The difference in concentrations was most pronounced for pendimethalin, which is the more hydrophobic of the two pesticides (Figure 8.6). There was an open connection between the two parts of the pond until the day before spraying when the last fragment of the partition wall was installed. The composition of the water in the two parts should therefore be almost identical. The concentration of pesticide in the sediment reflects the concentration of pesticide in the water layer immediately above the sediment. Since there is a higher concentration of pesticides in the sediment in the macrophyte-poor part of the pond, the concentration in the water close to the bottom must have been higher as well.
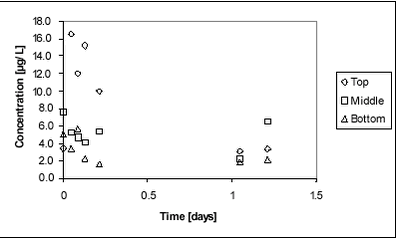
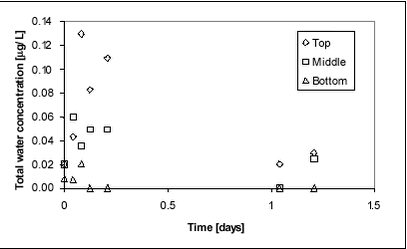
Figure 8.6 A higher concentration of pesticide in the bottom water may be caused by a less pronouced concentration gradient in the pond without macrophytes. The gradient in the macrophyte pond may result from slow mixing or from sorption of pesticides to the macrophytes. If sorption to macrophytes was the main controlling factor, a lower concentration of pesticides in the bulk water samples would be expectable. This does not seem to be the case. Alternatively, the higher concentration in the sediment in the non-macrophyte pond may be due to faster vertical transport caused by faster mixing. This theory is supported by the above observations of pesticide concentrations in the water phase. 8.3 Glyphosate and AMPA8.3.1 Water phaseGlyphosate is a small ionic compound. It is water-soluble and sorbs to soil and sediment, especially to clay particles. It was selected for this experiment because of its special physico-chemical properties and its widespread use in Danish agriculture. Glyphosate was applied once in the spring of 2000. Both glyphosate and the degradation product AMPA were analysed. Figure 8.7 shows the water concentration of glyphosate during the first one and a half days after spraying. Sampling took place in three different depths, top, middle and bottom. A gradient is identified during the first day when the concentration increases from bottom towards the surface. The result is similar to that observed with fenpropimorph and pendimethalin. After about one day, the gradient has levelled out.
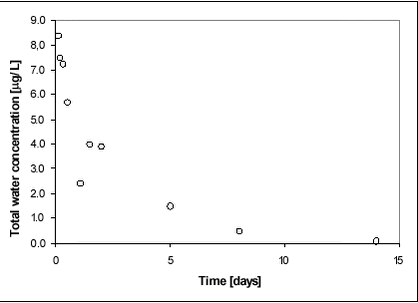
Figure 8.7 Figure 8.8 displays the average concentration of glyphosate in the water phase during the first two weeks after application. Most of the substance dissipated during the first week after spraying.
Figure 8. 8 Degradation of glyphosate into AMPA was slow in the water phase, the concentration of AMPA not exceeding 0.14 µg/L compared to 16 µg/L of glyphosate. As for glyphosate, there was a concentration gradient with highest concentrations in the top samples (Figure 8.9).
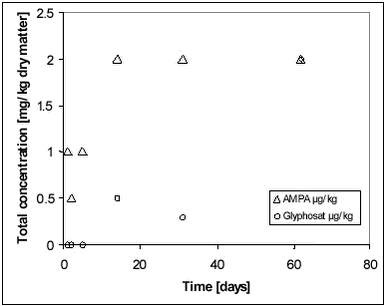
Figure 8.9 8.3.2 SedimentIn the sediment measurement, AMPA was dominant compared to glyphosate (Figure 8.10). Glyphosate sorbed to the sediment where it was transformed into AMPA. 8.4 Comparison with effect studies in mesocosm systemsA comprehensive review of effect studies of pesticides conducted with mesoscosms experiments was performed by Møhlenberg et al. (2001). The review included more than 100 original studies, which were selected among many more studies from literature according to objective quality criteria. Furthermore, the analysis of the collected literature included overall statistical analysis of the data material extracted from the literature and detailed analysis of selected studies. The majority of the mescosm experiments reviewed by Møhlenberg et al. were conducted in ponds of similar dimensions and specifications as the ponds used in the present studies. Especially the effect studies including macroinvertebrates were conducted in ponds similar to the ponds used in the present exposure study. In order to facilitate the linkage between the exposure and effect studies, a comparison between the main results of Møhlenberg et al. and the exposure studies of the present report was made. An important result of the statistical analysis of Møhlenberg et al. was that the size of the Kow values or the ability to sorb was more important for the toxic response of the macroinvertebrates in the ponds than the inherent single species toxicity of the compound. The single species toxicity was measured by standardised toxicity tests, in which the test organisms were exposed to the pesticide through the water phase. In the ponds, the main exposure route for the invertebrate may, however, be through ingested particles, to which the pesticides sorb. The statistical analysis of Møhlenberg et al. might therefore reflect that macroinvertebrates in the ponds are mainly exposed to pesticide sorbed to ingested particles rather than to pesticides dissolved in the water phase. Indirect evidence for this hypothesis is provided by the exposure studies of the present report, in which the rapid disappearance of, in particular, hydrophobic pesticides from the water column can be explained by sorption to particles in the sediment (Styczen et al., 2002a; Sørensen et al., 2002). |
