Fate of Pesticides in Surface Waters, Laboraty and Field Experiments

Appendix B. Results

In this appendix, raw data for the performed experiments are given in tables.

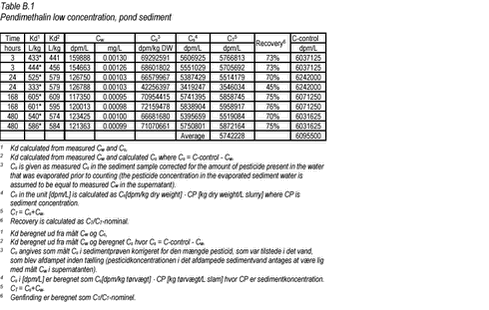
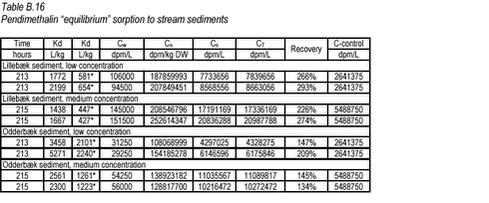
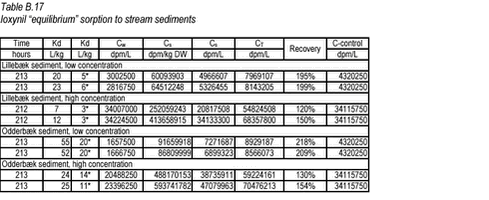
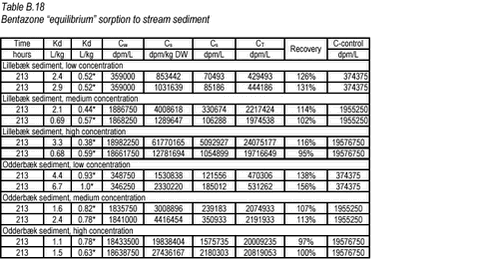
Two types of Kd(t) = Cs(t)/Cw(t) are given. The Kd1 has been calculated from measured Cw and Cs whereas the Kd2 has been calculated from measured Cw and C-control. The reason for this second approach was that Cs, as mentioned, was not measured in all cases and that the measurement of Cs, when performed, was very uncertain for some sediments. The uncertainty is expected to be associated with the procedure where activity is determined in a small 0.1-g subsample, extracted from 1.0 g of centrifuged sediment. If the sediment is inhomogeneous, this subsample is likely to be un-representative causing erroneous Kds. The Kd values considered to be trustworthy are presented with an *. The Cs that were not measured but calculated from Cw and Ccontrol are indicated by #.

10.1 B.1 “Kinetic” sorption experiments with pendimethalin and pond sediment

Click on the picture to see html-version of: ‘‘Table B.1‘‘

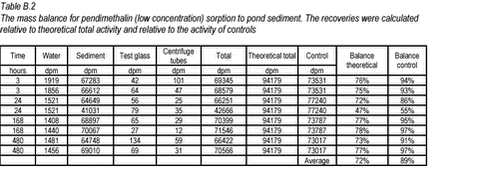
Click on the picture to see html-version of: ‘‘Table B.2‘‘


Click on the picture to see html-version of: ‘‘Table B.3‘‘


Click on the picture to see html-version of: ‘‘Table B.4‘‘

10.2 B.2 “Kinetic” sorption experiments with pendimethalin and stream sediments

In the kinetics experiment with pendimethalin and stream sediments, the activity of the sediment phase was only determined for the replicate test tubes removed at the termination time. Therefore, the Cs given at other times (marked with #) have been calculated from Cs = C-control – Cw. The Cs measured at time 197 hour is not considered representative of the actual Cs.


Click on the picture to see html-version of: ‘‘Table B.5‘‘


Click on the picture to see the html-version of: ‘‘Table B.6‘‘

10.3 B.3 “Kinetic” sorption experiments with ioxynil and stream sediments


Click on the picture to see the html-version of: ‘‘Table B.7‘‘


Click on the picture to see the html-version of: ‘‘Table B.8‘‘

10.4 B.4 “Kinetic” sorption experiments with pendimethalin and Lake Vaparanta sediments


Click on the picture to see the html-version of: ‘‘Table B.9‘‘

Click on the picture to see the html-version of: ‘‘Table B.10‘‘


Click on the picture to see the html-version of: ‘‘Table B.11‘‘


Click on the picture to see the html-version of: ‘‘Table B.12‘‘

Click on the picture to see the html-version of: ‘‘Table B.13‘‘

10.5 B.5 ”Kinetic” desorption experiments with pendimethalin and pond sediment


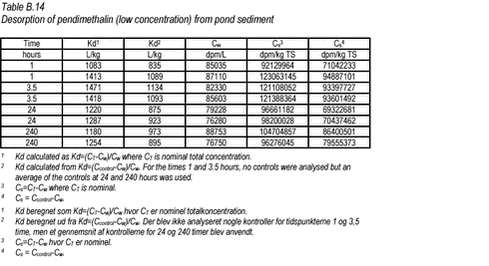
Click on the picture to see the html-version of: ‘‘Table B.14‘‘


Click on the picture to see the html-version of: ‘‘Table B.15‘‘

10.6 B.6 “Equilibrium” sorption experiments with pendimethalin and stream sediments


Click on the picture to see the html-version of: ‘‘Table B.16‘‘

10.7 B.7 “Equilibrium” sorption experiments with ioxynil and stream sediments


Click on the picture to see the html-version of: ‘‘Table B.17‘‘

10.8 B.8 “Equilibrium” sorption experiments with bentazone and stream sediments


Click on the picture to see the html-version of: ‘‘Table B.18‘‘

10.9 B.9 “Equilibrium” sorption experiments with pendimethalin and lake sediments


Click on the picture to see the html-version of: ‘‘Table B.19‘‘


Click on the picture to see the html-version of: ‘‘Table B.20‘‘

10.10 B.10   “Equilibrium” sorption experiments with ioxynil and lake sediments


Click on the picture to see the html-version of: ‘‘Table B.21‘‘


Click on the picture to see the html-version of: ‘‘Table B.22‘‘

10.11 B.11 “Equilibrium” sorption experiments with bentazone and lake sediments


Click on the picture to see the html-version of: ‘‘Table B.23‘‘


Click on the picture to see the html-version of: ‘‘Table B.24‘‘

10.12 B.12 Accuracy in sorption experiments


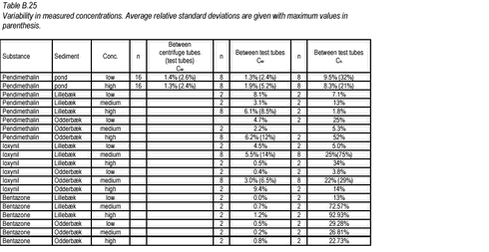
Click on the picture to see the html-version of: ‘‘Table B.25‘‘

10.13 B.13 Degradation experiments

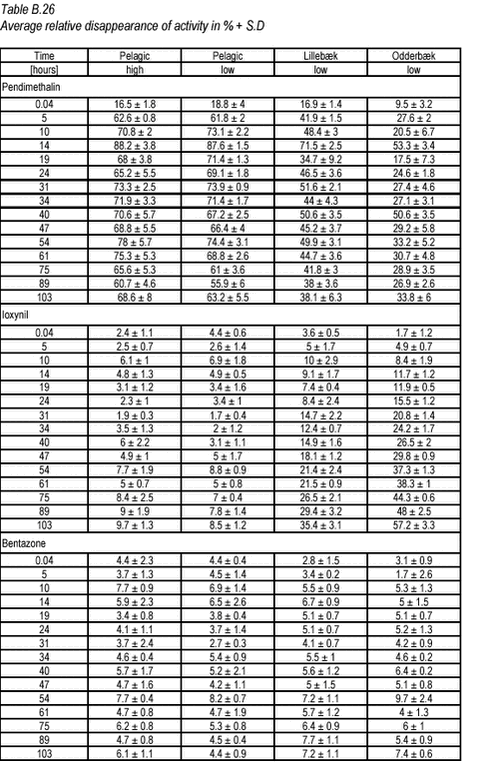
Click on the picture to see the html-version of: ‘‘Table B.26‘‘

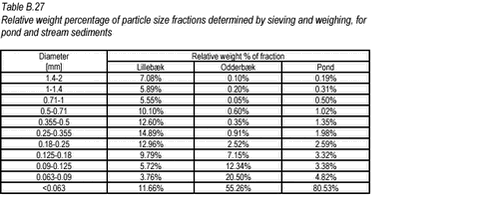
10.14 B.14 Sediment particle size distribution


Click on the picture to see the html-version of: ‘‘Table B.27‘‘


Click on the picture to see the html-version of: ‘‘Table B.28‘‘