Fate of Pesticides in Surface Waters, Laboraty and Field Experiments
Appendix C. Experiment with glass surfaces
10.15 C.1 Introduction In batch sorption experiments as reported here, sorption to glassware may be the reason for poor mass balances. As the pesticide in these experiments is found either dissolved in the water, associated with particles or sorbed to glass surface, the knowledge of glass sorption can be used in calculating concentration on particles indirectly. The equilibrium sorption to glass surfaces was investigated for pendimethalin, the most hydrophobic of the model pesticides. The sorption to both new smooth glass and old rough glass was investigated.
10.16 C.2 Experimental set-up In order to investigate the linearity of the equilibrium sorption, a series of glass-water systems with different glass surface to water ratios but with the same pesticide concentration was set up. Rough glass systems were made by shaking two sets of five “used” 30-mL round-bottomed glass tubes with 0, 50, 100, 150 and 200 new 5-mm glass spheres, 20 g of clean quartz sand and water for three days. After the three days, the sand was removed and the bottles and the now rough spheres were rinsed thoroughly with millipore water. The smooth glass systems were made by adding 0, 50, 100, 150 og 200 new 5 mm-glass spheres to two sets of five new 30-mL glass tubes. Nine mL of millipore water was added to all 20 tubes together with one mL 0.11 mg/L pendimethalin solution. The tubes were shaken for 48 hours, 5 mL of the water was withdrawn and activity was determined by LSC.
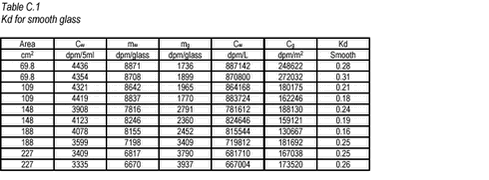
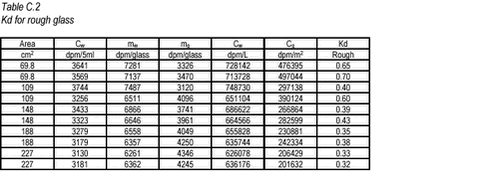
10.17 C.3 Results For the smooth and rough glass, the results are given in Tables C.1-C.2 below. The area of glass is calculated as the inner areas of the glass bottle 2 ð r
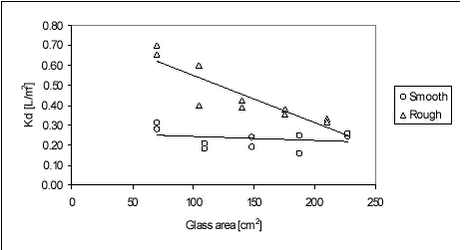
The results are shown graphically in Figure C.1 below.
Figure C.1 As it can be seen from Figure C.1, there is apparently no relationship between Kd and glass area for smooth glass bottle and spheres, while for rough spheres Kd may vary with glass surface indicating non-linearity of Kd. Kd for smooth glass was found to be 0.23 L/m2 in average. For rough glass, an average Kd of 0.37 L/m2 was found if the three high Kd values are considered outliers. From this experiment and using a three-compartment model, it can be seen that the pendimethalin amount sorbed to glass in the sorption experiment should be around 0.4% of the total amount while 97.5% is on the sediment and 2.1% is in the water. With pendimethalin in this experimental set-up, the error in Kd caused by measuring only the water concentration and assuming the rest is sorbed to sediment is low. |


