| Front page | | Contents | | Previous |
Fate of Pesticides in Surface Waters, Laboraty and Field Experiments
Appendix G. Sorption model
Description of the two-rate sorption model used in the pesticide river fate sub model and fitted to laboratory data.
The model is defined as given below:
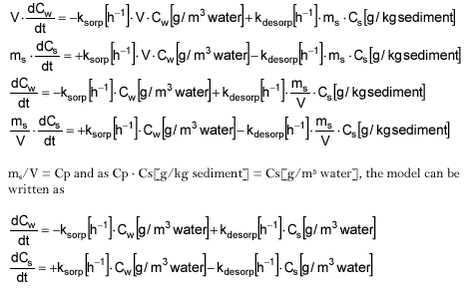
where Cw is the concentration in water [g/m3]. Cs is the concentration in the sediment [g/m3 water] and ksorp and kdesorp are sorption and desorption coefficients. t is time [h].
ksorp is a pseudo first order rate constant as the sorption rate actually depends both on water concentration and particle concentration.
At equilibrium, traditional Kd is given as:

which by multiplication with CP can be transformed to Kd‘

Kd‘ is thus dependent on CP. The value of Kd‘ is a direct expression of the relationship between sorbed and freely dissolved fractions of pesticide. Kd‘ of 2 means that 2/3 of the pesticide is sorbed while 1/3 is freely dissolved.
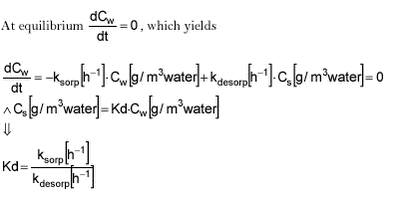
Kd‘ thus gives the relationship between ksorp and kdesorp at equilibrium.
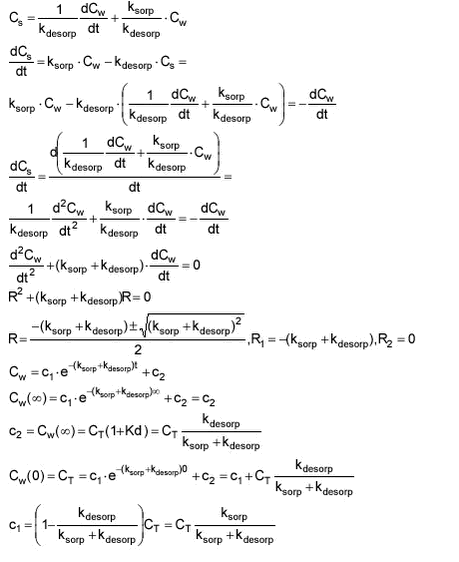
In order to fit the model, an analytical solution must be derived. This is done below for an experimental sorption set-up where Cs.start = 0 and Cw.start = CT. It is a closed system and thus CT = Cw + Cs at all times.
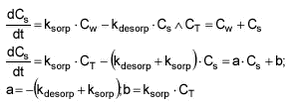
The analytical solution is:
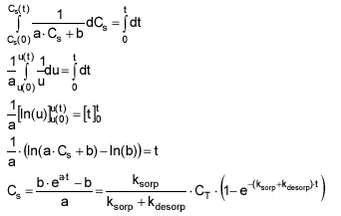
The same can be done with Cw
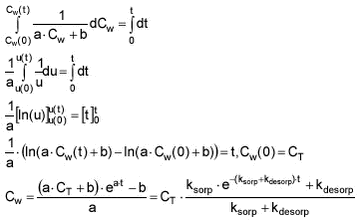
ksorp and kdesorp can be fitted to laboratory sorption data using the equations for either Cw or Cs and non linear regression.
Alternatively, ksorp and kdesorp can be fitted with the analytical expression for Kd‘apparent:

with which both measured water concentrations and sorbent concentrations can be taken into account. However, depending on the partition coefficient and the experimental set-up, either Cw or Cs will be more reliable for fitting. If only Cw or Cs is used for fitting, CT becomes important and it should be the actual sum of Cw and Cs excluding pesticide sorbed to glass and other.
From experiment to model
If it is assumed that Kd is independent of particle (sorbent) concentration CP and thereby Kdmodel = Kdexperiment, the following will be true:
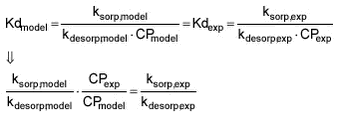
As mentioned earlier, it can be theorized that the sorption rate will be dependent on particle concentration because the probability of a pesticide molecule meeting a particle to sorp to is proportional to particle concentration. On the other hand, the desorption rate, i.e., the probability of a pesticide molecule to desorp from a particle, is not dependent on the particle concentration but rather on the sorbing tendency (attractive forces).
Therefore, the following can be written:

This means that sorption rate constants derived from experiments at one particle concentration must be adjusted with the relevant particle concentration when entered into the model.
The actual fitting of ksorp and kdesorp is based on data sets of time and Cw and CT = Cw [g/m3 water] + Cs [g/g sediment]CP [g sediment/m3 water]
The time it takes to reach a certain concentration can be calculated as:
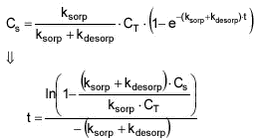
The time that it takes for Cs to reach a certain degree of equilibrium can then be calculated to be:
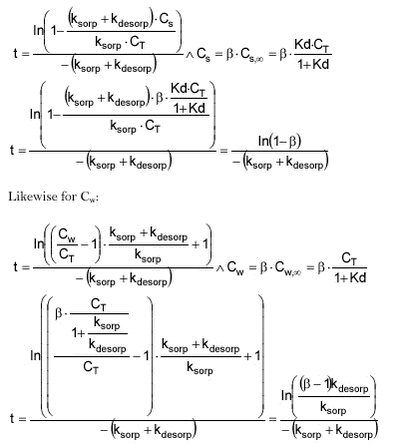
The last two formulas show that the time to reach equilibrium is dependent on the rate constants and larger values of either a single or both rate constants will lead to faster equilibrium. If the particle concentration differs between the model situation and the experiment, so will the time to equilibrium. In general, the particle concentration of suspended matter in the stream will be lower than in the experiment and thus the time to equilibrium will be longer.
Another way of solving the equation:
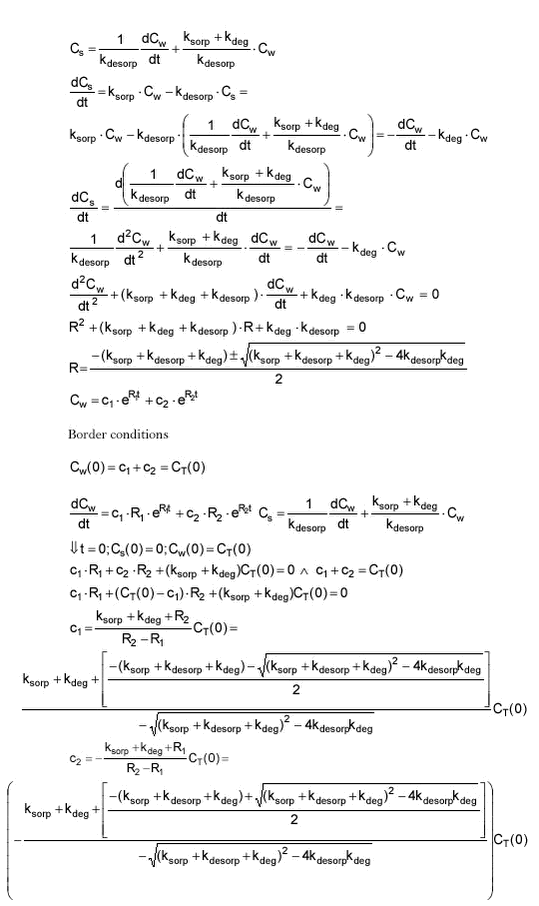
When degradation of a pesticide in the water phase is included, the model will be

For the fitting of degradation data (Ctotal measured), an expression for Ctotal is derived:
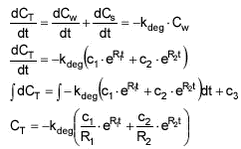
In calculations, c1‘ and c2‘ is used. c1‘=c1/(R1 * CT(0)) and c2‘=c2/(R2 * CT(0)) and thus

In the model, a strongly sorbing pesticide will be modelled by relatively fast sorption and relatively slow desorption. If the degradation rate is not high (lower than sorption rate), a very slow degradation will occur as both the desorption and degradation rates are slow. If the degradation rate is very high (faster than desorption k2>k1 and similar to sorption), an initial fast degradation will occur until sorption has taken place. The degradation will subsequently be limited by desorption. If the sorption, desorption and degradation rates are comparable, the disappearance will be similar to first order. If the sorption is weak and much slower than degradation, a fast initial almost complete disappearance will occur followed by a long period of slow desorption-limited degradation (for the same relationship between the rate constants, the curve will be compressed on the timescale with a decrease in values and expanded with an increase in values).
10.22 G.1 Centrifugation
Centrifugation was conducted in a small ultracentrifuge at 9000 rpm. This was the maximum speed that the centrifuge tubes could withstand without breaking. The centrifuge had 6 slots for 7-mL glass centrifuge tubes.

RCF: relative centrifugation factor [g]. ù: rotational speed [rad/s]. rpm: rotations per minute. g: gravitational force. x distance of particle from rotor centre [m].
The sedimentation speed is given by
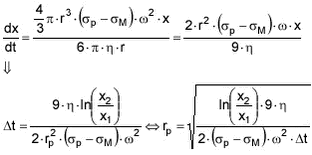
r: particle diameter. ç: viscosity of liquid. óP: particle density. óM: media density. x1: distance from centre to top of solution. x1: distance from centre to bottom of solution. t: time
The centrifuge used had the data x1 =4 cm, x2 = 8 cm and if it is anticipated that the density of the particles is 1.8 kg/L and the viscosity of the water is ç= 8.95
10-3 g/s
cm, it can be calculated from the expressions above that particles with a radius larger than approx. 0.05 µm will be sedimentated within the 60 min of 9000 rpm used for centrifugation in this experiment. If the density of the particles is higher (e.g. quartz), even smaller particles will be sedimentated.
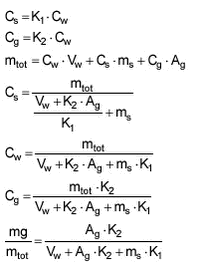
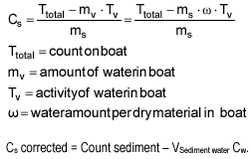
10.23 G.2 Three-compartment model
| Front page | | Contents | | Previous | | Top |
|