Calibration of Models Describing Pesticide Fate and Transport in Lillebæk and Odder Bæk Catchment
1 Introduction
The project "Pesticides in Surface water" concerns itself with formulation of a model for evaluation of transformations and transport of pesticides to surface water. The aim of the project is to produce a model to be used in the registration procedure.
Based on work carried out in the inception phase of the project (DHI et al., 1998, repeated in Styczen et al., 2004b), it was decided to base the model on existing representative 1. order catchments, in order to ensure that the parameterisation and weight given to the different processes would be realistic. This choice was based on
- an analysis of scale of different processes, and
- the need to be able to evaluate the effect of spraying of a field in combination with all the other activities taking place in the same catchment, influencing both the water flow in the stream and the background concentration of pesticide.
A model is therefore calibrated for each of the two selected catchments and the resulting setup is transformed to scenarios. The scenarios are packed with a special interface that only allows the user to change pesticide relevant parameters.
This report only concerns the calibration phase of the work.
1.1 Basic information on the selected catchments
The exact details of considerations leading to the choice of the catchments are described in the inception report (DHI et al, 1998). A key issue was that one of the catchments should represent moraine clay soil (soil type 5 and 6) and another sand soil (soil type 1 and 2)[1]. Together these soil types cover about 58% of the Danish arable area. According to the information available at the time, two catchments from the national monitoring programme (NOVA), with an adequate data availability could be selected to cover these conditions. No data set exists that represents soil type 3 and 4, making up 28% of the arable area.
The catchments Lillebæk on Funen (4.4 km2) and Odder Bæk in Northern Jutland (11.4 km2) were selected as study areas ( and ). Both catchments are included in the Nation-wide Monitoring Programme under the Action Plan on the aquatic Environment. The monitoring is presently carried out in both catchments under the programme "NOVA 1998-2003".
The soil types in the areas are shown in and the land use and distribution of crops in Table 1.2.
Figure 1.1 Location of the two study catchments.
Figur 1.1 De to modeloplandes geografiske placering.
Table 1.1 Distribution of soil types in Lillebæk and Odder Bæk catchments.
Tabel 1.1 Fordeling af jordtyper i Lillebæks og Odder Bæks oplande.
| jb.no FK |
1 1 |
2 2 |
3-4 3 |
5-6 4 |
7 5 |
8-10 6 |
11 7 |
Total | |
| Odder Bæk | in ha in % |
804 72 |
187 17 |
73 7 |
55 5 |
1119 101 |
|||
| Lillebæk | in ha in % |
17 4 |
404 96 |
421 100 |
Table 1.2 Existing Land Use in Odder Bæk and Lillebæk. The coverage of each land use type is given in %.
Tabel 1.2 Arealanvendelsen i Odder Bæks og Lillebæks oplande. Tallene er opgivet i %.
| Figures from 1997 | Odder Bæk | Lillebæk |
| Spring cereals | 25,1 | 21,2 |
| Winter cereals | 20,6 | 43,8 |
| Seeds | 1,2 | 21,0 |
| Pulses | 11,0 | 0,03 |
| Root crops | 4,5 | 2,10 |
| Grass and green fodder1 | 36,3 | 9,0 |
| Plantation and forest | 1,3 | 2,9 |
| Total | 100 | 100.03 |
| Continuous grass | 12,9 | 1,25 |
1 Please note that the permanent grassland is included in the statistics.
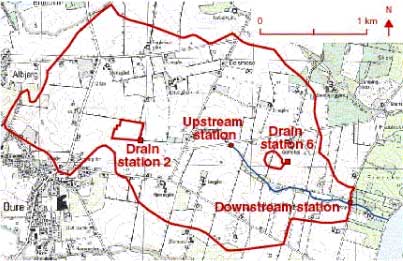
Figure 1.2 Lillebæk catchment, including 2 drain stations and 2 stream stations.
Figur 1.2 Lillebæk-oplandet, med angivelse af målestationer - to drænstationer og to afstrømningsstationer.
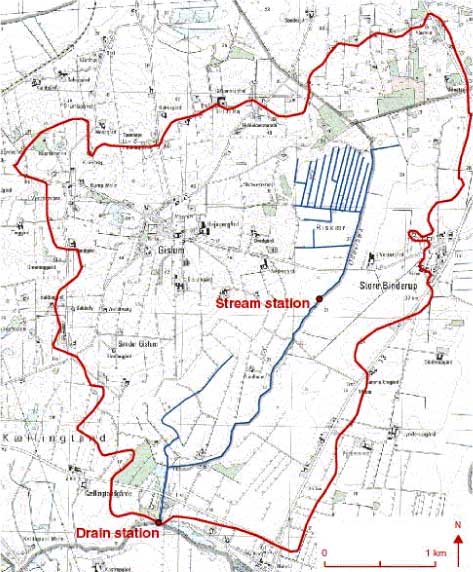
Figure 1.3 Map showing the Odder Bæk catchment with the stream and drain monitoring stations.
Figur 1.3 Kort over Odder Bæk-oplandet med å-og dræn-målestationer.
In the two catchments the following monitoring takes place every year
Lillebæk
- 6 soil moisture stations
- 6 double groundwater stations close to the soil moisture stations, with two bore holes in each of the depths 3 and 5 meters
- 9 separate groundwater stations were established. They were set with three filters on each station, but presently only 4 are in use. On three stations, one filter is in use and on the fourth station 2 filters are in use.
- 5 drain stations, of which 4 are connected with soil moisture stations
- 2 stream flow stations
- 1 weather station
Odder Bæk
- 6 soil moisture stations
- 12 groundwater stations close to the soil moisture stations, with two in each
- 12 separate groundwater stations
- 3 drain stations stream flow stations of which two were cancelled in 1993
- 2 weather stations. However, one is outside the map, approximately 2 km west of the catchment
In both catchments a questionnaire survey is conducted every year on farming practices at field level including information on spraying of pesticides (amount, time of year, etc.). The soil moisture station consists of ten Teflon suction cups. The cups are placed in a V-shaped pattern within an area of about 100 m2. The groundwater stations consist of three filters placed at approximately 1.5, 3 and 5 m below the surface. Furthermore, a monitoring well has been established near each groundwater station in the secondary groundwater occurrences, typically to a depth of 5-7 m, in Odder Bæk, however, to a depth of 20 m. Some deep wells may be present, with a filter depth down to 109 m.
In Lillebæk four pesticide monitoring stations are installed (). Two stream monitoring stations have been installed, one covering the water and pesticide loss from the entire catchment (436 ha) and one covering an upstream and culverted sub-catchment of approx. 230 ha. Moreover, two drain stations have been installed covering a field of 4.2 and 2.1 hectare, respectively.
In the Odder Bæk two pesticide monitoring stations are installed, consisting of one stream station covering the entire catchment (1143 ha) and one drain station covering a field of 32 ha ().
At all monitoring stations water stage is recorded continuously and stored on a data logger. Discharge is measured at regular intervals at every stream and drain station, which enables stage-discharge relationships to be established for the stream stations and V-notch weir-formulas in case of the drain stations. Thus, instantaneous discharge can be calculated for each station. Online access to the stage recorders is assured via connection to the telephone net, in case of the two drain stations in the Lillebæk via the mobile phone net.
The measurement programme was extended with a pesticide monitoring programme, which is described in Iversen et al. (2003).
1.2 Basic information on the two streams
Lillebæk is fairly steep and drops from approximately 50 m.a.s. (meter above sea level) to sea level over 3 kilometre. The upper half part of Lillebæk is submerged in pipelines, and the downstream part is open channel. The small tributaries are best described as ditches and the downstream part of Lillebæk as a small creek. Cross-sections have been measured in the downstream part – typically 1.5 meter wide and 0.5 meter deep.
In Odder Bæk the spring is found approximately 25 m.a.s. and drops over 4 kilometre to 10 m.a.s. Only one small tributary supplements Odder Bæk – the Gislum enge afløb, which is a pipeline. Cross-sections have been measured in Odder Bæk – typically showing 4-5 meter wide cross-sections of 1 meter depths.
Footnotes
[1] JB1: 0-5% clay, 0-20% silt, 0-50% fine sand, 75-100% sand in total, <10% humus
JB2: 0-5% clay, 0-20% silt, 50-100% fine sand, 75-100% sand in total, <10% humus
JB3: 5-10% clay, 0-25% silt, 0-40% fine sand, 65-95% sand in total, <10% humus
JB4: 5-10% clay, 0-25% silt, 40-95% fine sand, 65-95% sand in total, <10% humus
JB5: 10-15% clay, 0-30% silt, 0-40% fine sand, 55-90% sand in total, <10% humus
JB6: 10-15% clay, 0-30% silt, 40-90% fine sand, 55-90% sand in total, <10% humus
Version 1.0 November 2004, © Danish Environmental Protection Agency