Calibration of Models Describing Pesticide Fate and Transport in Lillebæk and Odder Bæk Catchment
2 Model Descriptions Selected
- 2.1 Deposition on Soil
- 2.2 Wind Drift
- 2.3 Dry Deposition
- 2.4 Soil Surface Processes
- 2.5 Processes in the Soil Matrix
- 2.6 Macropore- and colloid transport
- 2.7 Transport in drains and groundwater
- 2.8 Transport in the groundwater
- 2.9 Transport in streams
- 2.10 Sedimentation and re-suspension in ponds and streams
- 2.11 Diffusive exchange between the water column and the sediment
- 2.12 Sorption to sediment particles and suspended matter
- 2.13 Sorption to macrophytes
- 2.14 Biological degradation of pesticides
- 2.15 Photolytic degradation of pesticides
- 2.16 Evaporation of pesticides
- 2.17 Chemical or hydrolytic degradation of pesticides
The modelling systems selected are MIKE SHE for the catchment and MIKE 11 for the streams. (DHI 2000a, 2000b, 2000c, 1997).
MIKE SHE is at present the only physically based, dynamic, fully distributed modelling tool for integrated simulation of all major hydrological processes occurring in the land phase of the hydrological cycle. The combination of a physically based and a distributed model enables a direct use of field data for model building and it enables linking to spatial data. The integrated approach makes MIKE SHE suitable for simulation of hydrologic systems where surface water and groundwater interactions are significant. An overview of MIKE SHE is shown in .
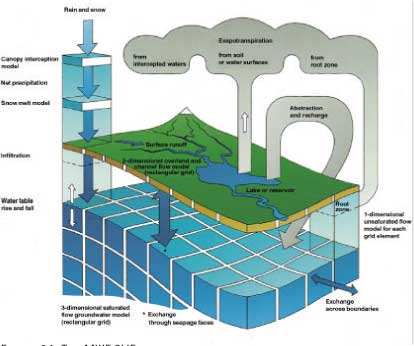
Figure 2.1 The MIKE SHE model, including a two-dimensional surface description, a one-dimensional unsaturated zone and a three-dimensional groundwater description.
Figur 2.1 MIKE SHE-modellen, indeholdende en todimensional overfladebeskrivelse, en en-dimensional umættet zone og en tredimensional grundvandsbeskrivelse.
The basic MIKE SHE module is the Water Movement module describing the hydrological processes. The hydrological components included are interception-evapotranspiration, infiltration, snow melt, 1-dimensional flow in the unsaturated zone, 3-dimensional ground water flow, overland flow in 2-dimensions and 1-dimensional stream flow, all of which are fully coupled.
The 1-dimensional stream flow is handled by the MIKE 11 model. MIKE SHE and MIKE 11 are dynamically linked. Exchange between the two models is described using 3 components – runoff, drainage and baseflow. The direct runoff is a result of water ponding on the terrain generating flow on the overland to the stream – the reverse process is also possible (stream flooding the terrain) – however, this is not applicable for these models. Drainage is generally used to describe the flow that takes place in drainpipes and small ditches to the stream. Finally the baseflow is the exchange between the stream and the groundwater. The water level and the groundwater level determine the direction of the flow – whether the stream is recharging or discharging the groundwater zone. Solutes are transported with the water and the basic transport is described with the MIKE 11 AD (advection-dispersion) module.
MIKE SHE can be extended with a module for solute transport by advection and dispersion (MIKE SHE AD), and different modules describing chemical reactions. For this particular work an extended version of the sorption/degradation module (MIKE SHE SD), including colloid transport, has been used.
With respect to the general description of the water flow, the models are unchanged. In order to model pesticide transport a number of process descriptions have been added. These are described in overall terms in the following. Details of specific process descriptions can be found in separate reports. The processes deposition on soil, wind drift, and dry deposition are not built into the version of the model used for calibration. However, results of the process descriptions are used either for estimation of input or evaluation of results. These processes are build into the final registration model, where conditions are more standardised than here.
The hydraulic transport processes considered, operating at catchment scale, are shown in . Transmission and transport processes operating at the level of ponds and streams appear from . These processes are implemented in a special MIKE 11 pesticide (PE) module developed through the project. The pesticide module is added on top of the AD and HD-module of MIKE 11 as illustrated on .
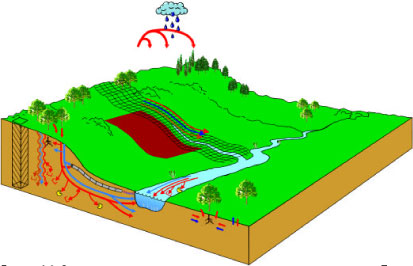
Figure 2.2 Schematic overview of pathways considered in the work. The compound may move as drift or dry deposition through the air. Along the surface, the compound may be transported with the water or on particles. In the soil, the compound may move through the matrix in soluble form or through the macropores as solutes or with colloids. The compound may move to groundwater and drains and from there to the stream. Plant uptake, degradation and sorption are possible processes. Sorption and degradation processes are also active in the stream.
Figur 2.2 Skematisk oversigt over de transportveje, der har indgået i arbejdet. Stoffet kan transporteres som drift eller tørdeposition gennem luften. Langs med overfladen kan pesticidet transporteres med vand eller på partikler. I jorden kan pesticidet bevæge sig gennem matricen i opløst form eller gennem makroporer som opløst stof eller med kolloider. Stoffet kan transporteres til grundvand og dræn og herfra til vandløbet. Planteoptagelse, nedbrydning og sorption er mulige processer. Sorption og nedbrydningsprocesser er også aktive i vandløbet.
Figure 2.3 Conceptual drawing of transmission and transport processes for pesticides operating in streams and ponds.
Figur 2.3. Konceptuel oversigt over udvekslinger og transportprocesser for pesticider i vandløb og vandhuller.
Figure 2.4 The connections between the modules of the MIKE 11 model.
Figur 2.4 Sammenhængen i MIKE 11's moduler.
2.1 Deposition on Soil
The amount of pesticide reaching the soil is, in these simulations, a function of the plant cover. The values used to estimate the actual deposition on soil for a given pesticide are "handpicked" from experiments carried out as part of the project (Jensen and Spliid, 2003), for winter wheat, barley, potatoes and sugar beet). For other crops, the data stem from the FOCUS groundwater report (FOCUS 2000).
2.2 Wind Drift
Wind drift is estimated according to Ganzelmeier. Based on an evaluation of wind speeds in Denmark compared to the conditions, under which the Ganzelmeier figures were derived, it is assumed that the 95% percentile of Ganzelmeier equals the average Danish conditions (Asman et al., 2003). The wind drift module developed for the scenario-runs has not been used in the model calibration phase, but wind drift has been taken into account when comparing results to observations.
2.3 Dry Deposition
Dry deposition is estimated according to the procedure described in Asman et al. (2003). Dry deposition is the result of the emission of pesticide from the soil or crop surface. The emission is an input in the dry deposition, also calculated by the procedure. The estimated deposition in the stream takes place over seven days of 21 days, depending on whether the deposition takes place from a plant cover or a bare soil. The calculation is carried out for average climatic conditions. The dry deposition module developed for the scenario-runs has not been used in the model calibration phase. It has, however, been considered when comparing results to observations.
2.4 Soil Surface Processes
Water that does not infiltrate may flow on the soil surface to a surface water body or infiltrate along the way if conditions allow. Initially, it was the intention that soil erosion would be included in the model as a mean of transport for pesticide. However, during the two observation years, erosion was not observed in the catchments, and simulations produced hardly any surface flow. It was therefore decided not to include the description in the final model.
2.5 Processes in the Soil Matrix
Water infiltrates from the surface to the saturated zone through the soil matrix or through macropores. Water movement in the matrix is described with Richards' equation. The physically based description of macropore flow assumes a secondary pore domain through which water is routed separately, but allowing exchange with the surrounding bulk porosity (or matrix porosity). Evaporation takes place by uptake through plants (transpiration) and through the soil surface. In the matrix, pesticide can be adsorbed according to a linear or a Freundlich isotherm, and both the adsorbed and the soluble form of the pesticide can degrade (1. order). Plant uptake of pesticide is defined as a fraction of the transpiration stream (DHI 2000).
The transport of solutes in the saturated zone is governed by the advection-dispersion equation, which for a porous medium with uniform porosity distribution is formulated as follows:
where c is the concentration of the solute, Rc is sources or sinks, Dij is the dispersion coefficient tensor and vi is the velocity tensor.
The advective transport is determined by the water fluxes calculated during a MIKE SHE WM simula.tion. In order to determine the groundwater velocity the Darcy velocity is divided by the effective porosity:
![]()
where qi is the Darcian velocity vector and θ is the effective porosity of the medium.
Volatilisation is not described explicitly in the model. However, the emission from leaves and the soil surface used in the description of dry deposition is likely to take into account part of this effect.
2.6 Macropore- and colloid transport
Water may move from the soil surface or the soil matrix to the macropore domain, if it is present as free water on the soil surface, or if a pressure builds up in a particular layer in the soil. Water re-infiltrates from the macropore to the matrix as a function of pressure differences between the two domains. Pesticides move with the water from the surface or the matrix to the macropore and back, and thereby bypass the soil matrix. In addition, colloid transport has been added to the description (Holm et al., 2003). Soil particles can be loosened by rain and follow the water into the macropores or soil matrix. The particles will be filtered from the flow in the matrix but only to a limited degree in the macropores. The study on colloid transport (Holm et al., 2003) recommended that the transport out of macropores was set to 0. As these particles can interact with pesticides (mainly with a high Kd-value), they may act as a transporting agent for pesticides.
2.7 Transport in drains and groundwater
The model description includes drains, which are activated when the groundwater level raises above the level of the drains. Drainage cannot be generated from layers above the groundwater. In reality, however, drainage can be generated from perched water tables, but this is not included in the model. The concentration of the water moving in the drain is equal to the concentration in the uppermost calculation layer of the saturated zone in the model. Water is routed from the saturated zone to the drain with a drainage constant (linear reservoir description).
2.8 Transport in the groundwater
Transport in the groundwater is described in a three-dimensional network. Flow of water is described by the 3-D Boussinesq Equation for saturated flow. Water and solute enters the groundwater from above as recharge from the unsaturated zone, and may leave the zone either through the drain (from the uppermost layer of the groundwater) or by flowing to the stream. In principle, both degradation and sorption of pesticide may take place in the groundwater zone. However, through the parameterisation degradation is set to zero in the groundwater zone. This is the recommendation given by FOCUS for pesticide registration purposes (FOCUS, 2000).
2.9 Transport in streams
The HD (hydrodynamic) module of MIKE 11 contains an implicit, finite difference computation of unsteady flows in rivers and estuaries. The formulations can be applied to branched and looped networks. The computational scheme is applicable to vertically homogeneous flow conditions ranging from steep river flows to tidally influenced estuaries. Both sub-critical and supercritical flow can be described by means of a numerical scheme, which adapts according to the local flow conditions. The complete non-linear equations of open channel flow (Saint-Venant) can be solved numerically between all grid points at specified time intervals for given boundary conditions.
2.10 Sedimentation and re-suspension in ponds and streams
Pesticides adsorbed to suspended particles in the water column might be transported to the sediment when suspended particles settle. Similarly, pesticides adsorbed to particles in the sediment might be transported to the water column when re-suspension of sediment occurs. Hence the net result of theses process is a function of the concentrations of pesticides sorbed to particles in sediment and water column and the re-suspension and sedimentation rates. These processes are implemented in the MIKE 11 model, but data for the dynamics of the sediment is generally not available for the two catchments. It was therefore decided to set the exchange of sorbed pesticides between the water column and the sediment to 0. For ponds this decision is supported by experiments with artificial ponds, which showed that transport of pesticides by sedimentation was insignificant compared to the transport by diffusion (Mogensen et al., 2004).
2.11 Diffusive exchange between the water column and the sediment
According to (DHI et al., 1998) the sediment in the streams is assumed to be well mixed and of a thickness of about 2 cm (Styczen et al., 2000b) and the sediment should therefore be described by a single box. The assumptions for this was that the sediment is supposed to undergo frequent minor re-suspensions even through calm summer conditions and that water entering the stream from the catchment is supposed to penetrate the sediment. As a consequence the sediment is supposed to be well mixed with regard to the concentrations of pesticides and a one-layer model of the sediment is therefore considered as appropriate.
The sediment of the ponds was assumed (DHI 1998 and Styczen et al., 2000b) not to undergo re-suspension as frequent as in the streams and the sediment might be stratified with regards to the concentrations of pesticides due to diffusion. To describe this diffusion numerically the sediment layer has to be divided in to multiple layers to allow a description in accordance with Ficks second law (Styczen et al., 2004c).
2.12 Sorption to sediment particles and suspended matter
The pesticide in the water column and in the sediment bed might either be sorbed to particles or dissolved. In the water column this sorption is assumed to be kinetic and the kinetics was described by a (pseudo) first order sorption rate and a first order desorption rate. This description implies that the sorption is considered as reversible, which was verified by the sorption experiments of (Helweg et al., 2003).
To implement this description of diffusion relying on Ficks second law (see section ) it was for logistic reasons necessary to describe the sorption in the sediment of the ponds by an equilibrium approach. However, diffusive processes occurring at a length scale of less than 1 mm might resemble the process of kinetic sorption. Hence it can be argued that the kinetic of sorption in the sediment is lumped in to the effective diffusion coefficient derived through the calibration exercise (section 5).
2.13 Sorption to macrophytes
The pesticide in the water column might also sorb to macrophytes. As for the sorption to sediment particles and suspended matter the sorption to macrophytes was described by a first order sorption and a first order desorption rate.
2.14 Biological degradation of pesticides
Pesticides in the porewater of the sediment and dissolved in the water column are assumed to undergo biological degradation. In every case the biodegradation are formulated as a first order degradation. The temperature influence on biodegradation was described by an Arrhenius equation.
2.15 Photolytic degradation of pesticides
The dissolved pesticide in the water column might undergo photolytic decay, which in theory might be either direct or indirect. Direct photolysis takes place if the chemical absorbs light, and as a consequence, undergoes transformation. Indirect photolysis takes place if the chemical receives energy from another excited species (sensitised photolysis) or very reactive, short-lived species (e.g. peroxy-radicals, singlet oxygen), which are formed due to absorption of light by dissolved organic materials (Schwarzenbach et al 1993). All though descriptions of the formulation of indirect photolysis are available from the literature (Schwarzenbach et al 1993) implementation of indirect photolysis in the stream model was considered as irrelevant. Thus the parameterisation of the process of indirect photolysis requires a detailed knowledge about the chemical composition of the organic mater of the stream water which not is readily available. As a consequence the total photolytic degradation might be underestimated. The photolytic degradation was described as a first order decay.
The first order photolytic decay rate was calculated as a function of the intensity and the spectral composition of the light and the light attenuation in the water column, which depends on the concentration of suspended matter and on the light absorption spectra of the pesticide. The light attenuation in the water column was estimated as a part of the calibration exercise.
2.16 Evaporation of pesticides
Evaporation of pesticides from the water column to the atmosphere is described by the same equations as used for description of the dry deposition of pesticides from the atmosphere to the water column (section ).
2.17 Chemical or hydrolytic degradation of pesticides
Hydrolysis of the dissolved pesticide in the water column and the pore water were described as a first-order reaction given by (Schwarzenbach et al., 1993). The hydrolysis rate constant may include contributions from acid- and base-catalysed hydrolysis as well as nucleophilic attack by water.
Version 1.0 November 2004, © Danish Environmental Protection Agency