Calibration of Models Describing Pesticide Fate and Transport in Lillebæk and Odder Bæk Catchment
6 Calibration and Validation of Pesticide Transport in the Catchment
- 6.1 Procedure
- 6.2 Simulation Results
- 6.3 Pesticide in drains
- 6.4 Uncertainty on the results caused by uncertainty on Koc and DT50
6.1 Procedure
A procedure for validation of pesticide simulations was outlined in the first status report of the project (DHI et al., 2000).
The proposed procedure includes the following steps:
- Calibration and validation of the water flow module.
- Blind simulation of the pesticide concentration in upper groundwater, and of concentrations and load in drain and stream. For drains, colloid-bound pesticide may be evaluated in some of the events.
- If pesticide data allows, calibrate pesticide load and concentrations in drain and upper groundwater on data from year 1 and validate on year 2. For drains, colloid-bound pesticide may be evaluated in some of the events.
- If the same pesticide is applied above more than one drain, calibrate pesticide parameters on one drain and validate on the second drain. For drains, colloid-bound pesticide may be evaluated in some of the events.
- Calibrate loads and pesticide concentrations in the drains and upper groundwater and validate on pesticide concentrations in the stream. This step is complicated by the fact that the stream may receive drainage water from point sources such as farmyards.
Some pesticides are not applied to areas near the monitored drains, and for these pesticides only the load and concentration in the stream can be evaluated.
The descriptions of colloid transport in the drain and the transformations of pesticide in the river were tested in more detail elsewhere.
The calibration exercises mentioned in step 2 and 3 require that the same pesticide be applied to an area two years in a row or to two different drains.
During the calibration it is necessary to start at the beginning of the season 1998, and work forward in time with the different pesticides. If earlier applications are known, the earliest may be considered the starting point. Pesticides with a widespread use have higher priority in the beginning of the calibration phase. Pesticides with limited area coverage may influence the general parameterisation in certain areas of the model. The aim of the processes is to gain a picture of how much the calibration is improved with more information about new pesticides and the spatial distribution of pesticides.
6.2 Simulation Results
The calibration procedure implemented included steps 1 and 2 mentioned in Section 6.1. Furthermore, drains were included in the evaluation for Lillebæk to the extent possible (step 3, 4). The pesticides bentazon, Terbutylazin, isoproturon and pendimethalin were selected for analysis. They were selected because they were detected in the stream of both Odder Bæk and Lillebæk.
It should be noted that due to the fact that some fields with pesticide applications exist in the field records without having a location on the field map, there is some uncertainty related to the actual applications of pesticide, particularly in Odder Bæk. In addition, pesticide application on farmyards and the like are not recorded in the data. Figures showing the locations of spraying and the loads of pesticide for each of the four pesticides for the three spraying seasons (1997-1998, 1998-1999, 1999-2000) for Odder Bæk and Lillebæk are shown in Appendix E and F, respectively.
The data used for the blind simulation mentioned in step 2 in Section entailed the application of the data on pesticide sorption and degradation from the Danish Environmental Protection Agency, given in Section and the data in Appendix D.
6.2.1 Odder Bæk
The results of the simulation of pesticide transport in Odder Bæk are shown in Figure 6.1, which shows the observed and simulated pesticide concentration in the stream at the outlet of the catchment and in the drain upstream (The location of the monitoring stations are shown in Figure 1.3). The simulation period was 1/7-1997 to ultimo 2000, but only the periods with detections and with simulated pesticide appearance in the stream and drain are shown.
Generally, pesticide concentrations in the right order of magnitude could be obtained with the blind calibration. Only in the case of isoproturon, further adjustment of the Kd and DT50 values were necessary. With the standard parameters, too little isoproturon leaching was simulated, and a two-fold reduction of the sorption (Koc decreased from 125 l/kg in the standard setup to 62.5 l/kg) and a two-fold increase in degradation (the half life time DT50 increased from 8 to 16 days) improved the match between observed and simulated concentrations. Overall, the organic matter content of the soil in the Odder Bæk catchment was decreased by a factor of two, in order to improve the simulation of all four pesticides. This was considered appropriate, as the measured values generally were very high. For the soil types that were categorised as organic, no data from measurements were available and hence the organic matter contents were estimated anyway.
The simulated pesticide concentrations were comparable to the observed levels. However, the dynamics, with distinct leaching peaks, concurrent with flow events, which is apparent from all pesticides, could not be captured satisfactorily by the model. This was most likely due to intermittently fast transport through macropores in the soil. Originally, Odder Bæk was selected to represent a sandy catchment without macropores, and thus one type of scenario. The decision not to include macropores goes back to the beginning of the project. However, this assumption was found not to hold true. The need for inclusion of macropores becomes even more evident in the case of pendimethalin where absolutely no leaching could be simulated with the standard parameters due to the exceptionally high sorption potential of this pesticide. The detection of Pendimethalin in the stream on several peak flow occasions is a clear indication of the presence of macropores, which enables a partial bypass of the upper soil layers that hold the largest sorption and degradation potential.
In the existing model description, the pesticides are leached to the stream through vertical matrix flow in the unsaturated zone and through fast or slow groundwater. This flow pattern, combined with the fact that no degradation in the saturated zone was assumed, entailed a subdued response, a too high background concentration, and an overall too high flux.
Another factor governing the response time of the leaching to the stream is whether drains are being activated. To obtain a fast response in the stream, drain flow, which bypasses lateral transport in the groundwater, is necessary. Drain flow is governed by the rise of the groundwater table to the drain depth and hence the intersection of these two in time and space becomes important. Especially, this could explain why only little leaching to the stream of Terbutylazin is taking place in the model. Terbutylazin is only applied on a small part of the catchment – in 2000, where the highest concentrations are found, it is only applied to two fields of which one is on the boarder of the catchment. In the model, the other field is drained but it does not contribute much with drain flow.
Another uncertainty related to the drained areas is the specification (location and extension) of the contributing area to the upstream drain where pesticide content has been monitored separately. In the case of Isoproturon, the simulated concentrations are too low, whereas in the case of Bentazon, the simulated concentrations are too high. A number of fields receiving isoproturon were situated just next to the area assumed to drain to the drain station. A slight shift in the defined drainage area will thus change the simulated concentrations. Furthermore, the drain is situated in an area of organic soil, for which no details concerning the soil description is available. The content of organic matter in this soil is thus guessed.
Finally, the observations can be influenced by point sources, e.g. a spill more or less directly into the water body. The peak on June 12, 1999 in bentazon concentration downstream does not occur in direct association with known applications inside the catchment. The last pesticide application immediately before the peak event was on May 28 and two samples after this date (on June 6 and 9) did not contain the pesticide, indicating that field application most likely was NOT the source.
In conclusion, the response in Odder Bæk is simulated with the right level of concentrations, but it is somewhat subdued, with a high background concentration presumably due to the model assumptions of no macropores and no degradation in the saturated zone. Furthermore, model uncertainties are related to the drain specifications. Finally, Some detections could be influenced by point sources and hence not regular surface applications as assumed in the model.
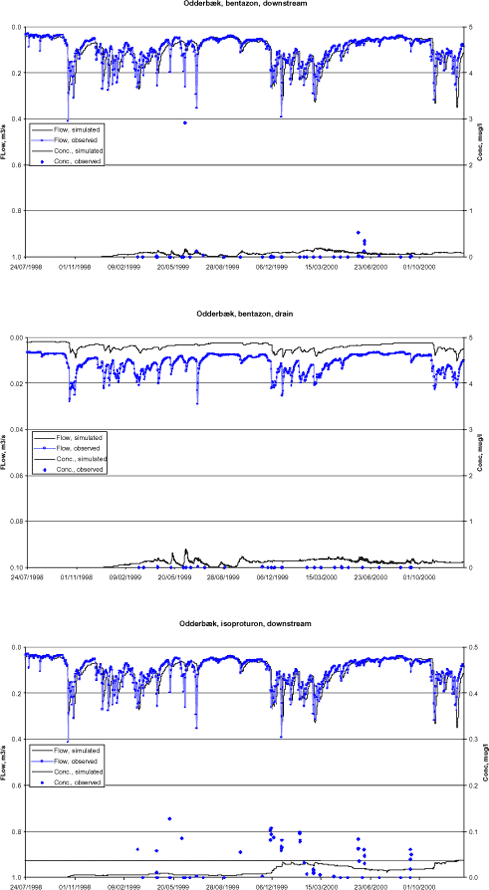
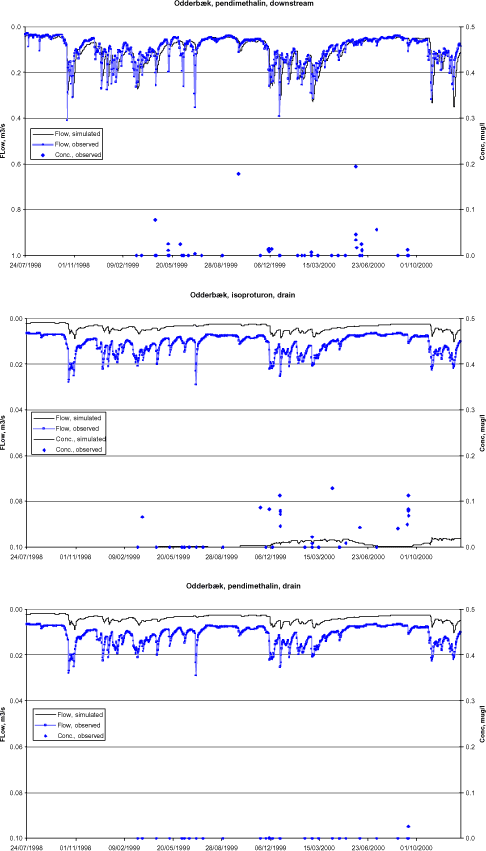
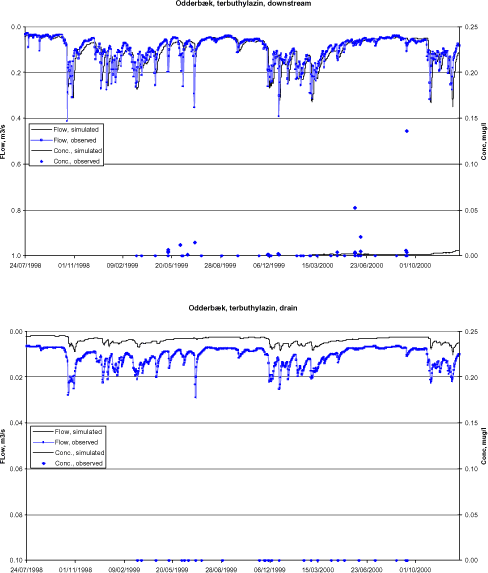
Figure 6.1 Simulated and observed flow and pesticide concentration in Odder bæk.
Figur 6.1 Simuleret og observeret afstrømning og pesticidkoncentration i Odder bæk.
6.2.2 Lillebæk
The results of the simulation of pesticide transport in Lillebæk are shown in figure 6.2. The figure shows the pesticide concentration at the downstream and upstream measuring station. The simulation period was 1/1-1997 to ultimo 2000, but only the period 1/7-1997 to ultimo 2000 are shown, because no observed nor simulated pesticide occurred in the stream during the first half year of the simulation period.
6.2.2.1 Bentazon
For bentazon, less leaching is simulated in the upstream than the downstream station, which is in accordance with the pesticide application source locations. Except for the two occurrences in the spring of 1999 upstream and the occurrence in the fall of 1999 downstream, the levels simulated are in good agreement with the observations. The peak observed upstream in 1999 is most likely a point source, as only a very small field (0.4 ha), received bentazon in the spring of 1999, prior to the peak.
The peak observed downstream in the fall of 1999, however, can be explained by antecedent field applications. The reason for not simulating the peak could be that the drains on the fields receiving bentazon were not activated in the model during this period. One and a half months later, the simulated concentration increased, which probably reflects a delay of the breakthrough observed. The concentration simulated is then lower than observed in the peak. In the model, drain water stem from the upmost groundwater layer. This means that infiltrating water becomes mixed with water that percolated at an earlier stage, causing dilution. The limitation to the depth of the upmost calculation layer is that it has to include the full groundwater fluctuation. In reality the infiltrating water may not be mixed in such a large volume of water giving rise to higher concentrations.
Bentazon is applied exclusively in the spring, and according to the model, is primarily leached in the late fall, winter and spring periods. Downstream, more continuous leaching is simulated in the summer of 2000. This could be explained by the fact that no degradation is occurring in the model, below 1 m in the unsaturated zone, and in the saturated zone. Hence, pesticide that has entered the saturated zone, and is not captured by the drains, will eventually reach the stream in unaffected concentrations, whereas in reality, some degradation may occur in the shallow groundwater.
6.2.2.2 Isoproturon
Looking at the results for isoproturon, more leaching is simulated upstream than downstream. This is accordance with the location of sources, as more fields are located upstream of the upstream station than downstream. Also, the degradation potential is relatively high for isoproturon yielding a degradation also during the transport from the upstream to the downstream station.
There is a distinct pattern of heavy leaching in the spring and summer of 1998 and 2000, with less leaching in 1999, which reflects the intensive use of isoproturon in the fall of 1997 and 1999. Leaching persists through the summer months though applied in the fall the anterior year, and despite the fact that the sorption and degradation potential for isoproturon is higher than for bentazon. This could explained by the fact that the fields receiving isoproturon are located relatively far from the stream and that some degradation actually occurs in the groundwater, as opposed to the model description.
The downstream peak, observed on Oct. 23-24, is most likely not a point source as fields close to the downstream station are sprayed closely before. The reason for not capturing the peak in the model is, as the case was for bentazon, that the drains have not been significantly activated at this time.
To test whether the exagerated simulated isoproturon concentrations during 1999 and late 2000 could, as hypothesized above, be explained by a lack of degradation in the lower part of the soil profile and in the groundwater, an additional simulation was performed, in which degradation in the unsaturated zone (below 1 m) as well as in the groundwater was set to the same as defined for the soil layers between 0.8 and 1.0 m depth. The results are shown in Figure 6.3.
It is seen that the simulation is significantly improved, as the tailings from the previous pesticide application is deminished due to the additional degradation in the lower layers. This effect will be greatest for the pesticides with the highest degradation portential, and pesticides with sources furthest away form the stream. Of the four pesticides, isoproturon has the highest degradation potential, and hence the effect will be relatively larger here. However, when comparing the simulation results for isoproturon with the other three pesticides, this is also the one, that has the largest problem with exagerated talings. This could indicate that either too much is transported to the groundwater or that degradation does take place to some degree in the upper groundwater.
6.2.2.3 Pendimethalin
Leaching of pendimethalin, as opposed to in the Odder Bæk catchment, could be simulated in Lillebæk. This is because macropore flow and transport is included in the setup of Lillebæk.
The pattern of leaching of pendimethalin is comparable to the leaching pattern of isoproturon, which is because the fields and application times are very comparable. However, more downstream than upstream leaching is, simulated, as opposed to bentazon, because relatively more fields downsream of the upper station are receiving pendimethalin, but not isoproturon.
A better correspondence with observations is obtained for pendimethalin during the second half of 2000 than for isoproturon, due to lower degradation rates and hence less influence of the transport, and potential degradation, in groundwater.
Again, a discrepancy is observed between observations and simulations in the the beginning of the drainage season, in this case, both upstram and downstream. Point sources are not suspected, as peaks succeed all applications registered in the fall of 1999. Again, the lack of initial drain flow could explain thia discrepancy.
6.2.2.4 Terbuthylazin
The response pattern of terbuthylazin is very similar to that of bentazon. This is because terbuthylazin is also applied in the spring, and the number of fields sprayed, and in some cases, the location of fields, are the same. The concentration levels are, however, larger for terbuthylazin than for bentazon. Looking at the sorption and degradation potantial for the two pesticides, terbuthylazin is more persistent and more sorptive, which may partly outbalance each other. However, the unit doses applied in the case of terbuthylazin are significantly higher than for bentazon (56, 89, 13 % higher in the seasons 1997-1998, 1998-1999, 1999-2000), which may partly explain the higher concentrations.
When comparing the model results with the observations, it is obvious that much higher concentrations have been detected in the stream (especially upstream) than have been simulated. This is most likely due to unknown point sources that are not accounted for in the model. Upstream, the maximum concentrations are: 4.318 μg/l (obs., not shown) vs. 0.103 μg/l (sim.), whereas downstram, the maximum concentrations are: 0.330 μg/l (obs.) vs. 0.088 μg/l (sim.). This issue is discussed further in section 7.2. The observed concentrations are generally much higher upstream than downstream.
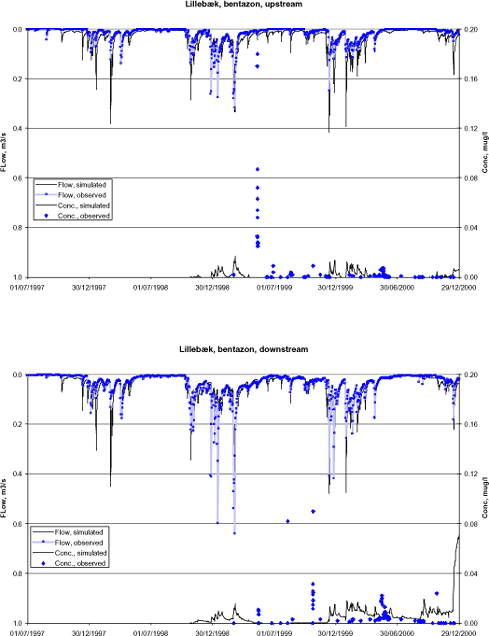
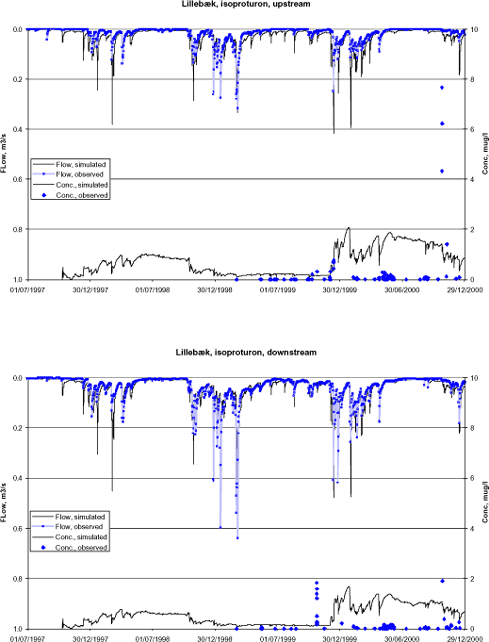
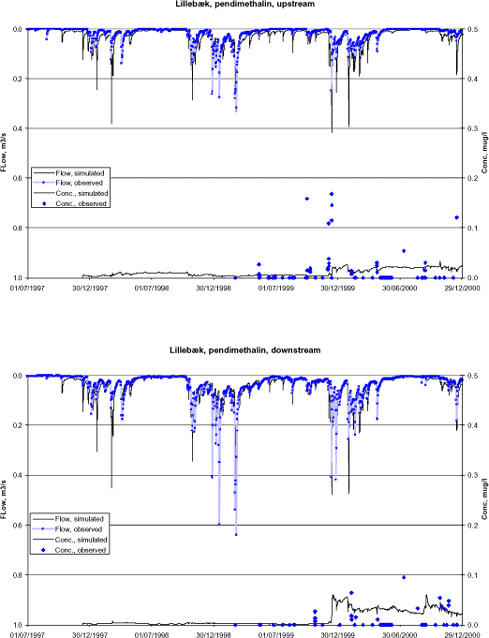
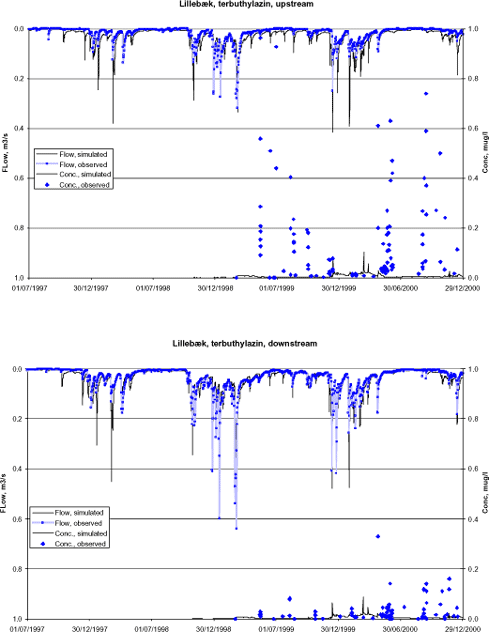
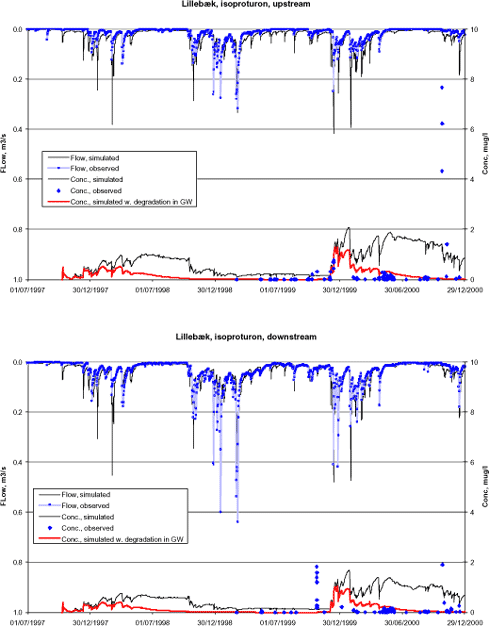
Figure 6.2 Simulated and observed flow and pesticide concentration in Lillebæk.
Figur 6.2 Simuleret og observeret afstrømning og pesticidkoncentration i Lillebæk.
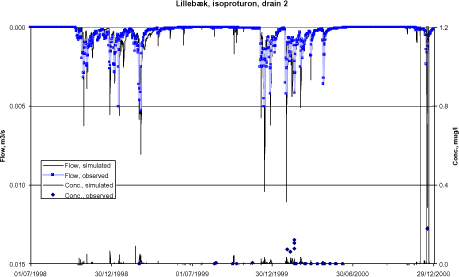
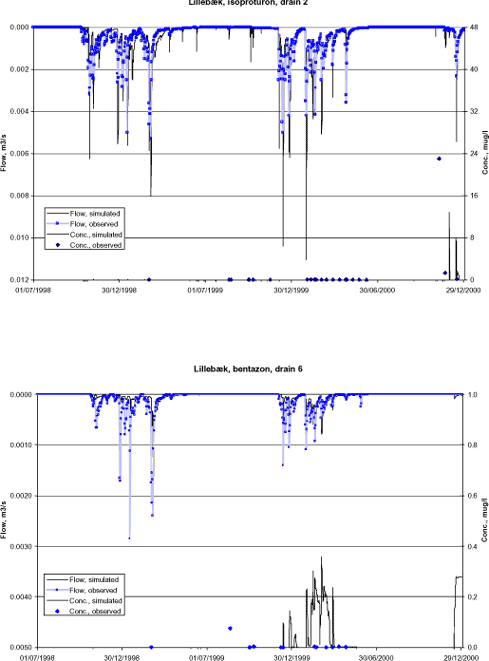
Figure 6.3 Simulated and observed flow and isoproturon concentration in Lillebæk. An additional simulation with degradation in lower layers and in groundwater has been included.
Figur 6.3 Simuleret og observeret afstrømning og isoproturonconcentration i Lillebæk. En ekstra simulering med nedbrydning i dybere lag og i grundvandet er inkluderet.
6.3 Pesticide in drains
Table 6.1 shows the pesticides sprayed in the two monitored drain areas in Lillebæk. The compounds, which are not monitored, are indicated in gray in the table. It is obvious that the chance of modelling pesticides on a drain is much better for drain 6 than for drain 2. However, only a few compounds are used on the same field two years in a row or on both drain 2 and drain 6.
Table 6.1 Pesticides applied on the catchment areas of drain 2 and 6 in Lillebæk. "Gray" pesticides are not monitored.
Tabel 6.1 Pesticid udbragt på markerne til dræn 2 og 6 i Lillebæk. "Grå" pesticider har ikke været moniteret.
| Drain | 6 | 2 | ||
| Field | 404 | 403 | 404.1 | 1803 |
| Year | ||||
| 1998 | Desmedipham Esfenvalerat Ethofumesat Metamitron Phenmedipham Pirimicarb |
Bromoxynil Ioxynil Fenpropimorph Propiconazol |
Bromoxynil Ioxynil Isoproturon Fluroxypyr Fenpropimorph Propiconazol Azoxystrobin |
Esfenvalerat Haloxyfob-ethoxyat |
| 1999 | Bentazon Fenpropimorph Pendimethalin Propiconazol |
Esfenvalerat Fenpropimorph MCPA-mixture Propiconazol |
Azoxystrobin Fluroxypyr Glyphosat Metsulfuron-methyl Pirimicarb Tebuconazole |
Bromoxynil Chlopyralid Fenpropimorph Floroxypyr Ioxynil Propiconazol |
| 2000 | - | Chlopyralid MCPA Mechlorprop |
Bentazon Pirimicarb |
Diflufenican Esfenvalerat Isoproturon Tebuconazole |
Table 6.2 Detection of sprayed pesticides on drain 6 in the Lillebæk catchment.
Tabel 6.2 Fund af udbragte pesticider på dræn 6 i Lillebæk-oplandet.
| Dræn 6 | Positive obs. | Conc, ng/l | 1999 | 2000 |
| Bromoxynil | 1 | 1 | 17/2 | |
| Ioxynil | 0 | |||
| Ethofumesat | 0 | |||
| Fenpropimorph | ||||
| Bentazon | 5+11 | 1; 76; 3; 3; 3 3;3;2;2;1;1;3; 2;2;2;1 |
3/3,20/8, 9/10,9/10, 10/10 |
17/2, 17/2, 18/2, 18/2, 21/2, 27/3, 10/4, 24/4, 25/4, 25/4, 25/4; |
| Isoproturon | 4+8 | 61; 5; 1; 1; 90; 79; 49; 3;3; 66; 30; 171 |
3/3, 9/10, 9/10, 10/10 |
17/2, 18/2, 18/2, 27/3, 24/4, 25/4, 25/4, 4/12; |
| Metamitron | 0 | |||
| Propiconazol | 1 | 2 | 20/8 | |
| Pirimicarb | 0 | |||
| Phenmedipham | 0 | |||
| Pendimethalin | 3 | 7; 4; 26 | 9/10, 9/10, 12/12 | |
| MCPA | 0 | |||
| Mechlorprop | 1 | 3 | 9/10 | |
| Metsulfuron-methyl | 0 |
First spraying of Bentazon on drain 6 is 6/5, 1999, the second is 30/4, 2000. The measurement on 3/3, 1999 thus cannot be explained by the sprayings in 1999 or 2000.
Isoproturon has only been used on the area in 1998, on 20/10, 1997. The detection in December 2000 cannot be explained by any registered sprayings on the drain.
Propiconazol is sprayed on 15/6, 1998, and 14.6, 1999, but is only found in the autumn of 1999. Pendimethalin is sprayed on 6/5, 1999 and is found in the following autumn.
Mechlorprop is applied on 29/4, 2000, and the detection on 9/10, 1999 therefore cannot be explained by the registered application.
It is worth noting that in spite of the fact that the area has macropores, the detections are not necessarily closely tied to the time of application.
Table 6.3 Detections of sprayed pesticide on drain 2 in Lillebæk catchment.
Tabel 6.3 Fund af udbragte pesticider på dræn 2 i Lillebæk-oplandet.
| Dræn 2 | Fund | Conc, ng/l | 1999 | 2000 |
| Bromoxynil | 1 | 1 | 23/4 | |
| Ioxynil | 1+1 | 1; 3 | 20/8 | 23/4 |
| Fenpropimorph | 0 | |||
| Isoproturon | 4+14 | 3; 5; 2; 5 74; 63; 1; 107; 78; 122; 4; 6; 3; 3; 3; 23000;1300;180 |
20/8, 24/8, 10/10, 15/11 |
2/2, 9/2, 17/2, 18/2, 18/2, 18/2, 3/3, 23/4, 8/5, 22/5, 6/6, 7/11, 20/11, 15/12 |
| Propiconazol | 4 | 4; 1; 1; 1 | 20/8, 24/8, 10/10, 15/11 |
Bromoxynil is applied on drain 2 on 7/9, 1999 and Ioxynil on 7/9, 1998 and 11/5, 1999. Fenpropimorph and Propiconazol are both applied 11/5, 1999. Isoproturon is applied on the drain on 6/10, 2000. The fact that it is found so often on the field before this date must be due to water entering the drain system from somewhere outside the field.
It is worth noting that a number of compounds are found in the drains in significant concentrations, but they are not recorded as applied in the monitoring period. Both Atrazin and two of its metabolites are found in drain 6 and must be a result of the fact that the field has been used for maize earlier. Hydroxyatrazin is found in 1999 in concentrations up to 224 ng/l. Terbutylazin and its metabolites are also found both years.
In drain 2, Hydroxy-carbofuran is found in concentrations of 1.6 μg/l on 30/9, 1999 and 1.1 μg/l on 1/10, 1999 without a known source. P-nitrophenol is found in both drains in concentrations up to 0.125 μg/l, again without a local source.
6.3.1 Pesticide simulations in drain areas in Lillebæk
Based on the analysis of pesticide applications and detections on drain 2 and drain 6 in Lillebæk in Section 6.3, only two combinations of pesticide and drain were found relevant:
bentazon on drain 6 and isoproturon on drain 2. Some data on the two are given in Table 6.4.
Table 6.4 Data on pesticide simulations in two drained areas in the Lillebæk catchment
Tabel 6.4 Data vedr. pesticidsimuleringer i to drænoplande I Lillebæk-oplandet.
| Drain2 | Drain6 | |
| Pesticide simulated | Isoproturon | Bentazon |
| Area | 4 ha | 2.5 ha |
| Number of grids simulated | 16 | 10 |
| Fields treated | 1803.0 on 6/10-2000 | 404.0 on 6/5-1999 404.1 on 30/4-2000 |
The results of the simulations are shown in Figure 6.4. It is seen that the drain flow is very well simulated. It should be remembered here that the drain flow results have been extracted from the hydraulic model without further fine-tuning to the smaller areas. The fine correspondence between observed and simulated flows on such a small scale gives credibility to the overall water balance simulations.
With respect to the pesticide transport, the isoproturon on drain 2 is very well simulated (Note that two plots are shown for isoproturon that have different scales on the pesticide concentration axis to the right). During most of the simulation period, the concentration is low. The peakiness of the occurrences are well described, and it should be noted that the distribution of rain intensities stem from a rainfall station away from Lillebæk. Total correspondence cannot be expected. Very high concentrations are measured and simulated at the end of 2000 (23 μg/l (obs.), 12.8 μg/l (sim)). In this case, it appears that the timing of the drain activation is correct, which was found to be a general problem for simulations of transport to the stream.
Bentazon leaching on drain 6 is somewhat over-simulated. A reason for this could that the soil types on drain 6 is not representative of the real soil types. Since the soil types, except for the lower part of the catchment, have been distributed randomly over calculation cells of the catchment, an error can be associated with the distribution of the soil types. On this particular soil sand occurs in the bottom of the column, and any macropore flow would end here and not be transported to groundwater. The exaggerated macropores caused by the present description of colloid transport may thus also influence the result.
Figure 6.4 Simulated and observed flow and isoproturon concentration in drain area 2 and bentazon concentration in drain area 6 in the Lillebæk catchment. Note the scale difference on the first two parts of the figure.
Figur 6.4 Simuleret og observeret afstrømning og isoproturonkoncentration i drænopland 2 og bentazonkoncentration i drænopland 6 i Lillebæk. Bemærk skalaforskellen på de første to delfigurer.
6.4 Uncertainty on the results caused by uncertainty on Koc and DT50
In order to evaluate the uncertainty caused by parameter values, it was decided to create runs that would represent the 95% boundary of leaching from the root zone. It is assumed that Koc and DT50 are independent within the range of the available data sets. In some cases, the data sets have been changed compared to the runs presented in . Data from the PATE-database have been supplemented with data from Lindhardt et al. (1997), and if more estimates of DT50 were made on the same soil, these were averaged before the information was used.
First, it was assumed that Koc and DT50 follow a log-normal distribution. The measured values were used to fit the ln(mean) and the corresponding standard deviation. For Koc for Bentazon and Isoproturon, values were available from Lindhardt et al. (1997) and the values were estimated both on the basis of the values from the PATE database alone and with the extra values. For the DT50-value for Isoproturon, the values in the database are based on two soils only, and the data from Lindhardt et al. (1997) contained information from one additional soil. The derived information is shown in Table 6.6.
Secondly, the mean and the standard deviation were used to create the distribution and it was assumed that the log transformed data are normally distributed. However, due to the fact that the number of observations is low, a t-distribution is used rather than a normal-distribution. This takes into account that the estimates of the standard deviation and the mean is associated with error due to a limited number of observations.
To create approximately a 95%-fractile, Koc and DT 50 values representing a 22.5 and 77.5 percentile are extracted. It is obvious that most leaching will occur when DT50 is high and Koc is low. Assuming that the two values are independent, two extremes combined will produce approximately a 95% fractile (0.2252 = 0.05).
The selected worst case/best case parameter combinations are shown in Table 6.5.
Table 6.5 Worst case/best case combinations of Koc and DT50 for the four pesticides simulated in the two catchments.
Tabel 6.5 Værste og bedste kombination af Koc og DT50 for de fire pesticider simuleret i de to oplande.
| Compound | Worst case | Best case | ||
| Koc | DT50 | Koc | DT50 | |
| Bentazon | 8.67 | 34.6 | 26.0 | 15.3 |
| Isoproturon | 72.8 | 12.1 | 159 | 7.26 |
| Terbutylazin | 191 | 106 | 303 | 54.8 |
| Pendimethalin | 13767 | 72.85 | 17431 | 59.55 |
Table 6.6 Mean, standard deviation and fractile values derived for four pesticides. If values were available from the PATE-database and from other sources (in the case of Bentazon and isoproturon), values have been calculated both for the PATE-values alone and for the combined dataset.
Tabel 6.6 Gennemsnit, standardafvigelse og fraktilværdier udledt for de fire pesticider. Hvis værdier fandtes i PATE-databasen og fra andre kilder (i tilfældet bentazon og isoproturon, er værdierne beregnet både for PATE-værdierne alene og for det kombinerede datasæt.
The results of the simulated best and worst cases are shown in Figure 6.5 and Figure 6.6 for Odder Bæk and Lillebæk, respectively. In the case of isoproturon in Odder Bæk. both stream and main drain yield concentrations and a total load, which are smaller than observed. Hence, the Koc and DT50 values had to be fine-tuned as described in to obtain results that were even more extreme than the worst case-scenario. In the case of Pendimethalin in Odder Bæk. even the worst case scenario did not generate leaching to the stream and hence no results are shown.
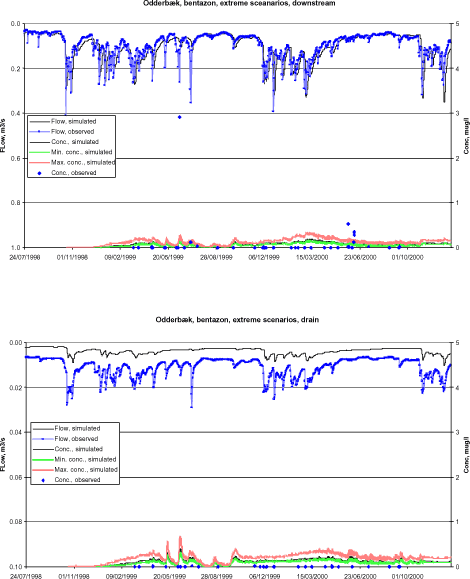
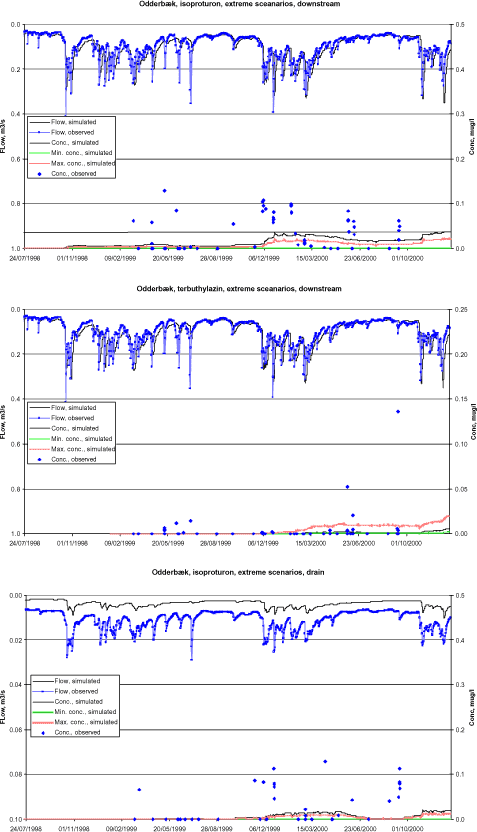
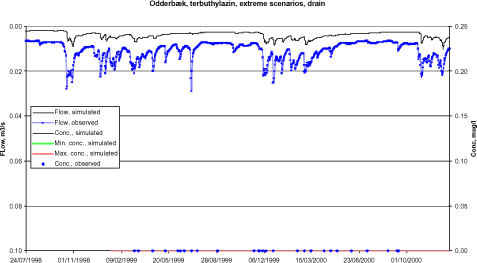
Figure 6.5 Simulated best and worst scenarios for the Odder bæk catchment for bentazon. isoproturon. and Terbutylazin. Observed concentrations in the stream and main drain are also shown.
Figur 6.5 Simulerede bedste og værste scenarier for Odder bæk-oplandet for bentazon. isoproturon. og Terbutylazin. Observerede koncentrationer i vandløbet og hoveddrænet er også vist.
For Bentazon in Lillebæk, the variation in parameters reduces the observed problems at the end of the simulation, but it does not remove it. The same is the case for isoproturon, which is still poorly simulated and seriously overestimated. Degradation in the groundwater zone is still required to improve the simulation. The variations given for pendimethalin hardly change the simulation. For Terbutylazin, the simulation is influenced during the winter 1999/2000 and the levels and peakiness of the simulation does change somewhat from the worst to the best case.
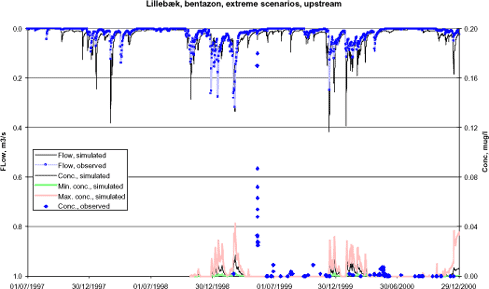
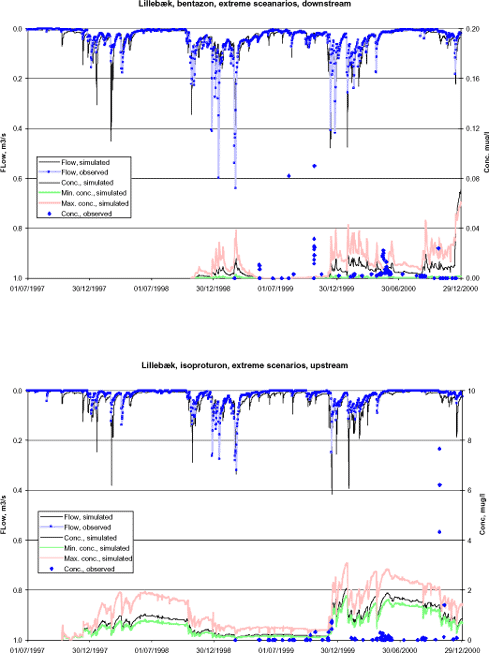
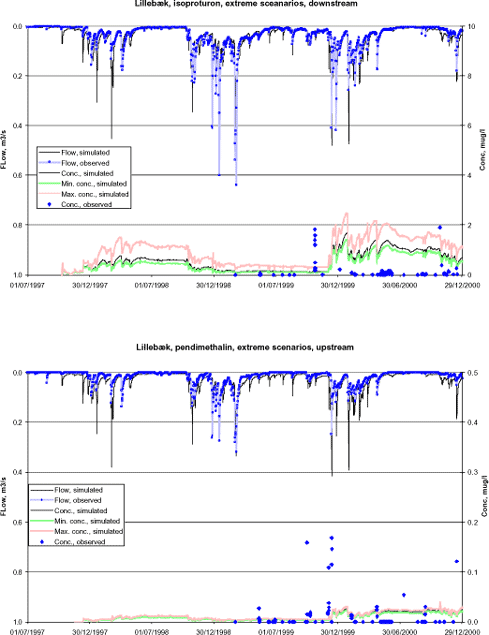
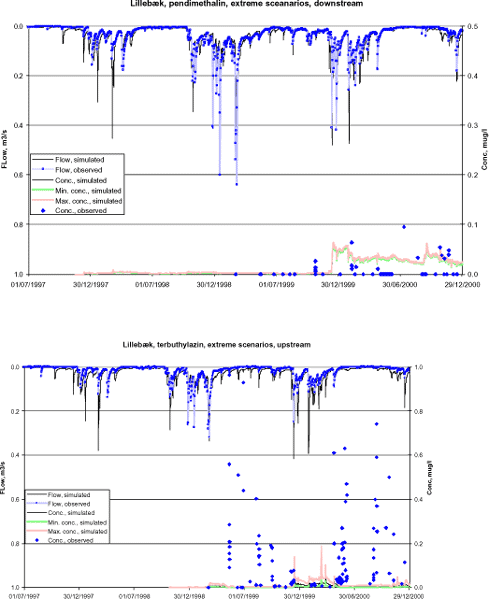
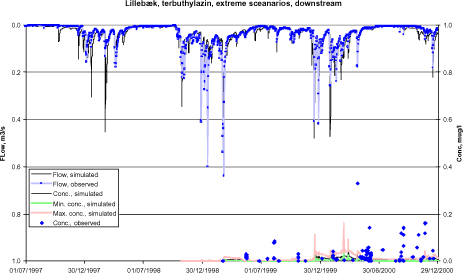
Figure 6.6 Simulated best and worst scenarios for the Lillebæk catchment for bentazon. isoproturon. pendimethalin and Terbutylazin. Observed concentrations downstream and upstream are also shown.
Figur 6.6 Simulerede bedste og værste scenarier for Odder bæk oplandet for bentazon. isoproturon. pendimethalin og Terbutylazin. Observerede koncentrationer nedstrøms og opstrøms er også vist.
Version 1.0 November 2004, © Danish Environmental Protection Agency