Calibration of Models Describing Pesticide Fate and Transport in Lillebæk and Odder Bæk Catchment
5 Calibration of Artificial Ponds
- 5.1 Calibration and validation
- 5.2 Process considered in the calibration
- 5.3 Calibration results
- 5.4 Verification of pesticide model for artificial ponds
- 5.5 Conclusion on the calibration and verification
5.1 Calibration and validation
A number of fate experiments with artificial ponds were conducted (Helweg et al., 2003). For details of the experimental procedures see Helweg et al., (2003). In brief the pesticides were applied as a single initial spraying event, where after the concentrations in the water column were measured for a period of up to 3 months. In addition a few measurements of the concentrations in the sediment were conducted.
For the compounds of Pendimethalin, Ioxynil and Bentazon biodegradation and sorption experiments were conducted by Helweg et al., (2003). Some of the experiments of Helweg et al., (2003) were conducted by sediment collected from the artificial ponds and the experiments might therefore be considered as dedicated experiments. It was therefore decided to conduct the calibration of the pond model on the basis of the artificial pond experiments with Ioxynil, Pendimethalin and Bentazon. Pond experiments with Glyphosate and Fenpropimorph was left for validation. Furthermore it was decided to use the experiments in ponds without macrophytes for validation, since these ponds was considered as different systems. Finally it was decided to use Ioxynil for validation purposes for reasons discussed below. An overview of the conducted experiments and the use of them is shown in Table 5.1.
Table 5.1 Overview of the experiments with artificial ponds used for calibration and verification of the pond model.
Tabel 5.1 Oversigt over eksperimenter udført med de kunstige vandhuller, anvendt til kaliberering og validering af vandhulsmodellen.
| Date for spraying | Compound | Init. conc. [μg/l] |
Used for | Remark |
| 9/6/1999 | Ioxynil | 1.4 | Verification | |
| 9/6/1999 | Bentazon | 1.49 | Calibration | |
| 7/9/1999 | Pendimethalin | 1.48 | Calibration | |
| 7/9/1999 | Fenpropimorph | 1.48 | Verification | |
| 9/5/2000 | Glyphosate | 9.64 | Verification | |
| 5/9/2000 | Pendimethalin | 2.15 | Calibration | |
| 5/9/2000 | Fenpropimorph | 2.15 | Verification | |
| 5/9/2000 | Pendimethalin | 2.15 | Verification | Macrophyte removed |
| 5/9/2000 | Fenpropimorph | 2.15 | Verification | Macrophyte removed |
5.2 Process considered in the calibration
To run the pond model more than 20 input parameters need to be specified. However, many of these are either solely defined by the physical and chemical properties of the pesticide (e.g. pKa or Henrys constant) or measured with high precision (e.g. water temperature and pH), making a consideration of such parameters irrelevant in connection with the calibration. Hence the calibration will focus of a few selected process or parameters, which not are readily determined by the available data. An overview of the process selected for the calibration is provided below.
5.2.1 Calibration of biodegradation in the sediment
An approach for calculation of biodegradation rates for the sediment compartment of the model on the basis of standardised laboratory test of biodegradation, which takes the high concentrations of particles in the sediment in to account, was developed by Helweg et al., (2003). Hence the approach takes in to account that particles on the one hand might decrease the bioavailability of the pesticides through sorption and on the other hand offers a significant substrate for bacteria.
In brief the approach rely on estimations of the number of active biodegrading bacteria per mass of sediment particles and the concentration of free living (pelagic) bacteria. Assuming that the number of bacteria per particle and the concentration off free living bacteria are constant the biodegradation of pesticides in the pore water can be calculated from a linear extrapolation of the biodegradation rates measured in the laboratory test to the sediment compartment of the models. However, the laboratory tests are conducted at particle concentrations in the order of 1000 gm-3, which is much lower than the particle concentrations of sediments. Hence the extrapolation involves a critical extrapolation from low to high concentrations of particles. For instance, the oxygen concentrations in the sediment might locally and temporary be much lower than the oxygen concentrations of the laboratory experiment, which might violate the assumption of linearity between the particle concentrations and the activity of the bacteria. In addition, the area of the sediment particles, which are in contact with the pore water, is lower in the sediment than in the shaking bottle experiment conducted by Helweg et al., (2003). A verification and possible adjustment of the approach of Helweg et al., (2003) is therefore an important task of the calibration of the model.
5.2.2 Calibration of the sorption to macrophytes
No data for the description of the sorption of the selected pesticides to macrophytes are available. The calibration of the sorption to macrophytes therefore has to be based on theoretical considerations. These theoretical considerations appear from Appendix C. In brief the considerations revealed that the uptake rate of pesticides through the surface (cuticle) and into the lumen of the leaves was in the order of 10-3 to 10-4 hour-1. Based on these fairly low rates it was thus decided to omit the uptake of pesticides in to the leaf from the description of the sorption of pesticides to macrophytes. Hence the sorption of pesticide to the macrophytes was assumed given by the sorption to the biofilm at the surface of the macrophytes. An important task of the calibration is thus to determine the concentration of algae and bacteria of the biofilm attacked to the surface of macrophytes.
Beforehand it was decided to investigate the performance of the model in the interval of 2.5 g-biofilm m-3 to 20 g-biofilm m-3. The lower value corresponding to an area cover of macrophytes of 25% percent and a concentration of microalgae of appr. 100 mg-chlorophyll Α m-2,which is a typical value for the concentration of benthic algae in Danish streams in the early spring, when the concentration of algae still is rather small (Sand-Jensen and Lindegaard 1996). The high value of 20 g-biofilm m-3 corresponds to, for instance, a macrophyte cover of 40% and a concentration of microalgae of appr. 400 mg-chlorophyll Α m-2, which is a typical value for the concentration of benthic algae in Danish streams in the summer, when the concentration of algae reach a maximum (Sand-Jensen and Lindegaard 1996).
5.2.3 Calibration of the photolysis
The coverage of macrophytes is important for the extent of the photolysis, since light is absorbed in the leaves of the macrophytes. A task for the calibration is therefore to determine the percentage area of the pond covered by macrophyte leaves absorbing the incoming light and thereby affecting the photolysis. It was decided to investigate the performance of the model in the interval of macrophyte coverage of 10 to 50% assuming that all the incoming light are absorbed in the macrophyte leaves.
Besides the absorption of light in the leaves of macrophytes a significant absorption might also take place in the water column itself, due to the presence of suspended and dissolved matter. Another task of the calibrations was thus to determine the light attenuation coefficient of the water column. For that purpose the performance of the model for attenuation coefficients in the interval of 0.5 to 2.5 m-1 was examined. An attenuation coefficient of 0.5 m-1 (base 10) corresponds to a secci depth of 8 m if it is assumed that:
- 10 percent of the incoming photosynthetic active (PAR) light remains at the secci depth,
- light attenuation at wavelengths of 300 nm is 4 times higher than the light attenuation in the photosynthetic active range (400 to 700 nm).
The later assumption is supported by adapted from Smith and Baker (1979). An attenuation coefficient of 2.5 m-1 corresponds to a secci depth of 1.6 m. Light attenuation at wavelengths of 300 nm is considered most relevant since the investigated pesticides have absorption maxima in this range.
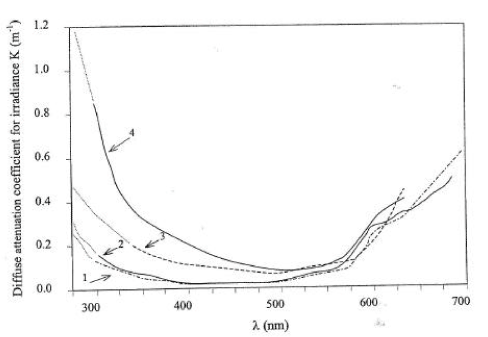
Figure 5.1 Diffuse attenuation coefficients as a function of wave length for different types of water bodies. Adapted from Garde 1998.
Figur 5.1 Diffuse lysudslukningskoefficient som funktion af bølgelængden for forskellige typer vand. Efter Garde 1998.
5.2.4 Calibration of the effective diffusion coefficient
An earlier model based study of the fate of Pyrethroids pesticides in the same artificial ponds as used in the present study revealed that diffusion and a subsequent sorption to sediment particles was among the most important process for the fate of hydrophobic pesticides (Mogensen et al., 2004). Furthermore, it was found that the apparent or effective diffusion coefficient was much higher than the molecular diffusion coefficient. One reason for this might be that the surface of the sediment is crude, which makes the effective area for diffusion much larger (see Mogensen et al., 2004 for further details).
An alternative or supplementary explanation of the high effective diffusion coefficients might be a local high concentration of organic matter in the upper part (< 1mm) of the sediment causing a higher sorption to particles. Hence, if the sorption to particles is estimated for a sample of the upper few cm of the sediment the content of organic matter might be underestimated, which causes an underestimation of the sorption for at least for hydrophobic pesticides with a high affinity for organic matter. It must be stated that the product of the sorption (retention) and the diffusion determine the overall sediment uptake caused by diffusion and subsequent sorption. An underestimated sorption might thus be compensated by a higher effective diffusion coefficient.
An effective diffusion coefficient for the artificial ponds of 1.3x10⁻⁴ m2h-1 was determined by Mogensen et al., (2004) using inverse modelling. However, this value seems to be specific for the experiments examined by Mogensen et al., (2004), since major differences in the disappearance rates for Fenpropimorph and Pendimethalin have been observed for the years of 1999 and 2000 (Helweg et al., 2003). The reasons for the different disappearance rates are discussed by Helweg et al., (2003) and might, among other things, involve differences in the extent of sorption of the pesticides to dissolved organic matter in the water column. Another or supplementary explanation might be differences in the extent of vertical mixing of the water column. However, data for a quantitative description of these phenomena are not available and descriptions of these phenomena where not considered when equations of the present model was described. As a consequence it is not possible to include the effect of dissolved organic matter and vertical mixing in the model. Consequently it was decided to determine an effective diffusion coefficient causing the best average fit of the artificial pond experiments conducted in 1999 and 2000 (Helweg et al., 2003).
As basis for this it was decided to examine the performance of the model when the diffusion coefficients was set to 1.5 x10⁻⁵, 5x10⁻⁵, 1.3x10⁻⁴ (the value of Mogensen et al., 2004), 5x10⁻⁴ and 1.5x10⁻³ m2h-1.
5.2.5 The quantitative importance of the different process
When calibrating a model one needs to consider that the importance of the different process is highly dependent on the physical and chemical properties of the pesticides. A framework for quantification of the relative importance of the different process for the outcome of the pond model on the basis of the physical and chemical properties are provided by the decisions trees in chapter 8 in Styczen et al., (2004b). To focus the calibration effort on the most relevant process, this framework was therefore applied to the pesticides selected for the calibration. The physical, chemical and biological properties of the pesticides appear from Table 5.2, whereas the results of the evaluation of the importance of the different process appear from Table 5.3.
The pesticide properties were extracted from PATE (the database of the EPA) and from chemical handbooks. The quality and quantity of the data for pesticides properties is thus assumed to resemble the quality of the data available for the EPA in connection with approval procedures in the future. Desorption rates were calculated from the Kd or Koc values assuming a constant sorption rate as recommended by Helweg et al., (2003). The gas and liquid exchange coefficient, used for calculation of evaporation, were estimated on the basis of Asman et al. (2003). The particle concentration in the water phase was set to 1 g m-3 and the sediment porosity was set to 0.75. The bulk dry density of the sediment was set to 0.5 kg/l. The pH of the pond was set to 7.6. The photolysis rates correspond to the rates in clear water at noon on a sunny summer day. Hence the actual degradation rate in the ponds will be lower due to attenuation of the light. For Bentazon and Ioxynil the photolysis was calculated on the basis of the quantum yield and the absorption spectra of Figure 5.2 to Figure 5.3.
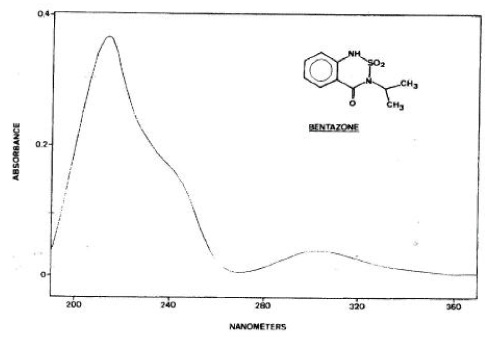
Figure 5.2 Absorption spectra for Bentazon adapted from Chiron et al. (1995).
Figur 5.2 Absorptionsspektrum for Bentazon, efter Chrion et al. (1995).
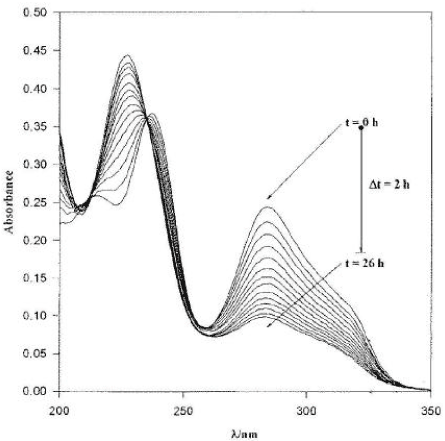
Figure 5.3 Absorption spectra of ioxynil adapted from Millet et al. (1998). The different curves reflect the degradation of ioxynil and hence decreased absorption with time.
Figur 5.3 Absorptionsspektrum for ioxynil, efter Millet et al. (1998). De forskellige kurver skyldes nedbrydningen af ioxynil og derfor nedsat absorption over tid.
In accordance with the framework for evaluation of the importance of the different process (Table 5.3), photolysis was the only process of importance for the fate of Bentazon, whereas photolysis and diffusion in to the sediment were of importance for ioxynil. It was therefore decided to use Bentazon for calibration of the photolysis and to leave ioxynil for validation.
Table 5.2 Pesticides properties used for the calibration. The values in brackets indicate the final values after the calibration have been finished.
Tabel 5.2 Pesticidegenskaber anvendt i kalibreringen. Værdierne i paranteser er de endelige værdier da kalibreringen var tilendebragt.
| Property | Compound | |||||
| Ioxynil | Pendimethalin | Bentazon | ||||
| Value | Reference | Value | Reference | Value | Reference | |
| Water solubility [gm-3] w.s. | 50 | Tomlin 1994 | 0.3 | Tomlin 1994 | 570 | Tomlin 1994 |
| Desorption [h-1] particles | 2.41 | Calculated from Kd | 1.24E-02 | Calculated from Kd | 11 | Calculated from Kd |
| Kmacrophyt [m3g-1] km |
1.2e-4 | Calculated from w.s. | 3.5e-3 | Calculated from w.s. | 2.5e-5 | Calculated from w.s. |
| Desorption [h-1] macrophytes | 2.3 | Calculated from Km | 8.3E-02 | Calculated from Km | 11 | Calculated from Km |
| Kd [m3g-1] | 2.83e-5 | Helweg et al., 2003 | 7E-4 | Helweg et al., 2003 | 3.3e-6 | Helweg et al., 2003 |
| Koc [m3g-1] | 3.6e-4 | Helweg et al., 2003 | 0.021 | Helweg et al., 2003 | 13 | Helweg et al., 2003 |
| Alk. Hydrolyse [h-1mol [H+] –1] | 0 | EPA data base | 0 | EPA data base | 0 | EPA data base |
| Acid Alk. Hydrolyse [h-1mol [OH-] –1] | 0 | EPA data base | 0 | EPA data base | 0 | EPA data base |
| Neutral Hydrolysis [h-1] | 0 | EPA data base | 0 | EPA data base | 0 | EPA data base |
| Pka | 3.96 | Danish EPA | 2.8 | Danish EPA | 3.3 | Pesticide Handbook |
| Bio_deg_water column [h-1] | 1.85e-5 | Helweg et al., 2003 | 0.015 | Helweg et al., 2003 | 0 | Helweg et al., 2003 |
| Bio_deg_pore_water [h-1] | 8.3e-2 (7e-4) |
Helweg et al., 2003 | 28 (0.4) |
Helweg et al., 2003 | 0 (0) |
Helweg et al., 2003 |
| Gas_exchange [mh-1] | 45 | Asman et al. 2003 | 45 | Asman et al. 2003 | 45 | Asman et al. 2003 |
| Liquid_exchange [mh-1] | 0.029 | Asman et al. 2003 | 0.029 | Asman et al. 2003 | 0.029 | Asman et al. 2003 |
| Henrys constant (-) | 2.25e-8 | EPA data base | 1.10E-09 | EPA data base | 2.91e-14 | EPA data base |
| Quantum Yield | 2.4e-3 | Chiron et al., 1995 | ---- | ------- | 1.7e-5 | Calculated from Millet et al., 1998 |
| Photolysis rate [h-1] | 0.3 | Chiron et al., 1995 | 1e-3 | Sanders, P. 1985 in EPA data base | 2.6e-1 | Millet et al., 1998 |
| Retention in sediment | 15 | Calculated from Kd | 350 | Calculated from Kd | 2.4 | Calculated from Kd |
Table 5.3 The most important process for the calibration of the pond model for ioxynil, Bentazon and pendimethalin. The process was selected on the basis of the pesticides properties of Table 5.2 and the decision trees of chapter 8 in Styczen et al., (2003).
Tabel 5.3 De vigtigste processer i kalibreringen af vandhulsmodellen for ioxynil, Bentazon og pendimethalin. Processerne er udvalgt på basis af pesticidegenskaberne i Tabel 5.2 og beslutningsstøttetræet i kapitel 8 i Styczen et al.,. (2004b).
| Pesticide | Selected process |
| Pendimethalin | Effective diffusion in to sediment Degradation in sediment |
| Ioxynil | Photolytic degradation Effective diffusion in to sediment |
| Bentazon | Photolytic degradation |
5.3 Calibration results
5.3.1 Pendimethalin
When the values for Pendimethalin of Table 5.2 were used as input parameters the results of Figure 5.4 was obtained.
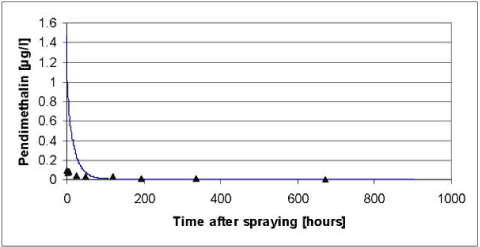
Figure 5.4 Simulated versus measured total concentration in the water column of pendimethalin for the artificial pond experiments of year 1999. The simulation was based on the data of Table 5.2 before modifications of the biodegradation and the diffusion in to the sediment as discussed in the text.
Figur 5.4 Observeret og simuleret totalkoncentration af pendimethalin i vandsøjlen for det kunstige vandhulseksperiment i 1999. Simuleringen er baseret på data fra tabel 5.2 før modifikation af bionedbrydningen og diffusion ind i sedimentet som diskuteret i teksten.
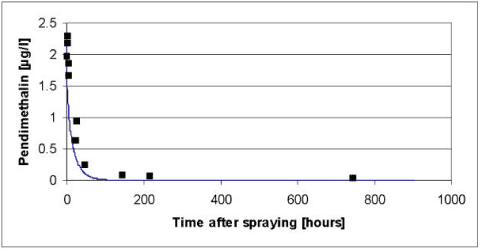
Figure 5.5 Simulated versus measured total concentration in the water column of pendimethalin for the artificial pond experiments of year 2000. The simulation was based on the data of Table 5.2 before modifications of the biodegradation and the diffusion in to the sediment as discussed in the text.
Figur 5.5 Observeret og simuleret totalkoncentration af pendimethalin i vandsøjlen for det kunstige vandhulseksperiment i 2000. Simuleringen er baseret på data fra tabel 5.2 før modifikation af bionedbrydningen og diffusion ind i sedimentet som diskuteret i teksten.
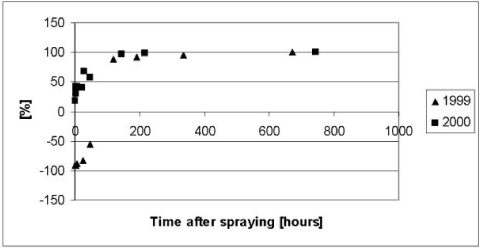
Figure 5.6 Residuals or relative difference between the simulated and measured total concentrations of pendimethalin in the water column of the experiments with artificial ponds in year 1999 and 2000. The simulations were based on the data of Table 5.2 prior to modifications discussed in the test.
Figur 5.6 Residualer eller relativ forskel mellem observeret og simuleret totalkoncentration af pendimethalin i vandsøjlen for det kunstige vandhulseksperiment i 1999 og 2000. Simuleringen er baseret på data fra tabel 5.2 før modifikationer som diskuteret i teksten.
As it appears from Figure 5.4 to Figure 5.6, the model severely underestimated the concentrations of pendimethalin in the water column after 100 hours both in year 1999 and 2000. In addition the concentrations before 100 hours were overestimated in year 1999. The underestimation after 100 hours was interpreted as an overestimation of a first order degradation rate whereas the overestimation before 100 hours in 1999 was interpreted as an underestimation of the effective diffusion coefficient.
According to Table 5.2 the most significant degradation takes place in the sediment and the procedure for extrapolation of biodegradation rates of Helveg et al., (2003) therefore seems to overestimate the biodegradation in the sediment. In an attempt to obtain a more appropriate fit of the model it was therefore decided to reduce the biodegradation in the sediment and to adjust the extrapolation procedure of Helveg et al., (2003) accordingly before the extrapolation procedure is implemented in the registration model (Styczen et al., 2004). In addition, it was decided to increase the effective diffusion coefficient of the sediment to avoid the severe overestimation in the first 100 hours after the spraying of pesticide in year 1999. After adjustments of the diffusion coefficient to 1.5 x 10⁻³ m2h-1 and the degradation rate in the sediment to 0.4 h-1 the results of Figure 5.7 to Figure 5.9 was obtained. The adjustments were found through successive changes of the degradation rate and the diffusion coefficient, which was halved or doubled, for each step. To implement the lower degradation rate in the registration model the parameters use for extrapolation of biodegradation data to field condition needs to be changed as shown in Table 5.4.
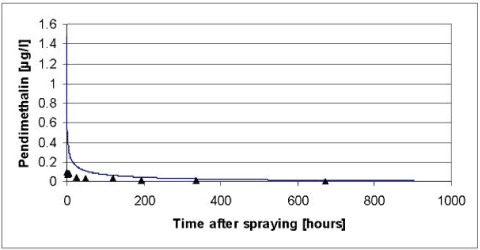
Figure 5.7 Simulated versus measured total concentration in the water column of pendimethalin for the artificial pond experiments of year 1999. The simulation was based on the data of Table 5.2 after modifications of the biodegradation and the diffusion in to the sediment discussed in the text.
Figur 5.7 Observeret og simuleret totalkoncentration af pedimethalin i vandsøjlen for det kunstige vandhulseksperiment i 1999. Simuleringen er baseret på data fra tabel 5.2 efter modifikation af bionedbrydningen og diffusion ind i sedimentet som diskuteret i teksten.
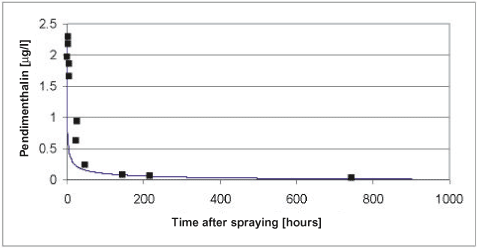
Figure 5.8 Simulated versus measured total concentration in the water column of pendimethalin for the artificial pond experiments of year 2000. The simulation was based on the data of Table 5.2 after modifications of the biodegradation and the diffusion in to the sediment discussed in the text.
Figur 5.8 Observeret og simuleret totalkoncentration af pendimethalin i vandsøjlen for det kunstige vandhulseksperiment i 2000. Simuleringen er baseret på data fra tabel 5.2 efter modifikation af bionedbrydningen og diffusion ind i sedimentet som diskuteret i teksten.
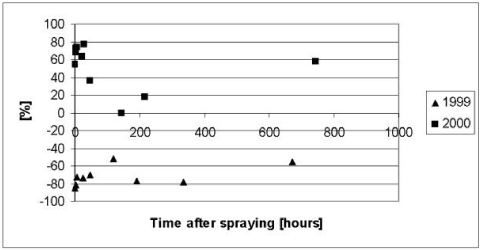
Figure 5.9 Residuals or relative difference between the simulated and measured total concentrations of pendimethalin in the water column of the experiments with artificial ponds in year 1999 and 2000. The simulation was based on the data of Table 5.2 after modifications of the biodegradation and the diffusion in to the sediment discussed in the text.
Figur 5.9 Residualer eller relative forskelle mellem den observerede og simulerede totalkoncentration af pendimethalin i vandsøjlen for det kunstige vandhulseksperiment i 1999 og 2000. Simuleringen er baseret på data fra Tabel 5.2 efter modifikation af bionedbrydningen og diffusion ind i sedimentet som diskuteret i teksten.
Table 5.4 Original K1 and K2 values of the procedure for extrapolation of biodegradation data to field condition proposed by Helweg et al., (2003) and the data suggested after calibration of the model for pendimetahlin against data from the experiments with artificial ponds.
Tabel 5.4 Originale K1 og K2-værdier fra poceduren for extrapolation af biodegraderingsdata til markforhold, foreslået af Helweg et al., (2000) og data foreslået efter kalibrering af modellen for pendimethalin mod data fra eksperimentet med kunstige vandhuller.
| K1 | K2 | |
| Original value of Helweg et al., (2003) | 1.85e-5 | 0.25 |
| Value after calibration | 1.85e-5 | 2e-3 |
5.3.2 Bentazon
According to Table 5.3 the disappearance of Bentazon from the water column is only dependent on the photolytic decay, which in turn is dependent on the macrophyte cover, shading from trees and structures around the ponds and on the attenuation of light in the water column. Following an examination of different combinations of shading and light attenuation in the water column a light attenuation coefficient of 2.5 (base 10) and a macrophyte cover of 50% was selected. We are aware of that the model systematically overestimates the Bentazon concentrations in the period from 72 to 1300 hours after the spraying. However it was not possible to avoid this, without causing a severe underestimation of the concentrations at the very end of the experimental period. A possible explanation of this limitation of the model might be that Bentazon not is distributed equally in the water column through the entire experiment but tend to concentrate in the upper layer immediately after the spraying due to a limited mixing of the water column (Helweg et al., 2003). Enhanced concentration of Bentazon in the upper layer of the water column is not taken in to account by the model, which assume that the water column is well mixed. This assumption might cause an overestimation of the light attenuation in the water column and consequently an underestimation of the photolytic decay of Bentazon.
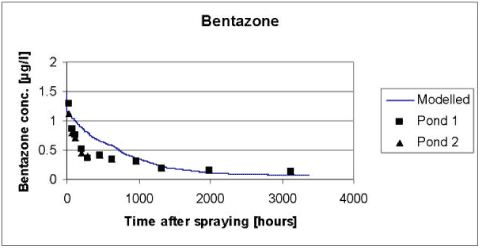
Figure 5.10 Simulated versus measured total concentration in the water column of Bentazon for the artificial pond experiments of year 2000. The simulation was based on the data of Table 5.2 and the calibration of light attenuation and macrophyte cover discussed in the text.
Figur 5.10 Observeret og simuleret totalkoncentration af bentazon i vandsøjlen for det kunstige vandhulseksperiment i 2000. Simuleringen er baseret på data fra Tabel 5.2 og kalibreringen af lystilbageholdelse og makrofytdække diskuteret i teksten.
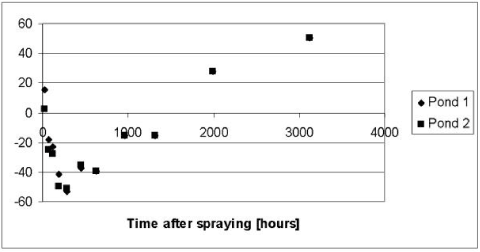
Figure 5.11 Residuals or relative difference between the simulated and measured total concentrations of Bentazon in the water column of the experiments with artificial ponds in year 1999 and 2000. The simulation was based on the data of Table 5.2 and the calibration of light attenuation and macrophyte cover discussed in the text.
Figur 5.11 Residualer eller relativ forskel mellem simuleret og målt totalkoncentration af bentazon i vandsøjlen i experimentet med kunstige vandhuller i 1999 og 2000. Simuleringen er baseret på data fra Tabel 5.2 og kalibreringen af lystilbageholdelse og makrofytdække diskuteret i teksten.
5.4 Verification of pesticide model for artificial ponds
As described in section 5.1.1 the pesticides of Glyphosate, Ioxynil and Fenpropimorph were selected for verification of the pond model. In addition, the pond experiment with pendimethalin, where the macrophytes were removed, was used for verification. The data used for verification appears from Table 5.5. As a part of the verification the uncertainty of the input parameters were taking in to account with the aid of a so called intelligent Monte Carlo analysis, which is described by Styczen et al., 2004b. On the basis of the intelligent Monte Carlo analysis was it possible to calculate 95% confidence intervals for the output of the model.
Table 5.5 Pesticide data used for the verification of the pond models. In addition, the data for ioxynil of Table 5.2 was used for verification.
Tabel 5.5 Pesticiddata brugt til verifikation af vandhulsmodellerne. Desuden blev data for ioxynil fra tabel 5.2. brugt til verifikation.
| Process | Pesticide | |||||
| Glyphosate | Pendimethalin | Fenpropimorph | ||||
| Value | Reference | Value | Reference | Value | Reference | |
| Desorption [h-1] particles | 0.46 | Calculated | 0.07 | Calculated | 0.25 | Calculated |
| Desorption [h-1] macrophytes | 0.048 | Calculated | ---- | Calculated | 0.069 | Calculated |
| Kd [m3g-1] | 7.6e-5 | EPA data base | 0.00051 | Helweg et al., 2003 Mangles 1990* |
0.00014 | Raedeker 1979* |
| Koc [m3g-1] | n.d. | ---- | ---- | Helweg et al., 2003 | 0.042 | Raedeker 1979* |
| Alk. Hydrolyse [h-1mol [H+] –1] | 0 | EPA data base | 0 | EPA data base | 0 | EPA data base |
| Acid Alk. Hydrolyse [h-1mol [OH-] –1] | 0 | EPA data base | 0 | EPA data base | 0 | EPA data base |
| Neutral Hydrolysis [h-1] | 0 | EPA data base | 0 | EPA data base | 0 | EPA data base |
| Pka | 2.74 | EPA data base | 2.8 | EPA data base | 7.0 | EPA data base |
| Bio_deg_water column [h-1] | 1.5e-4 | EPA data base | 0.015 | Helweg et al., 2003 | 4.2e-4 | Mühll 1990* |
| Bio_deg_pore_water [h-1] | 0.0055 | EPA data base | 0.39 | Helweg et al., 2003 | 0.015 | Mühll 1990* |
| Gas_exchange [mh-1] | 45 | Asman et al. 2003 | 45 | Asman et al. 2003 | 45 | Asman et al. 2003 |
| Liquid_exchange [mh-1] | 0.029 | Asman et al. 2003 | 0.029 | Asman et al. 2003 | 0.029 | Asman et al. 2003 |
| Water solubility (mg/l) | ---- | -------- | -------- | ----------- | 3.53 | Raedeker 1988* |
| Vapour pressure | ---- | ------ | -------- | ----------- | 1.7e-5 | Raedeker 1988* |
| Mol weight | ---- | ------ | ------- | ---------- | 303 | ------ |
| Henrys constant (-) | ---- | ----- | 1.10E-03 | EPA data base | 8.0e-5 | Calculated |
| Quantum Yield | ---- | ----- | ----- | ------- | -------- | ---------- |
| Photolysis rate [h-1] | ---- | ----- | 0.001 | Sanders, P. 1985 * | 0 | EPA data base |
| Retention in sediment | 28 | EPA data base | 256 | Calculated from Kd | 70 | Calculated |
In brief the intelligent Monte Carlo consisted of a selection of the most important process for each substance and a Latin Hyper Cube sample of the input parameters for the process assuming that each input parameter follows a log normal distribution. However, to take the uncertainty of the estimates of the mean and the standard deviation of each parameter caused by the low sample size in to account the normal distribution was substituted with a t-distribution. When the Latin Hyper Cube sampling was conducted it was assumed that the correlation's between the input variables was equal to 0. This assumption might be invalid for some pesticides. However, the data do not allow an estimation of the correlation since the input variables are estimated in separate experiments/systems and the correlation can therefore not be estimated. It was therefore decided to set the correlation to 0. The process selected for each compound appears from Table 5.6. The process was selected in accordance with the decision support trees of Styczen et al 2004.
Table 5.6 The most important process for the verification of the pond model for ioxynil, fenpropimorph, glyphosate and pendimethalin. The process was selected on the basis of the pesticides properties of Table 5.5 and the decision trees of chapter 8 in Styczen et al., (2004).
Tabel 5.6 De vigtigste processer for verifikationen af vandhulsmodellen for ioxynil, fenpropimorph, glyphosate and pendimethalin. Processerne er udvalgt på basis af pesticidegenskaberne i Tabel 5.6 og beslutningsstøttetræet i kapitel 8 i Styczen et al. (2004b).
| Active substance | Selected process |
| Pendimethalin | Effective diffusion in to sediment Degradation in sediment |
| Fenpropimorph | Effective diffusion in to sediment Degradation in sediment |
| Ioxynil | Effective diffusion in to sediment Photolytic degradation |
| Glyphosate | Effective diffusion in to sediment Degradation in sediment |
5.4.1 Glyphosate
The results of the verification for glyphosate appear from Figure 5.12. The model tends to underestimate the concentrations in the water column during the first hours after the spraying of glyphosate, whereas the model tend to overestimate the concentrations at the end of the experiment. An explanation could be that the process of diffusion and sorption into the sediment is overestimated, whereas the process of degradation in the sediment is underestimated. Diffusion could be overestimated because sorption of glyphosate is caused by ionic interactions, whereas the sorption of pendimethalin, for which the effective diffusion coefficient was calibrated, is due to hydrophobic interactions. Hence the effective diffusion coefficient might not be valid for glyphosate, which penetrates in to deeper parts of the sediment than Pendimethalin, which is trapped in the upper layer of the sediment rich in organic matter.
A straightforward explanation for the underestimated biological degradation cannot be given. However, it must be emphasised that the calibration of the biodegradation was done for pesticides with other sorption properties that glyphosate. This influences the results because the model takes sorption properties in to account when the bio-degradation is calculated.
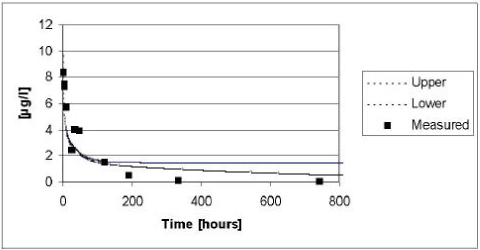
Figure 5.12 Upper and lower limit for a 95% confidence interval for the simulation of glyphosate in the ponds with macrophytes in year 1999 plotted against the measured values.
Figur 5.12 Øvre og nedre grænse for et 95% sikkerhedsinterval for simuleringerne af glyphosat i vandhullerne i år 1999 plottet overfor de målte værdier.
5.4.2 Pendimethalin
The results of the verification for pendimethalin appear from Figure 5.13.
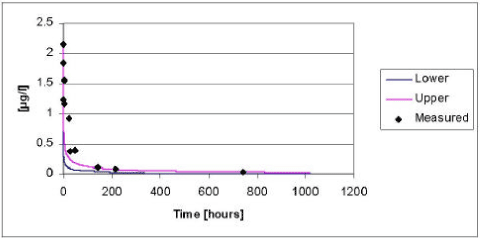
Figure 5.13 Upper and lower limit for a 95% confidence interval for the simulation of pendimethalin in the ponds without macrophytes in year 2000 plotted against the measured values.
Figur 5.13 Øvre og nedre grænse for et 95% sikkerhedsinterval for simuleringerne af pendimethalin i vandhuller uden makrofytter i år 2000, plottet overfor de målte værdier.
The model tends to underestimate the concentrations of pendimethalin. The deviations between the measured and simulated values are most pronounced in the beginning of the experiment. As discussed in section 5.2.4 the fate of pendimethalin is mainly driven by the diffusion and subsequent sorption in the sediment. Hence, the deviation can be explained by the choice of an average value for the effective diffusion coefficient.
5.4.3 Fenpropimorph
The results of the verification for fenpropimorph appear from Figure 5.14 to Figure 5.15. The model tend to overestimate the measured values in 1999, whereas the measured values tend to be underestimated in the year of 2000 irrespectively of the presence or absence of macrophytes. The deviations between the measured and simulated values are most pronounced in the beginning of the experiment. As for pendimethalin, the fate of fenpropimorph is mainly driven by the diffusion and subsequent sorption in the sediment. Hence, the deviation can be explained by the choice of an average values for the effective diffusion coefficient. However, generally the measured values lie within the 95% confidence intervals and the deviation caused by the choice of an average effective diffusion coefficient is generally balanced by the uncertainty on the input parameters.
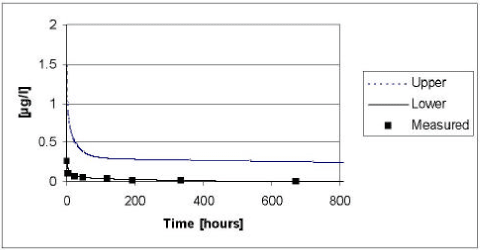
Figure 5.14 Upper and lower limit for a 95% confidence interval for the simulation of fenpropimorph in the ponds with macrophytes in year 1999 plotted against the measured values.
Figur 5.14 Øvre og nedre grænse for et 95% sikkerhedsinterval for simuleringerne af fenpropimorph i vandhullerne med makrofytter i år 1999 plottet overfor de målte værdier.
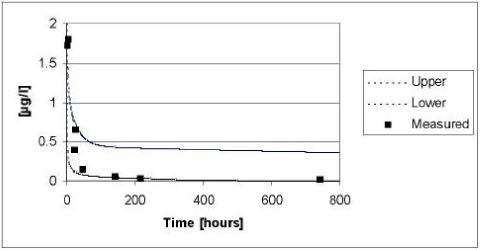
Figure 5.15 Upper and lower limit for a 95% confidence interval for the simulation of fenpropimorph in the ponds with macrophytes in year 2000 plotted against the measured values.
Figur 5.15 Øvre og nedre grænse for et 95% sikkerhedsinterval for simuleringerne af fenpropimorph i vandhullerne med makrofytter i år 2000 plottet overfor de målte værdier.
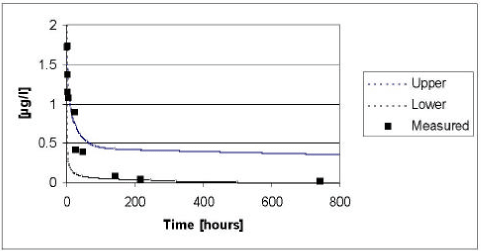
Figure 5.16 Upper and lower limit for a 95% confidence interval for the simulation of fenpropimorph in the ponds without macrophytes in year 1999 plotted against the measured values.
Figur 5.16 Øvre og nedre grænse for et 95% sikkerhedsinterval for simuleringerne af fenpropimorph i vandhullerne uden makrofytter i år 1999 plottet overfor de målte værdier
5.4.4 Ioxynil
The results of the verification for Ioxynil appear from Figure 5.17. The measured values fall almost right between the upper and lower limit of the 95% confidence interval.
5.5 Conclusion on the calibration and verification
The properties of the pesticides (Table 5.3) dictated that it only was relevant to consider the process of photolysis, biological degradation in the sediment and the diffusion and subsequent sorption in the sediment when the calibration was conducted. A calibration of the remaining process implemented in the model will require data for pesticides with other properties or a more detailed measurement programme. The verification revealed that the effective diffusion coefficient determined through the calibration exercise is not valid for glyphosate. In addition, the effective diffusion coefficient differ from year to year. This is not taken into account by the model but this effect is to certain extent balanced by the uncertainty of the input parameters.
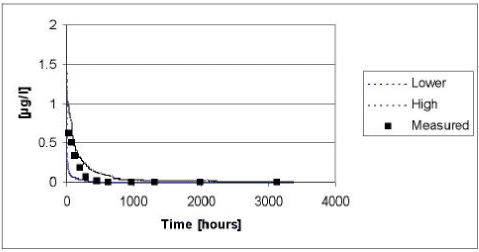
Figure 5.17 Upper and lower limit for a 95% confidence interval for the simulation of Ioxynil in the ponds with macrophytes in year 1999 plotted against the measured values.
Figur 5.17 Øvre og nedre grænse for et 95% sikkerhedsinterval for simuleringerne af ioxynil i vandhullerne med makrofytter i år 1999 plottet overfor de målte værdier.
Version 1.0 November 2004, © Danish Environmental Protection Agency