|
| Front page | | Contents | | Previous | | Next |
Fate of Pyrethroids in Farmland Ponds
6 Results and discussion, part I
6.1 Pyrethroids in pond samples
6.1.1 Isomerisation
All the pyrethroids have asymmetric carbon atoms (figure 5.3) and therefore the compounds have the possibility of a number of different stereo isomers. The insecticidal activity of the
isomers varies and in modern formulations it is often only the most active isomer that is present. This is e.g. the case with deltamethrin in Decis and esfenvalerate in Sumi-alpha.
Permethrin is a mixture of cis and trans compounds and the ratio of isomers should be stated for every product. (Worthing and Hance 1991).
The ratio of isomers in standard solutions in isooctane of the different pyrethroids is stable at laboratory conditions. However, it was observed during analysis of samples from the first
experimental year that the ratio in pond samples changed during time, but these observations were not quantified.
The second year the different isomers were quantified. Two permethrin stereo isomers are present in the standard compound and each isomer is quantified separately. In esfenvalerate
and deltamethrin standards only one stereo isomer is present. Assuming that the GC-ECD response factor is the same for different isomers of the same compound it is possible to
calculate the concentration of the various isomers by aid of the ratio of peak areas and the standard curve.
Once isooctane has been added to samples of water and SML it seems to stabilise the isomer ratio because the pyrethroids are extracted into the isooctane.
The isomerisation in the ponds is discussed below for water phase. Figures 6.1 – 6.3 demonstrate the development of the isomer ratio of permethrin, fenvalerate and deltamethrin.
Permethrin
One hour after application the ratio of cis-permethrin to trans-permethrin was about 0.70. This ratio increases during the observation time. After 5 days the ratio was about 1.5 and
after 8 days it was about 5.5. The last point of observation is more uncertain because the concentration of trans-permethrin was very low. It is not obvious from the figures if equilibrium
will be obtained.
Esfenvalerate
Esfenvalerate is (S)--cyano-3-phenoxybenzyl (S)-2-(4-chlorphenyl)-3-methylbutyrate. Fenvalerate is a mixture of (R) and (S) isomers with unstated stereochemistry. In the
gaschromatogram fenvalerate is detected as two peaks, the second peak with same retention time as esfenvalerate. In esfenvalerate there will often be small amounts of the first peak
present as well. Equilibrium was not obtained but it seems that the isomer ratio is approaching a constant value indicating that the isomerisation process is reversible.
Deltamethrin
Isomerisation of deltamethrin is very similar to the isomerisation of esfenvalerate.
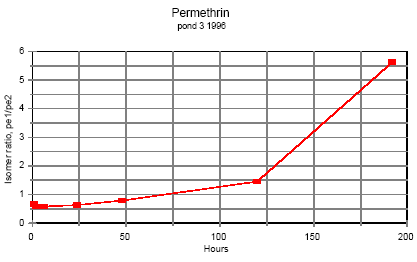
Figure 6.1
Time dependent ratio of the two permethrin isomers in pond water.
Tidsafhængig forhold mellem de to permethrin isomerer i vandhulsvand
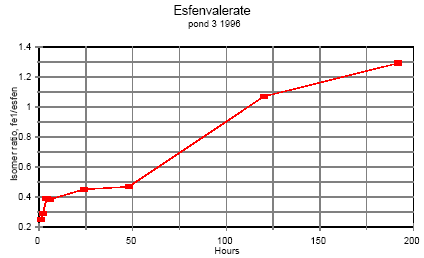
Figure 6.2
Time dependent ratio of the two fenvalerate isomers in pond water.
Tidsafhængig forhold mellem de to fenvalerat isomerer i vandhulsvand
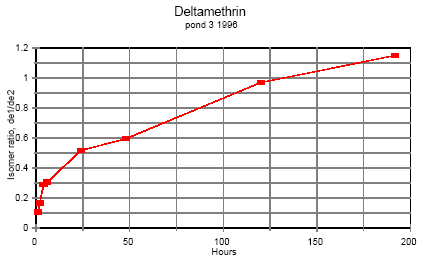
Figure 6.3
Time dependent ratio of the two deltamethrin isomers in pond water.
Tidsafhængig forhold mellem de to deltamethrin isomerer i vandhulsvand
6.1.2 Surface microlayer
At the interface between air and water is a surface microlayer (SML). The SML contains humic substances, fatty acids and alcohol's, polysaccharide-protein complexes and other
substances that exhibit surfactive properties. The concentration of bacteria and abiotic particles is 102-104 times the concentration in the water (GESAMP 1995). Peter Fatum (1996)
made his master thesis at NERI in connection to this pond study. The thesis includes a survey of literature on SML to which we refer.
The SML is not well defined and the thickness of the microlayer is in this investigation defined by the sampling method. Sample collection with a Garrett screen mesh 1.25 mm and size
0.25 m2 gave 85 ml of SML corresponding to a surface microlayer thickness of 0.34 mm.
Theoretical initial concentration
5 L of spraying liquid was applied to a surface of approximately 130 m2 corresponding to 0.04 mm of liquid which is a minor size (12%) compared to the thickness of the SML. For
calculation of a theoretical initial concentration of pesticide in the SML after spraying, it is anticipated that all the pesticide is present in the SML, the SML being defined by the sampling
thickness as mentioned above. Theoretical sample volume of the SML is 130 x 10,000 x 0.034 cm3 = 44.2 L. The theoretical concentrations are shown in table 6.1
Table 6.1
Theoretical initial concentration of pyrethroids in surface microlayer (upper 0.34 mm)
Teoretisk startkoncentration af pyretroider i overflade mikrolaget (øverste 0,34 mm).
| Year |
Pond |
Fenpropathrin |
Permethrin |
(Es)fenvalerate |
Deltamethrin |
| År |
Vand-hul |
μg/L |
μg/L |
μg/L |
μg/L |
| 1995 |
3 |
11 300 |
2 800 |
5 600 |
2 800 |
| 1995 |
4 |
33 900 |
33 900 |
33 900 |
33 900 |
| 1996 |
3 |
9 000 |
8 500 |
7 900 |
8 500 |
| 1996 |
4 |
9 000 |
8 500 |
7 900 |
8 500 |
These concentrations are much higher than the solubility of these pesticides in pure water (table 5.1), but the solubility is increased by the presence of surfactants in the formulated
pesticide products.
Figures 6.4 - 6.5 show the concentration of pesticides in surface microlayer from 1 hour after spraying to 8 days after spraying .
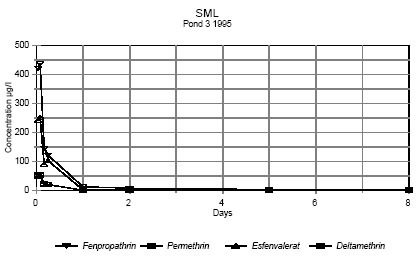
Figure 6.4
Concentration of pyrethroids in surface microlayer 1 hour to 8 days after spraying. Pond 3 1995
Koncentrationen af pyrethroider i overflademikrolaget fra 1 time til 8 dage efter udsprøjtning. Vandhul 3 1995
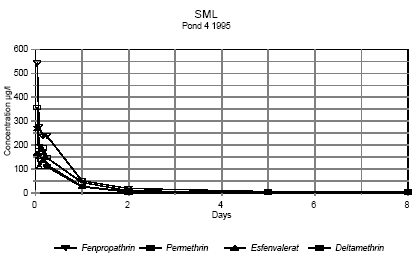
Figure 6.5
Concentration of pyrethroids in surface microlayer 1 hour to 8 days after spraying. Pond 4 1995
Koncentrationen af pyrethroider i overflademikrolaget fra 1 time til 8 dage efter udsprøjtning. Vandhul 4 1995
It is seen from the figures, that the concentration of pesticides decreases very rapidly. After two hours the concentration of pesticide has declined to about 0,3-7% of the initial
concentration as shown in table 6.2.
Table 6.2
Concentration of pyrethroids in surface microlayer two hours after application. Percentage of theoretical initial concentration. In 1996 it is the sum of isomers.
Koncentration af pyretroider i overflade mikrolaget to timer efter udsprøjtningen. Procentdel af den teoretiske startkoncentration. I 1996 er det summen af isomerer.
| Year |
Pond |
Fenpropathrin |
Permethrin |
(Es)fenvalerate |
Deltamethrin |
| År |
Vand-hul |
% |
% |
% |
% |
| 1995 |
3 |
3,9 |
1,9 |
4,5 |
2 |
| 1995 |
4 |
2,3 |
7,0 |
2,0 |
5,5 |
| 1996 |
3 |
0,8 |
0,3 |
0,6 |
0,3 |
| 1996 |
4 |
1,3 |
0,5 |
1,1 |
0,5 |
After one hour most of the decline is caused by diffusion from the SML into the water column and turbulent mixing within the water. The decline is faster in 1996, maybe caused by
different climatic conditions.
6.1.3 Water column
Distribution
Concentration gradient
Figures 6.6 – 6.9 show the concentration of fenpropathrin in the water column at three depths. The diagrams show examples of the course of concentration distribution and are
illustrative for the other pyrethroids too.
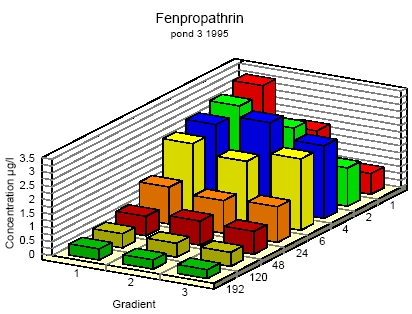
Figure 6.6
Concentration distribution of fenprapthrin in pond 3 1995 from 1 to 192 hours after application. Gradient 1-3 indicate the sampling depth (10 cm and 30 cm below the surface and 30
cm above the bottom.
Koncentrationsfordeling af fenpropathrin i vandhul 3 1995 1 til 192 timer efter udsprøjtningen. Gradient 1-3 angiver prøvetagningsdybden (10 cm og 30 cm under
overfladen og 30 cm over bunden).
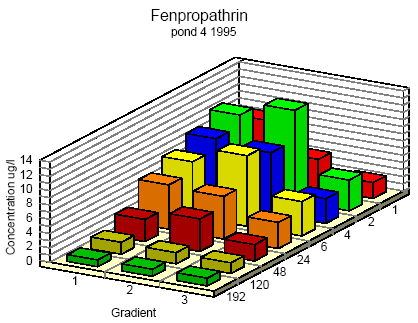
Figure 6.7
Concentration distribution of fenprapthrin in pond 4 1995 from 1 to 192 hours after application. Gradient 1-3 indicate the sampling depth (10 cm and 30 cm below the surface and 30
cm above the bottom.
Koncentrationsfordeling af fenpropathrin i vandhul 4 1995 1 til 192 timer efter udsprøjtningen. Gradient 1-3 angiver prøvetagningsdybden (10 cm og 30 cm under
overfladen og 30 cm over bunden).
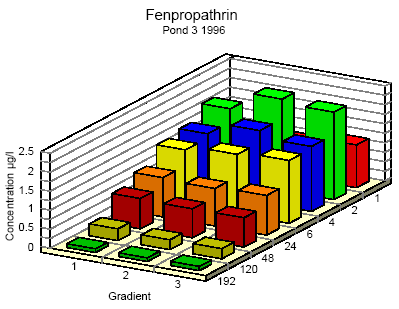
Figure 6.8
Concentration distribution of fenprapthrin in pond 3 1996 from 1 to 192 hours after application. Gradient 1-3 indicate the sampling depth (10 cm and 30 cm below the surface and 30
cm above the bottom.
Koncentrationsfordeling af fenpropathrin i vandhul 3 1996 1 til 192 timer efter udsprøjtningen. Gradient 1-3 angiver prøvetagningsdybden (10 cm og 30 cm under
overfladen og 30 cm over bunden).
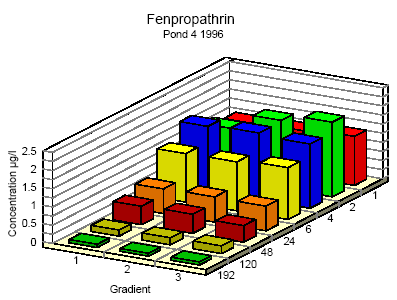
Figure 6.9
Concentration distribution of fenprapthrin in pond 4 1996 from 1 to 192 hours after application. Gradient 1-3 indicate the sampling depth (10 cm and 30 cm below the surface and 30
cm above the bottom.
Koncentrationsfordeling af fenpropathrin i vandhul 4 1996 1 til 192 timer efter udsprøjtningen. Gradient 1-3 angiver prøvetagningsdybden (10 cm og 30 cm under
overfladen og 30 cm over bunden).
One hour after spraying the pesticides have already been mixed into all of the water column. However, there is a distinct decrease in concentration from the upper 10 cm (gradient 1) to
30 cm above the bottom (gradient 3). After 6 hours the concentration is equal throughout the water body. The pesticides have been adsorbed to sediment and therefor the overall
concentration has decreased. Pesticides remaining in the water phase are evenly distributed.
Disappearance
Figures 6.10 – 6.12 show the rate of disappearance of pyrethroids in the water column 20 cm below the surface. If the disappearance is ruled by first order processes then

Ct = concentration at time t
Co = initial concentration
k = disappearance rate constant
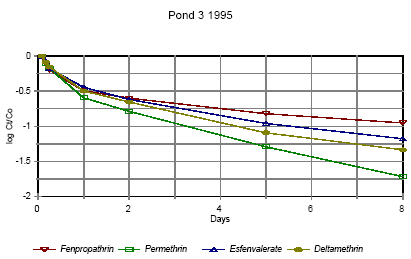
Figure 6.10
Disappearance rate of pyrethroids in pond 3 low dose 1995
Forsvindingsrate for pyrethroider i vandhul 3 lav dosering 1995
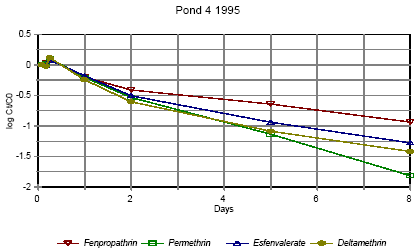
Figure 6.11
Disappearance rate of pyrethroids in pond 4 high dose 1995
Forsvindingsrate for pyrethroider i vandhul 4 høj dosering 1995
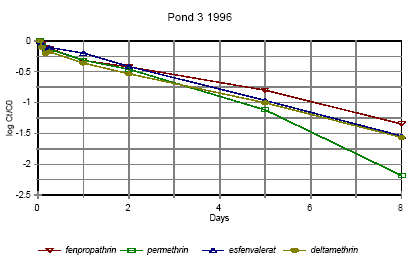
Figure 6.12
Disappearance rate of pyrethroids in pond 3 1996
Forsvindingsrate for pyrethroider i vandhul 3 1996
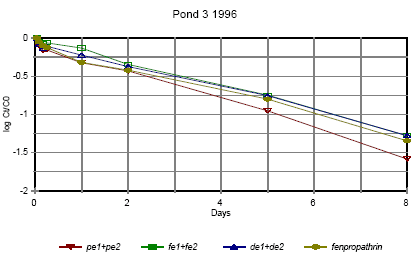
Figure 6.13
Disappearance rate of pyrethroids in pond 3 1996 for the sum of isomers. pe=permethrin, fe=fenvalerate, de=deltamethrin
Forsvindingsrate for pyrethroider i vandhul 3 1996 for summen af isomerer. pe=permethrin, fe=fenvalerate, de=deltamethrin
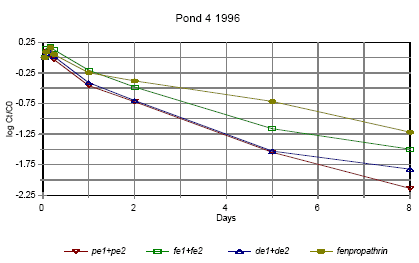
Figure 6.14
Disappearance rate of pyrethroids in pond 4 1996 for the sum of isomers. pe=permethrin, fe=fenvalerate, de=deltamethrin
Forsvindingsrate for pyrethroider i vandhul 4 1996 for summen af isomerer. pe=permethrin, fe=fenvalerate, de=deltamethrin
Figures 6.10 – 6.12 show disappearance of the single isomers while figures 6.13 – 6.14 show the sum of the isomers. For fenpropathrin the curves are identical, as fenpropathrin does
not change into other isomers.
In 1995 the disappearance rate was fast in the beginning and slowed down after about one day. This may partly be caused by a fast disappearance by mixing into the rest of the water
column and adsorption into the sediment. After full mixing the decrease in concentration is mainly ruled by suction into the sediment. This is in agreement with the observation that full
mixing was achieved after about one day (cf. figures 6.6 – 6.7) In 1996 there was mixing after a few hours (cf. figures 6.8 – 6.9) and therefore the change in disappearance rate is seen
after two hours. The difference between 1995 and 1996 may be caused by differences in climatic conditions the two years (Experiments took place in October 1995 and in June 1996)
or by differences in the amount of macrophytes.
According to the model analysis (part II) disappearance of pesticides from the water phase does not follow first order relationship, so we cannot expect a linear log disappearance rate.
By comparing figure 6.12 and figure 6.13 it is seen that part of the disappearance of permethrin, esfenvalerate and deltamethrin is caused by isomerisation.
Figure 6.13 indicates that the disappearance rate in pond 3 of fenpropathrin, fenvalerate and deltamethrin is about the same if we look at the sum of isomers. The disappearance rate of
permethrin is higher which may be due to a higher photosensitivity of this compound (Leahey 1985). Leahey (1985) also mentions photoisomerisation of permethrin and deltamethrin.
This study demonstrates, that this is also the case for esfenvalerate.
The disappearance rate in pond 4 is faster for permethrin, fenvalerate and deltamethrin. This observation is discussed in more detail in section 6.1.7 on SPMDs.
6.1.4 Enrichment in the SML
Pyrethroid insecticides have very low solubility in water (see table 5.1) and are easily dissolved in organic solvents. So it is likely, that the pyrethroids will show higher affinity to the SML
with its higher content of fatty compounds and surfactants than to the water phase.
Enrichment factor
The ratio of pesticide concentration in the SML compared to water phase is called the enrichment factor, EF.
Figures 6.15 – 6.16 show the enrichment of pyrethroids in the SML compared to water in 1995.
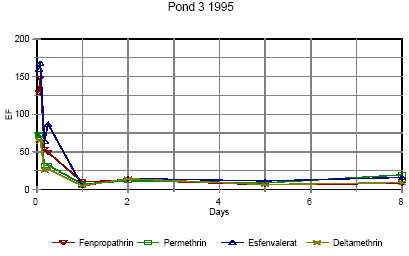
Figure 6.15
Enrichment of pyrethroids in surface microlayer in pond 3, low dose. EF=enrichment factor.
Berigelse af pyrethoider i overflade mikrolaget i vandhul 3, lav dosering. EF=berigelsesfaktoren.
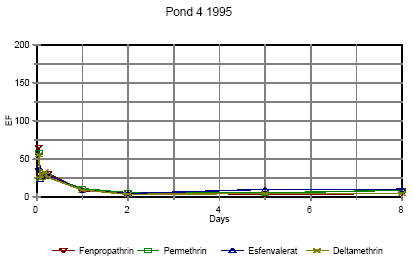
Figure 6.16
Enrichment of pyrethroids in surface microlayer in pond 4, high dose. EF=enrichment factor.
Berigelse af pyrethoider i overflade mikrolaget i vandhul 4, høj dosering. EF=berigelsesfaktoren.
Right after application the enrichment factor is very high but it is not really an enrichment but rather a reflection of the pesticides not being mixed into the water phase yet. The rapid
decline in EF is primarily a result of mixing.
As demonstrated in section 6.1.3 the mixing within the water column is completed after about one day in 1995. After about one day the EF has also reached a constant value of 8-10 in
pond 3 and 5-10 in pond 4 1995. This factor expresses the actual enrichment. Fatum (1996) also confirms this: In a laboratory experiment SML spiked with esfenvalerate was added to
a water phase with pond water. The two phases were partly mixed, so after 2 hours the enrichment, EF, was 2.3. After 72 hours the EF was 11.7 which is in good agreement with the
field results from the pond study.
6.1.5 Sediment
Results of the sediment analysis 1996 are shown in figures 6.17 – 6.18. Results from 1995 are similar.
Click here to se the Figure.
Figure 6.17
Concentration of pyrethroids in dry sediment from pond 3, μ/kg
Koncentrationen af pyrethroider i sediment tørstof fra vandhul 3, μg/kg
Click here to se the Figure.
Figure 6.18
oncentration of pyrethroids in dry sediment from pond 4, μ/kg
Koncentrationen af pyrethroider i sediment tørstof fra vandhul 4, μg/kg
The results of the sediment analysis are confusing. It was expected that sediment concentrations would increase at the beginning of the experiment caused by adsorption of the
hydrophobic pyrethroids to sediment particles. After some days we expected to see a small decline caused by microbial degradation of the pesticides. The results do not contradict this
hypothesis, but the uncertainty of the results seems to be too large.
The uncertainty is a sum of uncertainties from sampling of sediment and analysis of sediment.
Spiked sediment samples were used as reference material. Two reference samples were analysed with each batch of samples. The variance between these samples is the overall
variance of the method of analysis.
At each sampling time sediment samples were collected from each of the four quadrants of a pond. Most of the samples were pooled before they were sieved, dried and analysed.
However, some of the samples were analysed without pooling. The variance between these samples also includes variance of the sampling procedure and variance caused by
inhomogenity of pesticide distribution. However, the two contributions cannot be distinguished.
Variance of analysis method sm2 is calculated from the spiked sediment samples. Total variance st2 including sampling, inhomogeneity of sediment and analysis is calculated as the mean
variance of 4 series of analysis of sediment, one from each pond at day 16. It seems that the size of the variance is depending on the concentration level, which is different in the spiked
samples compared to the day-16 samples. There is no reason to expect different variances for the four compounds. For that reason all variances have been converted to the variance of
a 10 μg/kg sample. The variance of sampling is calculated as the difference between st2 and sm2. Table 6.3 shows the variances for each pyrethroid.
Table 6.3
Uncertainty of sediment analysis. st2 is the total variance of sampling and analysis, sm2 is variance of the analytical method and ss2 is variance of sampling and sediment inhomogeneity
etc. All variances have been converted to concentrations of 10 μg/kg dry sediment.
Usikkerhed på sedimentanalyser. st2 er total varians af prøvetagning og analyse. sm2 er varians af den analytiske metode and ss2 er varians af prøvetagning,
inhomogenitet af sediment o.s.v. Alle varianser er blevet omregnet til koncentrationen 10 μg/kg tør sediment.
| Pesticide |
st2 |
sm2 |
ss2 |
| Fenpropathrin |
15 |
2 |
13 |
| Permethrin |
21 |
3 |
16 |
| Esfenvalerate |
22 |
2 |
20 |
| Deltamethrin |
38 |
7 |
31 |
The variances for fenpropathrin, permethrin and esfenvalerate are about the same. For deltamethrin it is somewhat higher. Re-examination of data from the spiked samples showed that
in some samples the recovery of especially deltamethrin was poor, 15% and 21%, compared to usually 45%. The low recovery may come from the SFE extraction procedure, as it has
later been observed that occasionally the amount of eluent has been too small, which will influence especially deltamethrin, which is eluted latest from the trap.
It seems that contribution to variance (uncertainty) from sampling is about 5-10 times the contribution from analysis.
According to the model analysis (part II) the pyrethroids are mainly adsorbed in the upper 1-2 mm of the sediment. We sampled approximately the upper 2 cm of the sediment for
analysis. This has introduced some uncertainty in how much the contaminated sediment was diluted with uncontaminated sediment during sampling:
Future analysis of pesticides in sediment will need improvement of sampling technique as well as extraction procedure.
6.1.6 SPMDs
Results from SPMD experiments are available from 1996.
Membranes were placed in the ponds immediately prior to spraying, except the membranes above the water surface, which were mounted one hour after spraying.
The SPMDs were left in the ponds for two month.
Figures 6.19 and 6.20 show the concentration of pyrehtroids in the membranes. Each value is the average of duplicate observations.
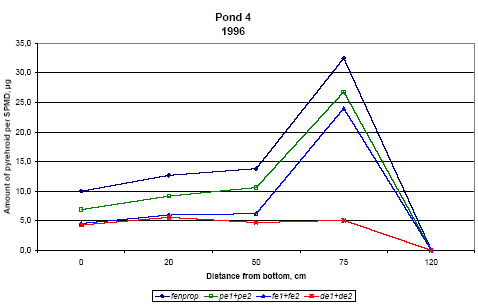
Figure 6.19
Amount of pyrethroids, sum of isomers, in SPMDs from pond 4, μg/membrane.
Indhold af pyrethroider, sum af isomerer, i SPMDer i vandhul 4, μg/membran.
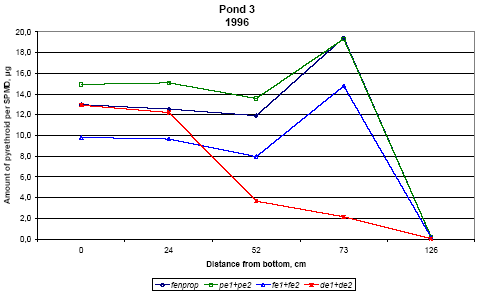
Figure 6.20
Amount of pyrethroids, sum of isomers, in SPMDs from pond 3, μg/membrane.
Indhold af pyrethroider i SPMDer, sum af isomerer, i vandhul 3, μg/membran.
Pond 4 is the pond with clear water while the water in pond three contained more particulate matter caused by the activity of the snails.
Concentration of pesticides in membranes above the water surface was low compared to SPMDs exposed to water, the amount being 50-200 ng/-membrane. This amount reflects the
concentration of pyrethroids in the air above the water. It is either the result of evaporation of pyrethroids or it may come from small droplets of spraying liquid remaining in the air.
For fenpropathrin, permethrin and fenvalerate, the amount of pesticide uptake in the membrane is largest close to the surface. In pond 4 the concentration in SPMDs decreases with
distance from the surface. In pond 3 there seems to be a fall in concentration from the surface to 20 cm below the surface and a small increase closer to the sediment. The concentration
of deltamethrin in SPMDs is lower than that of the other pyrethroids especially in the upper part of the water column.
The uptake of pyrethroids in the SPMDs depends on the concentration of dissolved compound in the water. Pesticide adsorbed to particulate matter or dissolved organic matter will not
pass the membrane (Huckins et al., 1997). The concentration of a compound in the SPMDs results from a simultaneous uptake and elimination but for very hydrophobic compounds like
the pyrethroids the elimination rate is very low.
When SPMDs are exposed to solutions of lipophilic compounds the initial uptake will be linear. In the ponds there is a concentration gradient after spraying and this gradient levels out
within about 4 hours. Within that period the uptake will still be linear. That means that the concentration of pesticide in the membranes reflects the maximum concentration of dissolved
pesticide that the membranes have experienced during the exposure time.
To calculate the concentration of a compound in the water, it is necessary to know the uptake rate of the compound. This can be determined in laboratory experiments. This has not
been done yet so the following interpretation of the data is only qualitative. The interpretation is supported by the model analysis in part II.
The two ponds have received the same amount of pesticide and the same amount of each of them. If the two ponds were identical we would therefore expect the same concentration of
pyrethroids in SPMDs from the two ponds. This is not the case. If the pyrethroids had the same physical chemical properties we would also expect the same concentration of each
pesticide in the membranes. This is not the case either.
The maximum concentration of pyrethroids in the SPMDs is much higher in pond 4. That may be explained by the presence of higher amounts of particulate matter in pond 3. Part of the
pyrethroids will adsorb rapidly to the particulate matter and thereby the concentration of dissolved pyrethroid is lowered.
The pyrethroids adsorb strongly to the sediment, which sucks dissolved pyrethroid from the water causing a decrease in concentration in the water column. This decrease is faster in
pond 4 cf. figures 3.10 and 3.11, which may again be explained by the increased retention of pyrethroids caused by adsorption to organic matter. The faster decrease in pond 4 is
reflected in a steeper gradient in SPMD concentration in that pond.
According to the model analysis this adsorption is reversible. Because of the delayed transport into the sediment, the concentration of pyrethroid is higher in pond 3 after some time. This
is reflected in the higher concentration of pyrethroids in SPMDs in pond 3 apart from the initial uptake in the SPMDs at the upper position (75 cm from the bottom).
Deltamethrin shows a quite different uptake pattern compared to the other pyrethroids. More experiments are needed to explain the difference.
6.2 Side parameters
6.2.1 Chlorophyll A
Concentration of chlorophyll A in subsurface pond water (20 cm) is shown in figures 6.21 and 6.22. Chlorophyll A is an indicator of phytoplankton growth.
1995
In 1995 the concentration of chlorophyll does not change much during the experiment except on September 28, where the concentration rises significantly in pond 2 (control) and pond
3 (low dosage). The samples were collected at the same time of the day as the other days so the light intensity is probably the same. The phenomenon is probably not caused by the
pesticides since it is observed in the control pond as well.
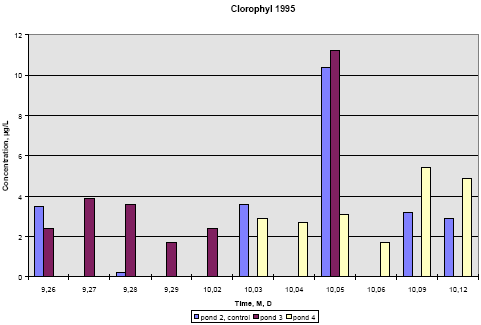
Figure 6.21
Concentration of chlorophyll A in subsurface pond water, 20 cm depth. Year 1995, sample dates are marked month, day.
Koncentration af klorofyl A i vandhulsvand 20 cm under vandoverfladen. År 1995, prøvetagningsdatoer er angivet som måned, dag.
1996
In 1996 pond 3 was dominated by big fresh water snails, which had eaten almost all the macrophytes. This implied a totally different environment compared to pond 2 and 4. From
figure 6.22 it is seen that chlorophyll concentration in pond 2 and 4 is at the same level of 2-4 μg/L throughout the experiment. However, in pond 3 the chlorophyll concentration
increases up to 15 μg/L with the increase beginning at day 1 after spraying.
The algae bloom that is reflected by the concentration of chlorophyll may be caused by the lack of macrophytes thereby giving less competition to the algae for light and nutrients. At the
same time most grassers like daphnia have been killed by the pyrethroids.
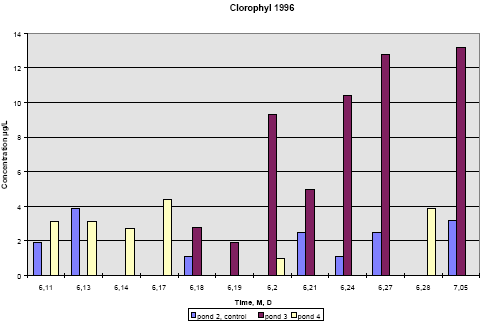
Figure 6.22
Concentration of chlorophyll A in subsurface pond water, 20 cm depth. Year 1996, sample dates are marked month, day.
Koncentration af klorofyl A i vandhulsvand 20 cm under vandoverfladen. År 1996, prøvetagningsdatoer er angivet som måned, dag.
6.2.2 Other side parameters
Alkalinity and conductivity were very stable for each pond throughout the season but changed a little from year to year. Table 6.4 shows the average values. In 1996 before spraying of
pond 4, water from the three ponds were mixed together with ground water and water from the reservoir and pumped back to the ponds.
Table 6.4
Conductivity and alkalinity of pond water, average values and standard deviation.
Ledningsevne og alkalinitet af vandhulsvand, gennemsnitsværdier og standard afvigelse.
Year
År
|
Pond
Vandhul
|
Conductivity mS
Ledningsevne mS
|
Alkalinity meq/L
Alkalinitet meq/L
|
| 1995 |
2 (control) |
0.23± 0.02 |
2.52 ± 0.05 |
| 1995 |
3 |
0.24 ± 0.02 |
2.63 ± 0.08 |
| 1995 |
4 |
0.31 ± 0.01 |
1.86 ± 0.12 |
| 1996 |
2 (control) |
0.34 ± 0.02 |
1.36 ± 0.14 |
| 1996 |
3 |
0.49 ± 0.01 |
0.87 ± 0.08 |
| 1996 |
4 |
0.31 ± 0.00 |
2.97 ± 0.05 |
Mean alkalinity of Danish lakes (Jensen et al., 1997) is 2.08 meq/L with 1.25 meq/L as the 25% fractile and 2.85 as the 75% fractile. Alkalinity of the pond water seems to cover a
broad range of Danish lakes.
Figures 6.23 – 6.25 show variation of O2 concentration, temperature, pH and turbidity of the pond water in 1996.
1995
Click here to se the Figure.
Figure 6.23
Measured values of dissolved O2 concentration, temperature, pH and turbidity in pond 4 from June 12 to June 28 1996.
Målte værdier af opløst O2 koncentration, temperatur, pH og turbiditet i vandhul 4 fra 12 juni til 28 juni 1996.
Click here to se the Figure.
Figure 6.24
Measured values of dissolved O2 concentration, temperature, pH and turbidity in pond 3 from June 19 to July 5 1996.
Målte værdier af opløst O2 koncentration, temperatur, pH og turbiditet i vandhul 3 fra 19 juni til 5 juli 1996.
Click here to se the Figure.
Figure 6.25
Measured values of Dissolved O2 concentration, temperature, pH and turbidity in pond 3 from June 13 to July 5 1996.
Målte værdier af opløst O2 koncentration, temperatur, pH og turbiditet i vandhul 3 fra 13 juni til 5 juli 1996.
Pond 3 with the snails is a little more acidic than ponds 2 and 4. About 75% of Danish lakes have pH between 8 and 9 so pH of all three ponds is close to that range.
Dissolved oxygen concentration is higher in pond 4 than in ponds 2 and 3. However oxygen concentration in these ponds is quite normal (Nørrevang og Meyer 1969) Oxygen
concentration was highest in the upper part of the ponds but didn't vary much from top to bottom.
Temperature was also highest in the top of the ponds but the difference in temperature between top and bottom was usually less than 1°C.
6.2.3 Total Phosphorus and total nitrogen
Table 6.5 displays the concentration of Total phosphorus (TP) and nitrogen (TN). For Danish lakes the mean and median concentrations and the 25% fractile of TP and TN are 0.244,
0.152 and 0.076 mg P/L and 1.99, 1.82 and 1.17 mg N/L (Jensen et al 1997). It is seen that the concentration of nutrients in the experimental ponds is low.
Table 6.5
Concentration of Total phosphorus and nitrogen in surface microlayer and water. Average concentrations during the experimental period and standard deviations
Koncentrationen af Total fosfor og nitrogen i overflade mikrolag og vand. Gennemsnitskoncentrationer gennem forsøgsperioden og standard afvigelser.
Year
År
|
Pond
Vandhul
|
Total phosphorus mg/L
Total fosfor mg/L
|
Total nitrogen mg/L
Total nitrogen mg/L
|
| 1995 |
2 (control) |
0.091 ± 0.044 |
0.97 ± 0.30 |
| SML |
3 |
0.165 ± 0.192 |
0.68 ± 0.20 |
| OML |
4 |
0.108 ± 0.052 |
1.86 ± 0.12 |
| 1995 |
2 (control) |
0.111 ± 0.103 |
0.55 ± 0.07 |
| Water |
3 |
0.040 ± 0.002 |
0.67 ± 0.23 |
| Vand |
4 |
0.035 ± 0.006 |
0.38 ± 0.07 |
| 1996 |
2 |
0.080 ± 0.031 |
0.85 ± 0.26 |
| SML |
3 |
0.080 ± 0.027 |
0.82 ± 0.29 |
| OML |
4 |
0.065 ± 0.029 |
0.85 ± 0.34 |
| 1996 |
2 (control) |
0.034 ± 0.010 |
0.37 ± 0.08 |
| Water |
3 |
0.040 ± 0.003 |
0.55 ± 0.10 |
| Vand |
4 |
0.024 ± 0.006 |
0.34 ± 0.07 |
6.2.4 Aquatic fauna
Skjernov (1997) investigated the occurrence of aquatic fauna in 2 of the ponds. Figure 6.26 is a list of animals observed in ponds 2 and 4 in 1996.
Habitat
Levested
|
Taxonomic group
Taksonomisk gruppe
|
Pond 2, control
Vandhul 2
Kontrol
|
Pond 4, control
Vandhul 4
Kontrol
|
| OML |
S: Gerris sp. |
++ |
++ |
| |
A: Argyroneta aquatica |
+ |
+ |
| |
O: Ostracoda |
+++ |
+++ |
| Tilknyttet OML |
F: Dystiscidae (voksne) |
++ |
++ |
| |
F: Gyrinidae (voksne) |
+ |
+ |
| |
F: Hydrophilidae (voksne) |
+ |
+ |
| |
S: Notonecta sp. |
++ |
++ |
| |
S: Cymatiinae sp. |
+++ |
+++ |
| Pelagialet |
O: Cladocera |
+++ |
+++ |
| |
O: Copepoda |
+ |
+ |
| |
F: Dytiscidae (larver) |
+ |
+ |
| |
F: Hydrophilidae (larver) |
+ |
+ |
| |
A: Asellus aquaticus |
+ |
0 |
| |
S: Baetis sp. (nymfe) |
+ |
+ |
| |
F: Odonata (nymfe) |
+ |
+ |
| Bunden |
F: Chironomidae (larver) |
++ |
+ |
| |
O: Oligochaeta |
+++ |
++ |
| På planter etc. |
O: Hirudinea |
+ |
+ |
| |
A: Lymnaea palustris |
++ |
++ |
| |
F: Tipuloidea |
0 |
+ |
Figure 6.26
List of fauna groups observed in ponds 2 and 4 in 1996 before spraying (Skjernov 1997). A = Species, S = Genus, F = Family, O = Order; Occurrence: +++ = many,
++ = observed frequently, + = a few observed, 0 = not observed.
Liste over fauna grupper, der blev obseveret i vandhul 2 og 4 før pesticidsprøjtning (Skjernov 1997). A = Art, S = Slægt, F = Familie, O = Orden; Forekomst:
+++ = mange, ++ = ofte observeret, + = enkelte observeret, 0 = ikke observeret.
6.2.5 Texture
Texture of the sediment in the three experimental ponds is displayed in table 6.6. The texture shows some natural variation even though the ponds have been treated identically.
Table 6.6
Texture of sediment in the three experimental ponds.
Tekstur af sedimentet i de tre forsøgsvandhuller.
Pond no.
Vandhul nr.
|
|
|
2 |
3 |
4 |
Calcium carbonate
Calciumcarbonat.
|
|
% of dry sample
% af tørret prøve
|
2.4 |
4.7 |
3.3 |
Coarse sand
Grovsand
|
(>200 m) |
% of dry sample
% af tørret prøve
|
20.2 |
13.4 |
18.8 |
Sand
Gfsand
|
(63-200 m) |
% of dry sample
% af tørret prøve
|
27 |
23.4 |
25.4 |
Coarse silt
Grovsilt
|
(20-63 m) |
% of dry sample
% af tørret prøve
|
10.1 |
11.9 |
11 |
Silt
Silt
|
(2-20 m) |
% of dry sample
% af tørret prøve
|
16.3 |
19.3 |
16.4 |
Clay
Ler
|
(<2 m) |
% of dry sample
% af tørret prøve
|
20.8 |
22.8 |
21.7 |
Humus
Humus
|
|
% of dry sample
% af tørret prøve
|
3.2 |
4.5 |
3.4 |
Total carbon
Total kulstof
|
|
% of dry sample
% af tørret prøve
|
2.15 |
3.22 |
2.4 |
Humus/Total C
Humus/Total C
|
|
|
1.49 |
1.40 |
1.42 |
| Front page | | Contents | | Previous | | Next | | Top |
Version 1.0 September 2004, © Danish Environmental Protection Agency
|