|
| Front page | | Contents | | Previous | | Next |
Fate of Pyrethroids in Farmland Ponds
11 Experimental results, part II
The main source of data comes from experiments using artificial ponds (mesocosmos) (part I). As a supplement, a data source from laboratory scale testing using 14°C marked
fenvalerate in glass containers is included (Morgenroth, 1992a and b).
11.1 The Artificial Ponds
Pond geometry
The ponds were established in a clayey soil having a water surface area of about 130 m2 and a depth of about 75 cm. The slope of the side walls is 45° and the total water volume is
about 86 m3. They were dug and supplied with sediment from a natural pond one year before the first experiment.
Compartment measured
Three different compartments were analysed: (1) surface micro layer; (2) water column; (3) sediment. The experimental uncertainty of the sediment data was so large, that these data will
be excluded from the present analysis. Four ponds (in the following numbered 1, 2, 3 and 4) were used and the measurements took place during summer in the years 1995 and 1996.
Pond 1 was a reservoir, pond 2 was control (no spraying) and the ponds 3 and 4 were sprayed. After spraying, samples were collected at specific time intervals during approximately 9
days.
Sprayed substances
Four different pyrethroids was sprayed in the ponds at every spraying event. Low and a high dosage levels were supplied in different ponds. The sprayed substances were: deltamethrin,
permethrin, esfenvalerate and fenpropathrin. A non constant fraction of the esfenvalerate molecules change to an other isomeric form during the experimentation. The two isomers occur
as different chromatographic peaks, however, they are close to each other indicating closely related adsorption properties and they will be treated as one substance in the following
model investigation. The name fenvalerate will be used in this investigation as a united term for the two isomers. Similar problems of isomerization was observed for deltamethrin and
permethrin, but the different isomeric forms are still closely related to each other and will be treated united. I was first in 1996 that the isomerization problem was identified in relation to
the analytical work, so only data from 1996 are used for deltamethrin, permethrin and fenvalerate. Fenpropathrin do not make different isomers so both data from 1995 and 1996 are
useful in this case. A more detailed discussion of the substances is given in part I. The dosages values and the substances from different ponds and years are shown in Table 11.1.
Table 11.1
The dosage values (mg/m2).
Værdier for dosering (mg/m2).
| Substances |
Year 1995 |
Year 1996 |
| Pond 3 |
Pond 4 |
Pond 3 |
Pond 4 |
| Deltamethrin |
- |
- |
2.9 |
2.9 |
| Permethrin |
- |
- |
2.9 |
2.9 |
Esfenvalerate
(Fenvalerate) |
- |
- |
2.7 |
2.7 |
| Fenpropathrin |
3.8 |
11.5 |
3.1 |
3.1 |
11.1.1 Surface micro layer (SML)
Sampling method
Surface micro layer (SML) samples were taken according to the method of (Garrett, 1965). The principle is to move a screen upward through the water surface. The surface tension
will form a thin water film in the holes of the screen and the liquid trapped in the film is considered as the upper layer of water. The thickness of the sampled water film can be estimated
as the total sample volume divided by the area of the screen. This measure is strongly related to the sampling devise and there are no reasons to believe that the thickness sampled is the
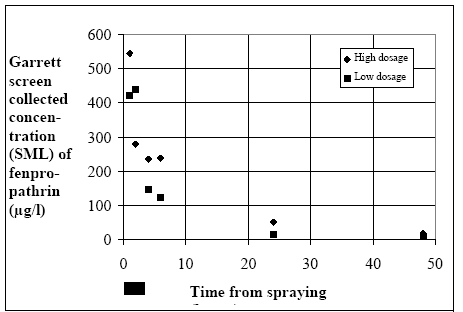
equivalent to a real micro layer thickness. An estimate of sample thickness is 340 μm. Figure 11.1 shows the experimental results for fenpropathrin for low and high dosage respectively.

Figure 11.1
Disappearance from the surface micro layer (SML) sampled using a Garrett screen.
Forsvinden fra overflade micro laget (SML) indsamlet med anvendelse af en Garrett sigte.
11.1.2 Water column
Sampling
Concentration depth profile
All water column samples were horizontally pooled from different locations in the pond. The samples were collected both as horizontal pooled samples, where samples from a depth of
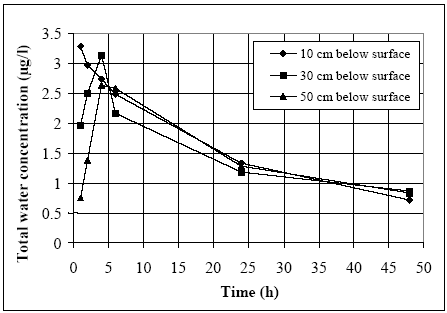
20 cm below surface were pooled and as profile samples, where the different depths were kept separated. The profile measurements identify the vertical distribution of the substances as
shown in Figure 11.2. for fenpropathrin. After about 4 hours no difference exists between the concentrations from different depths, apparently due to the turbulence in the water column.

Figure 11.2
Total concentration of fenpropathrin (dissolved and adsorbed to suspended solids) in the water column at different depths. A complete mixed situation seems to exist after about 4
hours.
Total koncentration af fenpropathrin (opløst og adsorberet til partikler) i vand søjler ved forskellige dybder. En fuldt opblandet situation kan ses efter ca. 4 timer.
Horizontally pooled samples
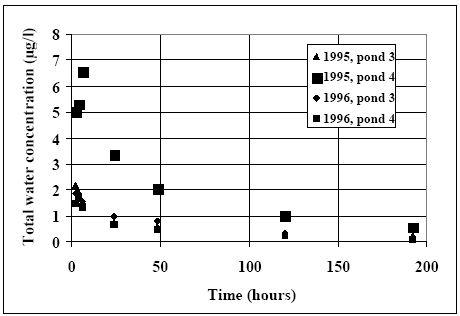
Results for the pooled samples are shown for all registered fenpropathrin measurements in Figure 11.3. The related dosage values can be seen in Table 11.1, where the high
concentration series is 1995, pond 4. The other pond experiments seem to follow almost the same path although pond 3 at year 1995 is related to a slightly lover dose than the ponds 3
and 4 at year 1996. In the high dosage case the concentration increases for a short period after application, and this could be a result of a concentration profile as displayed in the initial
period in Figure 14.2. Such a profile may introduce an error in the estimation of the mean water column concentration value.

Figure 11.3
The total water concentration (dissolved and from suspended solids), pooled (depth integrated) samples.
Den totale vand koncentration (opløst og frasuspenderede partikler) prøverne er podede vertikalt (dybde integreret).
11.2 Additional experiment for fenvalerate
Test system
Analytical technique
14C marked fenvalerate (C) and fenvalerate (P) were investigated using one liter round glass containers (Morgenroth, 1992a and b) having a diameter of 10.6 cm. 250 g wet sediment
(145.5 g dry weight) were supplied forming a sediment depth of 2 cm in the containers and 550 ml of water was filled on top of the sediment. The system was aerated continuously
under dark conditions in order to ensure aerobic degradation and to eliminate photo degradation. One river water/sediment and one pond water/sediment system is analyzed for each
type (C and P) but, only the result from the pond system is used in this investigation. Two parallel experiments were made (A and B) and water and sediment sampled from each
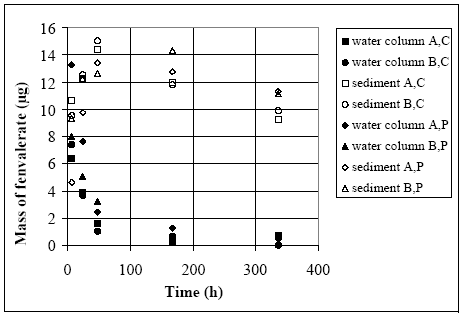
experiment gave two time series of concentration development in both water and sediment. The total mass of substance in the glass containers are calculated from the concentration
measurements and shown in Figure 11.4. The analytical technique was based on Thin-Layer Chromatography (TLC) combined with 14C radio active counting. The TLC technique was
used to separate the parent component from degradation products.

Figure 11.4
Results from glass container experiments (Morgenroth, 1992a and b) in form of the mass of fenvalerate type C and P in both water column and sediment, where A and B are two
parallel containers. The index A,C means container A for fenvalerate type C.
Resultater fra eksperimenter med glasbeholdere (Morgenroth, 1992a and b). Massen af fenvalerat type C og P er målt i både vandsøjlen og i sedimentet, hvor A og B er to
parallelle beholdere. Indekset A, C betyder glas A og fenvalerat type C.
| Front page | | Contents | | Previous | | Next | | Top |
Version 1.0 September 2004, © Danish Environmental Protection Agency
|