|
| Front page | | Contents | | Previous | | Next |
Fate of Pyrethroids in Farmland Ponds
12 System description, part II
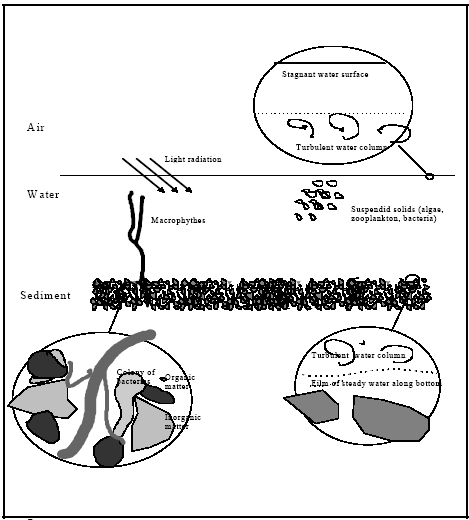
In this chapter the system is outlined based on possible factors of importance in the exposure models, see Figure 12.1. Obviously, the suggested system ends up in a rather simplified
analogy with the complex and heterogeneous reality. The simplifications are needed because all elements in the system have to be quantified by mathematical expressions and they need
to be conceptually simple. The model assumptions develop as a consequence of the system simplifications in relation to reality, so, the mathematical modelling results must be interpreted
in relation to the assumptions discussed in this chapter.

Figure 12.1
The pond system, where mechanisms of possible relevans are identified.
Systempræsentation af et vandhul, hvor mekanismer med mulig relevans er anført.
12.1 Relevant transport mechanisms and processes
Transport mechanisms
Possible transport mechanisms are volatilisation, molecular diffusion, turbulent dispersion and adjective transport caused by sedimentation of suspended solids from the water column to
the sediment. The molecular diffusion will primarily take place through the surface micro layer, through the film of stagnant water at the sediment/water interface and within the sediment
pore water. Turbulent dispersion, also named eddy dispersion, is the dominating transport mechanism in the water column and much more effective than the molecular diffusion.
Biological activity (bioturbation) may also take place in the sediment and may cause a dramatic increase in the transport rates in the sediment compared to transport by molecular
diffusion alone.
Processes
Relevant processes are adsorption and degradation. Adsorption in the case of hydrophobic substances like pyrethroids is mainly governed by partitioning to organic matter, so all
organic surfaces will be subject to adsorption. Three different degradation processes can be relevant: (1) hydrolysis; (2) photo degradation; (3) biological degradation.
12.2 Governing assumptions
The assumptions in all investigated models will be described in this paragraph. The following model analysis is purely a result of these assumptions and it is important to note that
mathematical models just quantifies the assumptions or in other words they determine the consequence of the assumptions by calculating the concentration developments.
12.2.1 Transport description
Molecular diffusion
Molecular diffusion is assumed to be the only transport mechanism in:
(1) surface micro layer; (2) film of stagnant water at the sediment/water interface; (3) in the sediment pore water. The molecular diffusion is assumed to be a result of randomly moving
molecules yielding the conventional diffusion description by the diffusion coefficient. The turbulent dispersion in the water column is assumed to give a completely mixed situation. The
assumption of complete mixing seems to be valid after approximately 4 hours after spraying, see Figure 12.2.
1. dimensional approximation
The transport in the surface micro layer and in the sediment is assumed to be a 1. dimensional (vertical) diffusion. The ponds are established in virtually pure clay so the vertical transport
by advection in the sediment is neglected. The 1. dimensional approximation may be problematic in the sediment in cases where the length scale for the depth of substance contamination
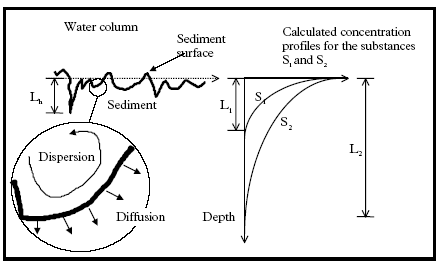
(L1 and L2 in the exemplified concentration profiles of Figure 12.2) is in the same magnitude as the length scale for heterogeneity in the sediment (Lh in Figure 12.2). In Figure 12.2 to
the right, two hypothetical concentration profiles are shown for two substances (S1 and S2).The values of S1 and S2 can be interpreted as the horizontal mean value in the 1.
dimensional vertical profile description. The substance S2 is transported deeper into the sediment than substance S1. In Figure 12.2 the 1. dimensional approximation is problematic for
substance S1, because, Lh ≈ L1, but less problematic for S2, because, Lh<<L2. Hydrophobic substances like pyrethroids will have a high affinity for adsorption to the sediment and
the diffusion depth will therefore be relatively small. Thus the 1. dimensional approximation may be problematic. Nevertheless, a 1. dimensional description may still give valid predictions
if the heterogeneity is included in the diffusion coefficient as an effective diffusion coefficient. The value of such an effective diffusion coefficient dependents both on the sediment
characteristics and molecular diffusion coefficient. The value of an effective diffusion coefficient can easily be much larger than the molecular diffusion coefficient, because the true surface
area between the water column and the sediment is increased due to the heterogeneity. If, in Figure 12.2, the length L1 is in the same magnitude as the length Lh then the substance can
be transported to the depth L1 much quicker than predicted by the molecular diffusion coefficient. This is true because the area of the sediment water interface is increased. Contrary the
tortuous pore structure in the sediment may reduce the value of the effective diffusion coefficient.

Figure 12.2
Definition of important length scales in relation to the 1. dimensional approximation for the transport, description in the sediment. Lh: length scale of heterogeneity in the sediment, L1 and
2 the contaminated depth at a specific time for the substances S1 and S2 respectively.
Definition af nogle nøgle længder i forhold til den 1. dimensionale forudsætning anvendt for sediment beskrivelsen. Lh: Længdeskala for heterogenitet i sedimentet, L1 hhv.
L2 er den dybde der til et givent tidspunkt indeholder hhv. stof S1 og stof S2.
Volatilisation
The volatilisation rate from the water surface is assumed to be of 1. order in relation to the water column concentration. This seems reasonable if: (1) the substance content in the air is
negligible in relation to the transportation mechanism, which means that the transfer is dominated by the water boundary layer (Schwarzenbach, 1993, pp. 220); (2) the influence of
substance enrichment in the surface micro layer is negligible. Statement No.1 does not seem problematic while No. 2 is critical due to the fact that high substance concentrations are
measured in the surface micro layers. In the very beginning after spraying, where the substance in the surface micro layer is emptied into the bulk water column, there may also be an
increased volatilisation into the air. However, later and if the enrichment is governed by adsorption equilibrium between the bulk water column and the surface micro layer it is not
necessarily true that the volatilisation is influenced by the enrichment at the surface. In the latter case the substance activity in the surface micro layer will be equal to the activity in the
bulk water column and the volatilisation will tend to be proportional to this activity and thus proportional to the substance concentration in the bulk water column.
12.2.2 Processes
Two types of processes are involved: (1) adsorption; (2) degradation. Both of them can be a result of a series of completely different mechanisms, e.g. the adsorption can be controlled
by either surface charge in ion bindings, organic matter partitioning, or just by trapping molecules in the structure of the adsorption medium.
Adsorption
The adsorption is assumed to be linear, reversible and instantaneous. The assumption of linearity is valid in general for "low" concentration levels, so the most critical situation in relation
to this assumption may be at the surface micro layer in the beginning after spraying, where the concentration level is extremely high. On the other hand in the bulk water column the
concentration is relatively low at a few μg/l and the linearity seems to be more reasonable. The reversibility is most critical for longer time periods of adsorption and the experimental
period for the artificial ponds is rather short (192 hours). The last assumption of instantaneous adsorption may be most problematic in the sediment, where local aggregate diffusion can
take place. Other reasons for non instantaneous (kinetic) adsorption could be formation of concentration clusters in the water column having higher concentration than the average
concentration in the bulk water.
Degradation
The degradation is assumed to be of 1. order and only the dissolved part of the substance is subject to degradation. The 1. order approximation is typically valid for relatively low
concentration levels. Toräng et al., (1998), have investigated the 1. order approximation for 2,4 D and concludes that the 1. order approximation is valid for concentration levels below
2-10 μg/l in case of river water. The concentration range may not necessarily be the same in case of pyrethroids. However, it may indicates that the concentration levels in the artificial
ponds are low enough to assume a 1. order approximation. In case of the laboratory experiment the 1. order approximation seems more problematic due to a relatively high initial water
concentration of 33 μg/l. In the discussion of concentrations the degradation is assumed be related to microbiological degradation. Nevertheless, there are other possible degradation
pathways in form of photochemical degradation and hydrolysis and all degradation processes are assumed to be included in one effective 1. order degradation.
The model for the surface micro layer will not include degradation, because, the time period used in the calculations is relatively short (48 hours).
| Front page | | Contents | | Previous | | Next | | Top |
Version 1.0 September 2004, © Danish Environmental Protection Agency
|