|
| Front page | | Contents | | Previous | | Next |
Fate of Pyrethroids in Farmland Ponds
15 Surface micro layer, part II
Simulation conditions
The experimental data for the surface micro layer (SML) concentration as a function of time, see Figure 11.1, are used in this analysis. The equations number 13.9 to 13.11 are solved
using an explicit finite difference method and compared to the experimental data. The concentration in the water column below the SML is estimated as the registered concentration 10
cm below the surface. The SML thickness was estimated as 340 μm equal to the estimated thickness for the measurements using the Garrett screen. The value for the retention factor
(RSML) is adjusted so there is equilibrium between SML and the bulk water after several days, which gives an RSML factor value of 10. Calibration of the diffusion coefficient
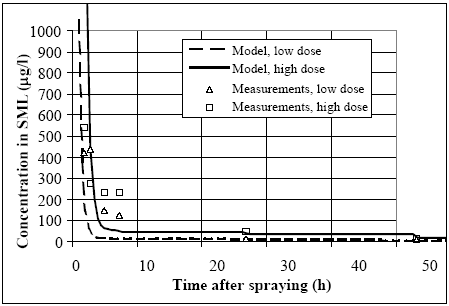
(DSML) and the 1. order volatilization coefficient (kvol) is done manually, and the result is shown in Figure 15.1.

Figure 15.1
The recorded surface micro layer concentration as a function of time and dosage compared to model calculations.
De målte overflade micro lag koncentrationen som funktion af tiden for fenpropathrin med to forskellige doseringer. Målingerne er sammenholdt med model beregningen.
Missing coincidence
In was not possible to obtain an acceptable coincidence between model and experiment also if the thickness of the SML layer was adjusted in the interval 0,1 - 1 mm, which is far
above the accepted thickness (Schwarzenbach et al., 1993, pp. 251). It was impossible for the model to simulate the dramatic decrease in concentration initially after spraying and have
some left over of substance which is slowly released during time. A series of reasons could be responsible for the missing coincidence between measurements and model calculations: (1)
the bulk water concentration at the boundary between the water column and the SML is approximated as the measurements taken 10 cm below the surface, where the first measurement
is taken one hour after spraying. This is problematic because the concentration 10 cm below the surface it not necessarily the same as the concentration immediately below the SML.
Furthermore, the first measurement is taken one hour after spraying, where there easily could have been much higher concentration in the period from spraying to one hour after spraying.
To overcome this problem the SML model should be coupled to a vertical dispersion model for the water column, but the available data are insufficient for such a complex model. (2)
The sorption characteristics within the layer is too complicated to be simulated as a single retention factor being constant within the SML. There may be an important stratification of
sorbent material in the layer, e.g. surfactants from the pesticide emulsion placed at the very top of the SML. (3) The measurement using the Garrett screen assumes that the water in the
meniscus trapped by the screen mesh is equal to the SML, which may be a rough approximation. There must be a hydrodynamic movement of water close to the mesh and that can
easily disturb the SML just before the screen breaks the surface.
More information needed
It requires more detailed investigation of the transport mechanisms and the sampling technique before deterministic models are plausible for modelling the SML contamination.
| Front page | | Contents | | Previous | | Next | | Top |
Version 1.0 September 2004, © Danish Environmental Protection Agency
|