|
Fate of Pyrethroids in Farmland Ponds 14 Sediment/water system analysis, part II
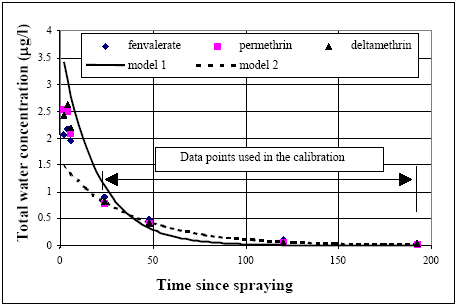
The time series of water concentration measurements are analyzed in this chapter using the models No. 1 to 8 (chapter 13.2.2). The model calibrations are performed only in relation to the concentration measurements from24 hours after application and later. Samples taken before 24 hours after application are excluded because, (1) in the early stage there are rapid time changes in the concentration values which, introduce a higher uncertainty for the data paints in the beginning of the experiment compared to later measurements. The calibration assumes the time registration to be without uncertainty and there may be some degree of uncertainty, which will be critical in the beginning of experimentation because of the initially large rate of change of the concentration values during time. The early stage can instead be used to give an overall hint of modelling performance because a backward extrapolation of the models from24 hours and back to 8, 6 and 4 hours is useful for identifying the model goodness. The realistic models will be identified using the principle in chapter 9, 14.1 Same substance, same pondEsfenvalerate, Data from pond 4 (1996 spraying) spraying for fenvalerate, permethrin and deltamethrin are used in this analysis. These three substances follow the same path and are therefore considered to be similar in the analysis. The eight possible models identified in chapter 13.2.2 are tested in relation to the experimental results. Only water column mechanisms involved The results of the analysis using model 1 and 2 are shown in Figure 14.1. Model 1 seems inappropriate to mimic the measurements because the steep drop from the initially high concentration value to the value of first data points used in the calibration (24 hours) is missing and the model 1 under estimates the concentration values at 48 hours after spraying and later.
Figure 14.1 Kalibrering af model 1 og 2 i relation til vandsøjle koncentrationen for fenvalerat og permethrin. Model 2 obviously can simulate the data rather well in the time interval of calibration but fails in the simulation of the early concentration levels by a systematic under prediction of all the measurements. Therefore, water column processes alone as described by the models 1 and 2 seems not to be able to describe the data and these models are consequently rejected. Including both water The models number 3 to 8 include both water column and sediment mechanisms and the calibration results are shown in Figure 14.2.
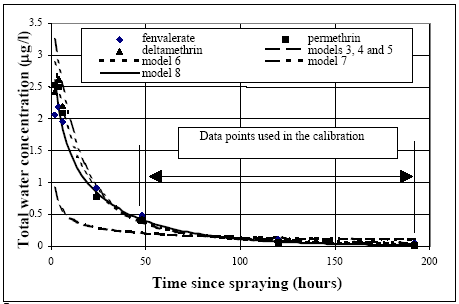
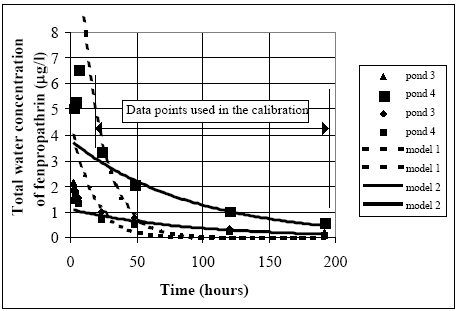
Figure 14.2 Kalibrering af modellerne 3 til 8 (alle med optag til sedimentet) til koncentrationsværdier i vandsøjlen af fenvalerat, permethrin og deltamethrin. Obviously, model 7 has some problems to simulate the concentration level decrease after 50 hours until the end of the experiments. Both the models 3, 4 and 5 fail in the very beginning of the experiment. The models which include degradation (models 6 and 8) seem to be more in accordance with the measurements. As indicated in Table 10.2., there can easily be some photo degradation in the water column or at the surface of the sediment. However, the fact that model 8, which only has degradation in the sediment, can simulate the experiments very closely makes it difficult to identify degradation in the water column. Especially model 8 can satisfy all the data points, including the data in the very beginning of the experiments. Therefore, model 8 seems to be most likely although goodness of model 8 is close to the goodness of model 6 and 7. 14.2 Same substance, different ponds14.2.1 General model testing for fenpropathrinFenpropathrin The same substance (fenpropathrin) is used in four different pond experiments as shown in Table 11.1. Only water column mechanisms involved The results of the analysis using model 1 and 2 are shown in Figure 14.3. It is impossible for model 1 on the one hand to have a large drop in the concentration value in the beginning from the spraying to the first data points used in the calibration (24 hours) and on the other hand to have relatively high concentration values after several days.
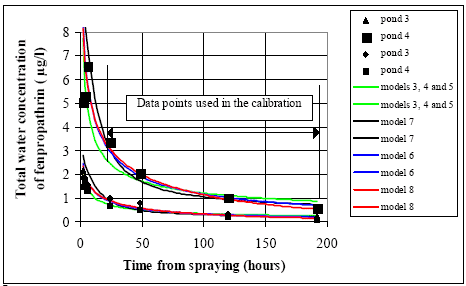
Figure 14.3 Det bedste fit for hhv. modellerne 1 og 2. Modellerne er kun kalibrerede i relation til datapunkter fra 24 timer efter udsprøjtning og senere. Model 2 can simulate the data points rather well in the interval of calibration but fails in the simulation of the early concentration levels by a systematic underestimation of all the measurements. Therefore, water column processes alone as described by the models 1 and 2 are not able to describe the data and these models are thus rejected. Including both water The models number 3 to 8 do all have sediment uptake. The calibration results are shown in Figure 14.4.
Figure 14.4 Kalibrering af modellerne 3-8 (med optag til sedimentet) til koncentrationer i vandsøjlen af fenpropathrin. In general the models including both the water column and the sediment (Figure 14.4) seem more realistic than the models only including the water column (Figure 14.3). The models 3, 4 and 5 give results so close to each other that they can be shown on the same curve. The models 4 and 5 are more complex than model 3, see Figure 13.2, so they will be rejected. Furthermore, the calibration of model 4 and 5 predict the values for both Rsus,wc and Rmacro,wc to be zero. The models 6 and 8 are also close to being similar only having small deviations. Model 7 is different from all the other models and fails in relation to the early low dosage concentration data and is not better than the other models anywhere, so model 7 is rejected. The difference between models 6 and 8 is too small to differentiate them so the question is about the difference between model 3 on one side and the models 6 and 8 on the other. In the calibration time interval above 24 hours the models 6 and 8 are slightly better than model 3 to follow the continuous decrease in concentration values. Contrary to this, in the initial period before 24 hours model 3 is best in describing the low concentration values. The influence from the degradation processes as included in models 6 and 8, will typically increase during time. Immediately after spraying the concentration gradients in the system (here at the sediment surface) are so large that they dominate the concentration change. Therefore, the degradation in this case will be small compared to the transport rate into the sediment in a period after spraying. As the time progress and the concentration gradients smooth out the transport rate decreases rapidly and the degradation may become dominating. Using this concept the following question can be asked: Have the measurements been performed over a time period long enough to assure that degradation processes become obvious. A cautious answer to this question is 'no' because relatively small differences only are observed between the models in relation to the last data points and because of the fact that model 3 is best in relation to the early low concentration series. Thus, there are no reasons for selecting the models 6 or 8 instead of model 3, which is the most simple one, see Figure 13.2, so model 3 is selected as the final model in this analysis. 14.2.2 The difference between the ponds 3 and 4 (1996 spraying)The concentration time series for ponds 3 and 4 are shown in the Figures 14.5 and 14.6 respectively.
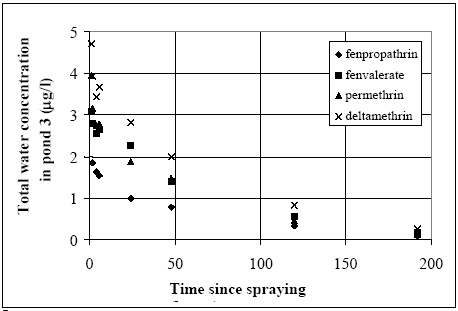
Figure 14.5 Total koncentration i vandsøjlen i vandhul 3 (1996 sprøjtning) for alle stofferne.
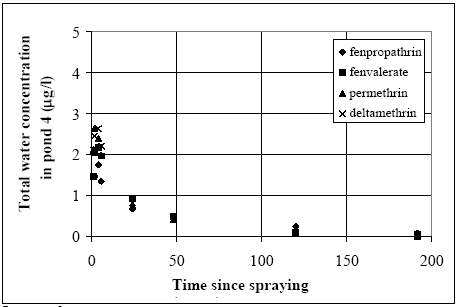
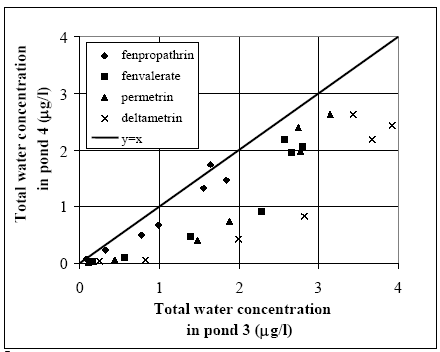
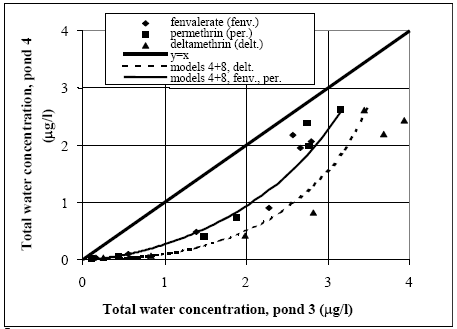
Figure 14.6 Total koncentration i vandsøjlen i vandhul 4 (1996 sprøjtning) for alle stofferne. Related concentration values (same substance and time) for the two ponds are mapped in Figure 14.7. The concentration levels in pond 3 seem higher than in pond 4 for the same substance at the same time after spraying. This tendency is most marked for deltamethrin while only a weak tendency is observed for fenpropathrin. Fenvalerate and permethrin values are found in between deltamethrin and fenpropathrin having a clear tendency of difference but not as marked as for deltamethrin.
Figure 14.7 Sammenligning mellem vandhul 3 (Figur 14.5) og vandhul 4 (Figur 14.6). Koncentrationsniveauerne i vandhul 3 synes at være højere end i vandhul 4, specielt for deltamethrin. Inversion of submeRsed snails During the test period an inversion of submersed snails (Lymnaeidae) was observed in pond 3 while pond 4 was nearly without snails. The snails in pond 3 caused the water to be
unclear and dominated the ecosystem completely. Based on the hypothesis that the snails are the reason for the difference, a mechanism has to be identified which at the same time can
be a result of the snails and also explain the difference in observed concentration levels. The snail may influence the system in a series of ways: (1) the body of the snail itself can adsorb
substance and contribute to a kind of macroscopic adsorption, (2) the snail's digestion and mechanical activity will increase the concentration of suspended fine solids and organic
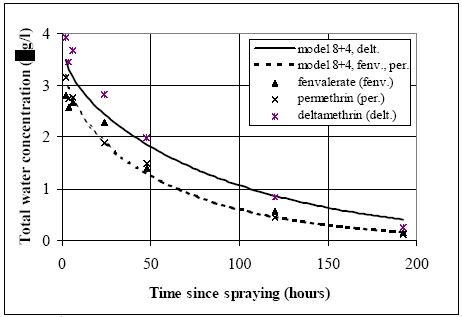
material and thereby increasing the suspension adsorption in the water column, The concentration in pond 3 (with snails) is higher than the concentration in pond 4 (without snails) which basically excludes the numbers (1), (3) and (5). Number 4 could give the highest concentration in pond 3 if the aerobic zones in the sediment was reduced due to an increase of organic matter digestion, because the anaerobic degradation normally is slower than the aerobic digestion. The number 2 hypothesis will always result in the highest concentration in pond 3 because part of the substance will be trapped in the suspension and the uptake rate to the sediment therefore reduced. The experiment was performed in June so the heavy occurrence of snails had to be relatively new, thus hypothesis number 2 seems more realistic than number 4, because some time progress is needed before sediment properties will change dramatically. Hypothesis No. 2, will therefore be further investigated and the sediment properties are assumed similar for the ponds 3 and 4 in the following modelling analysis. Fenpropathrin is not analysed in the following, because the observed difference between pond 3 and pond 4 is relatively small in that case. The substances fenvalerate and permethrin seem to follow the same path in pond 3 (Figure 14.5) and the substances deltamethrin, fenvalerate and permethrin follows the same path in pond 4 (Figure 14.6). The sediment properties (model 8) are calibrated using the concentration in pond 4 (without snails) and only the suspension adsorption may need to be added to explain pond 3 (with snails). If it is possible to make satisfactory predictions of the concentration development in pond 3 it will support a suggestion of mechanism 2. Modelling of water column adsorption The results from chapter 14.1 are used, where experimental results for deltamethrin, esfenvalerate and permethrin from pond 4 are calibrated in relation to the sediment diffusion, adsorption and degradation mechanisms (model 8). Using these sediment specific parameters, data from pond 3 are compared to model calculations by only adjusting a retention factor for adsorption to suspended solids (Rsus,wc) (models 4 and 8 combined), see Figure 14.8. The substances fenvalerate and permethrin are treated as identical because the concentration developments are following the same path in both pond 3 and pond 4, while deltamethrin is treated separately. The model can simulate most of the concentration development in Figure 14.8. The plot of related concentration values for pond 3 and pond 4 as shown in Figure 14.7 are compared with the modelling results, see Figure 14.9.
Figure 14.8 Den totale vandsøjlekoncentration i vandhul 3 sammenlignet med modelleringsresultater, i hvilke sedimentforholdene er kalibrerede til data fra vandhul 4, så den eneste forskel for modelberegningerne i forhold til vandhul 4 er indførelsen af adsorption til suspenderet stof i vandsøjlen.
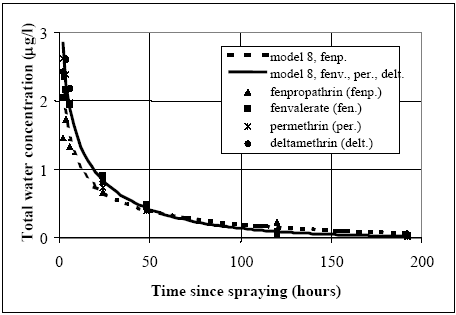
Figure 14.9 Sammenligning mellem vandhul 3 og 4 (svarende til Figur 17.7) og de tilsvarende modelsimuleringer (Figur 17.8) Based on this analysis a realistic explanation for the difference between pond 3 and pond 4 can be the adsorption to the suspended solids (or macro molecules). 14.3 Different substances, same pondFenpropathrin different from the other substance Pond 4 (1996 spraying) is analysed by comparing all four substances, see Figure 17.10. The substances fenvalerate, deltamethrin and permethrin are following the same path and the model calibration result from chapter 14.1 is used (model 8) to fit the data. There is a small but systematic deviation between fenpropathrin and the other substances. In the beginning of the experiment the fenpropathrin disappears more rapidly than the other substances although the dosage was higher (3.1 mg/m2) than the others (2.7-2.9 mg/m2). In the later stage of the experiment, on the other hand, the fenpropathrin concentration level is above those of the other substances. One explanation for this could be that fenpropathrin has a high adsorption to the sediment's solids. Different Rsed values The only difference between fenpropathrin and the other substances in Figure 14.10 is that the retention factor for fenpropathrin is higher (Rsed=1300) than for the other substances (Rsed=400). This result indicate that fenpropathrin has higher adsorption affinity to the sediment than the other substances. Same Dsed values In Figure 14.10 the values for diffusion coefficient and degradation constant in the sediment pore water are kept equal for all four substances. The argument for having the same diffusion coefficient for all substances is that the molecular weights are rather close. The difference between the substances can be estimated using the non ionic substance diffusion relationship (Swarzenbach et al., 1993, pp. 198) as (14.1)
where Dsed, 1 and Dsed, 2 are diffusion coefficients (m2/h) for substance 1 and 2 respectively, and MW1 and MW2 are the molecular weights (g/mol) for substance 1 and 2
respectively. The largest difference in molecular weight is the difference between deltamethrin (505.2 g/mol) and fenpropathrin
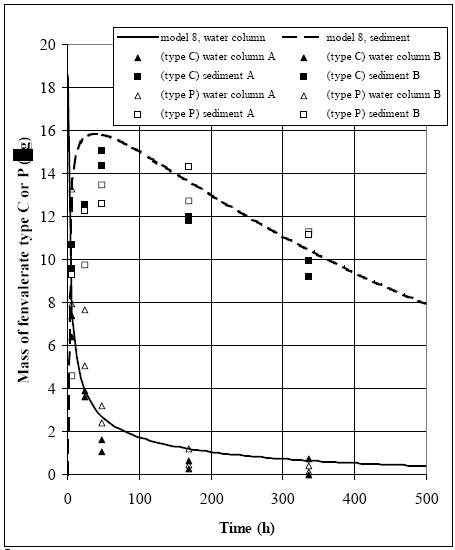
Figure 14.10 Vandsøjle koncentrationen for vandhul 4 (1996 sprøjtning), hvor model 8 er brugt til simulering. Den eneste forskel mellem de to modelsimuleringer er værdier for retentionsfaktoren (R), som er højere ved simulering af fenpropathrin sammenlignet med de andre stoffer. 14.4 Lab scale sediment/water experimentWell defined conditions In the laboratory scale experiment, done by (Morgenroth, 1992a and b), sediment and water column are sampled and measured for fenvalerate under well defined conditions (chapter 11.2), which makes it possible to deliver a complete mass balance for the water sediment system. Degradation in the sediment can be observed directly as a decrease in sediment content as a function of time after the major part has been transported from the water column into the sediment. Thus, good evidence for using model 8 (sediment diffusion/adsorption and degradation) prevails and this model is calibrated in relation to the measurements, see Figure 14.11.
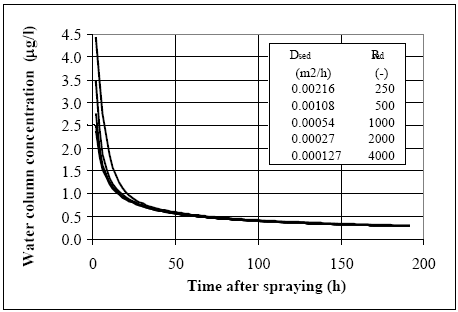
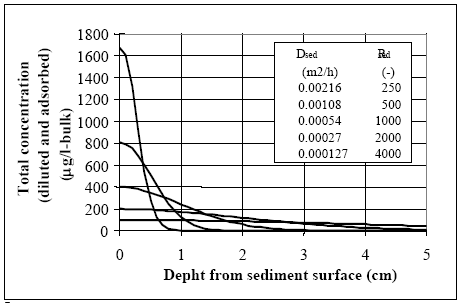
Figure 14.11 Modellering og måling af lab. skaleksperimenter for to typer af fenvalerate (type C og type P) (Mogenroth, 1992a og b) Model 8 calibration The dynamic seems reasonably described by model 8, where the parameter values are: Rsed=400, Dsed= 2.7 •10-6 m2/h and ksed=0.72 1/h. The values for Rsed and Dsed show rather close correlation so other Dsed and Rsed value combinations can fit the measurements as discussed in chapter 17.5, and therefore, the value of the retention factor (Rsed) is kept fixed at 400, equal to the values used in the ponds for fenvalerate, deltamethrin and permethrin. The organic carbon content of the sediment in the laboratory experiment were about 3.5g/100g and the total organic fraction in the ponds were around 5g/100g. So by taking the different organic matter measure into account (organic carbon veRsus total organic matter) the sediments are quite similar in relation to organic matter content. Similar R values for the laboratory and pond experiments seem therefore reasonable. 14.5 Discussion of calibrated parameter valuesDifficult to identify unrealistic parameter values The parameter values for the sediment/water system are discussed in this chapter. According to the principles lined out in chapter 9, if any of the parameter values are 'unrealistic' then the associated models are rejected as unrealistic. However, the a priori knowledge regarding the substances is limited, so, the parameter values have to be rather extreme before they can truly be judged unrealistic. The molecular diffusion coefficient of the substances depends primarily on the molecular mass (Schwarzenbach et al., 1993, pp. 198). Thus since the molecular masses of the substances are quite similar, see Table 10.1, the diffusion coefficients obviously are close. It is difficult to separate the value of the diffusion coefficient from the value of the retention factor in the sediment solely by calibrating the model in relation to water column concentrations. This is shown in Figure 14.12, where different combinations of Dsed and Rsed values are used in model 3. The product between Dsed and Rsed is the same for all the combinations and the curves are quite similar event though the actual Dsed and Rsed values have been changed dramatically. The related sediment concentration profiles (total concentration: dissolved and adsorbed) are shown in Figure 14.13. Although the profiles have different shapes, the area under the curves are nearly similar, indicating that the total amount of substance transported into the sediment from the water column is close to be equivalent, yielding nearly the same concentration in the water column. This conclusion seems to be in conflict with Eq. 13.17, where Dsed and Rsed are related to each other as a ratio and not a product as shown in Figure 14.12. Therefore, an investigation of Eq. 13.17 is performed in order to identify how Dsed and Rsed are related to each other. In this analysis, the water column concentration is assumed constant, which keeps the analytical solution of the differential equation simple, but, this constant value concentration is in conflict with the observed concentration vs. time relationships. However, the influence from the Rsed and Dsed values on the sediment uptake will be quite similar for this situation compared to the situation having decreasing water concentration values, especially, after the first rapid concentration drop. The derived equation in Appendix A (Eq. A9) predicts the flux of substance into the sediment to be a function of the product between Dsed and Rsed in accordance with Figure 14.12. Therefore, it is impossible to make a unique determination of the sediment specific parameters only based on water concentration measurements, as only the product between Dsed and Rsed comes out of the parameter calibration.
Figure 14.12 Vandsøjle koncentrationen som funktion af tiden, hvor hver kurve er beregnet med brug af forskellige værdier for diffusionskoefficient (D) og retentionsfaktor (Rsed). Produktet af de to parametre er holdt konstant og de tilsvarende beregnede koncentrations profiler i sedimentet er vist på Figur 17.13, svarende til tiden lig med 100 timer.
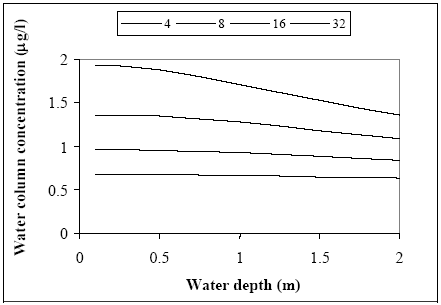
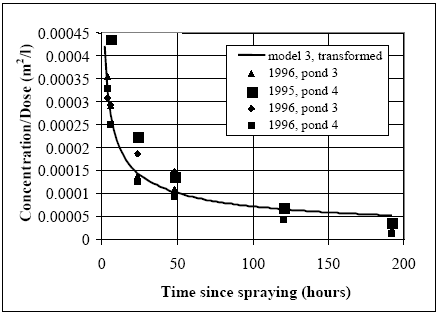
Figure 14.13 Sediment koncentrationen (total koncentration: opløst og adsorberet) profiler 100 timer efter udsprøjtning for Dsed og Rsed værdier, der vist på Figur 17.12. Profilerne er meget forskellige, men arealet under kurverne er tæt på at være ens. Calibrated parameter values The calibration results in Table 14.5 are the final parameter values from the water/sediment modelling analysis. The actual parameter values for Dsed and Rsed have to be considered with caution due to the close correlation described above. The value of the retention parameter in the laboratory test analysis is assumed fixed to the same value as the ponds, in order to be able to compare the results more easily to the pond experiments and because the sediment organic matter contents seems rather similar. The conclusion from Table 14.5 is: (1) in the pond experiment fenpropathrin showed a higher affinity to the sediment than the other three pyrethroids, (2). the laboratory test ends up with much smaller values for diffusion(Dsed) and degradation (k) than the pond experiments, which may be a result of the 1. dimensional approximation as discussed in chapter 12.2.1, (3) fenpropathrin degradation in the sediment has not been observed during the period of experimentation, which may be a result of the high adsorption to the sediment compared to the other substances and (4) in pond 3 (1996 spraying) there seems to be a retention of substances in the water column to suspended solids (and/or macro molecules) except for fenpropathrin, exhibiting a higher affinity to the sediment. The calibrated degradation values observed in the pond experiments show a rather high degradation rate compared to literature values (Table 10.2). Table 14.5 Kalibrerede Parameterværdier. De aktuelle værdier for Dsed og Rsed skal betragtes med forbehold, på grund af deres indbyrdes stærke korrelation, jvf. Figur 17.12. 14.6 Generalised time-concentration curveFenpropathrin Concentration proportional to dose The modelling results for fenpropathrin are used in this chapter since fenpropathrin is well investigated under different dosages. The experimental results can be generalised using model 3 where the Dsed and Rsed values used are taken from Table 14.5 (fenpropathrin). The numerical solution of the Eqs. 13.17 to 13.20 has been used to calculate concentration time series for different spraying dosages and the conclusion is that the water column concentration at a fixed time is proportional to the initial dose level. It may be possible to identify this proportionality directly in the parameter combinations in analytical solutions of the differential equations. However, in this investigation no analytical solution is performed because due to the boundary conditions, they are highly complicated. The proportionality between dose and concentration levels is fully demonstrated and accepted using the numerical solution method. Concentration independent on water depth The relationship between water concentration and water depth is analysed in Figure 14.14, where the water concentration is calculated as a function of water depth for some specific time values (4, 8, 16 and hours since spraying) having a dosage of 5.25 mg/m2. The influence on the concentration in the water column due to a change in water depth seems weak and after 4 to 8 hours there are nearly no influence.
Figure 14.14 Sammenhængen mellem vanddybde og vandsøjlekoncentration ved brug af model 3, der er kalibreret i relation til fenpropathrin og hvor talbenævnelsen for de enkelte kurver svarer til antallet af timer efter udsprøjtning. Koncentrationsniveauet i vandsøjlen synes nærmest uafhængig af vanddybden ca. 8 timer efter udsprøjtning. Generalised concentration/time relationship Assuming the concentration levels independent of water depth and combined with the observed proportionality between dose and concentration levels it is possible to make one curve for the specific substance covering all combinations of dosage and water depth. Such a curve is shown in Figure 14.15 for fenpropathrin together whit the measured values, where y-axis is the concentration (μg/l) divided by the dosage (μg/m2). The actual concentration value at a specific time can be calculated just by multiplying the dosage by the reading on the y-axis.
Figure 14.15 Den beregnede generaliserede (transformerede) kurve for vandsøjlekoncentrationen af fenpropathrin sammenlignet de transformerede målinger.
|
