|
| Front page | | Contents | | Previous | | Next |
Effects of Pesticides on Bombina bombina in Natural Pond Ecosystems
5 Effects of pesticides
Analysis of variation
There was significantly less variation between the cages within ponds than between ponds in all three years for metamorphosis time and weight and for growth rate in the first week but
not in the second week (table 5.1). Growth rate in the second week can therefore not be used for evaluation of pesticide effects.
Table 5.1
Statistical test (ANOVA) of variation in growth parameters of tadpoles between cages within ponds, and between ponds. Significance imply that variation between ponds was larger
than variation between cages within the respective ponds. In 1993 and 1994 there was no variation in metamorphosis time between cages within ponds and therefore an ANOVA could
not be conducted.
Statistisk test af variation i vækstparametre mellem bure indenfor vandhuller og mellem vandhuller. Signifikans betyder at variationen mellem vandhuller var større end
variationen mellem bure i de enkelte vandhuller. I 1993 og 1994 var der ingen forskel i metamorfosetid mellem bure inden for vandhuller og en ANOVA kunne derfor ikke udføres.
| |
Metamor-phosis time |
Metamor-
phosis weight
|
Growth rate
1st week
|
Growth rate 2nd week |
| 1993 |
- |
p<0.05 |
p<0.03 |
p<0.5 n.s. |
| 1994 |
- |
p<0.001 |
p<0.001 |
p<0.2 n.s. |
| 1995 |
p<0.001 |
p<0.02 |
p<0.04 |
p<0.5 n.s. |
All correlations tested
All growth and survival parameters of tadpoles in the individual years were tested for correlations with contamination of herbicides, insecticides, fungicides and pesticides. Only a few
significant correlations were found.
Survival to metamorphosis was significantly negatively correlated with contamination with herbicides in 1995 (rs=-0.781, p<0.05).
Contradictory correlations
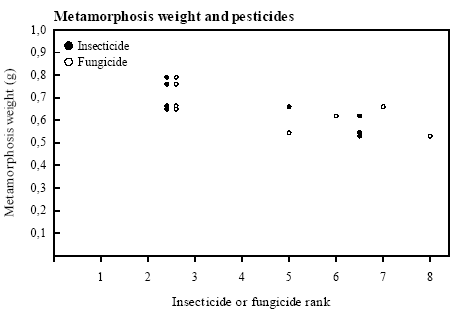
In 1993 there was a significant negative correlation between contamination with insecticides (rs=-0.869, p<0.02) and fungicides (rs=-0.741, p<0.05) and metamorphosis weight (figure
5.1). The opposite connection, a significant positive correlation between fungicide (rs=0.751, p<0.05) and pesticide contamination (rs=0.721, p<0.05) and metamorphosis weight, was
found in 1995.
In 1995 there was a significant negative correlation between survival of the small tadpoles from week 2-4 and fungicide contamination (rs=-0.835, p<0.02). In 1994 the growth rate of
tadpoles in the first week was significantly negatively correlated with contamination with fungicides (rs=-0.723, p<0.05).
Food Quality Index was not correlated with any pesticide contamination.

Figure 5.1
Spearman Rank correlations between weight at metamorphosis and insecticide (rs=-0.869, p<0.02), as well as fungicide (rs=-0.741, p<0.05) contamination in 1993. Pesticides are
ranked with the highest number assigned to the highest concentration/heaviest exposure.
Spearman Rank korrelationer mellem metamorfose vægt og insekticid-rank (rs=-0,869, p<0,02) og fungicid-rank (rs=-0,741, p<0,05) i 1993. Pesticiderne er rangordnet med
største værdi til højeste koncentration/største eksponering.
| Front page | | Contents | | Previous | | Next | | Top |
Version 1.0 October 2004, © Danish Environmental Protection Agency
|