|
Effects of Pesticides on Bombina bombina in Natural Pond Ecosystems 4 Results
4.1 Vegetation in pondsThe macrophytes in P8 died in 1995 The vegetation in most of the ponds was dominated by Sparganium erectum, Potamogeton natans, Eleocharis palustris, Glyceria fluitans, Equisetum fluviatile and Polygonium amphibium or a combination of these plants. Lemna minor dominated in P5 and Typha latifolia in P11. The vegetation in P8 was dominated by Sparganium erectum in 1993-94 but in 1995 the entire population of macrophytes died out. Excessive mortality of macrophytes did not occur in any other ponds. For further information on plant species in the ponds see appendix 10.4. 4.2 Buffer zonesThe width of the buffer zones ranged from 1 to 10 m, and the height of vegetation in the buffer zones ranged from 0.2 to 1 m (figure 4.1). In P4 and P7 the width of the buffer zone varied between years. This was in P4 caused by large variations in water level and in P7 by ploughing of the buffer zone. The width of the buffer zone surrounding P7 in 1993 is not shown because the field around P7 was fallow in 1993.
Figure 4.1 Bredde og højde af bræmmer omkring vandhullerne. 4.3 PesticidesHerbicides dominated A total of 14 herbicides but only 3 insecticides and 2 fungicides were detected in the 11 ponds. Herbicides were all together detected 61 times in eight of the nine experimental ponds (P1-P8) at concentrations up to 11.44 μg/l and once in each of the reference ponds, P10 (580 ng/l) and P11 (10 ng/l) (table 4.1). Clopyralide, ioxynil, mechlorprop and propyzamide were found at peak concentrations above 1 μg/l. The average concentration of herbicides were 662 ng/l. Insecticides Three insecticides were detected 10 times in 6 ponds (P1, P3, P4, P6, P8, P9) but only in concentrations below 500 ng/l. The average concentration of insecticides was 140 ng/l. Fungicides Only two fungicides were found a total of 14 times in 6 ponds (P1, P3, P4, P6, P8, P9). Fenpropimorph and propiconazol were found at concentrations up to 7.475 and 2.968 μg/l respectively with an average concentration of 1.235 μg/l. Table 4.1 Pesticidfund i vandhuller fra 1993-95.
1993 In 1993 large concentrations of the fungicide fenpropimorph were found in P3 and P4, 3.550 μg/l and 7.475 μg/l respectively (figure 4.2). The herbicide ioxynil was found in P6 at 1.190 μg/l coincident with 0.581 μg/l of fenpropimorph. Three insecticides were found in the ponds P3, P6 and P8 at concentrations between 115 and 130 ng/l.
Figure 4.2 Maksimale pesticid koncentrationer i vandhuller i landbrugsområder, P1-P9. Bemærk ændret skala på y-akse i 1994. 1994 In 1994, pesticides could only be detected in P8 (fields around P3, P4 and P9 were fallow). The herbicides mechlorprop and ioxynil were found at 11.44 μg/l and 1.105 μg/l respectively and the fungicide propiconazol at 2.968 μg/l coincident with other herbicides and fungicides in lower concentrations. Tribenurone was sprayed together with mechlorprop and ioxynil but the laboratories were not able to detect this herbicide. 1995 In 1995 again, very high concentrations could only be found in P8. The herbicides clopyralide and propyzamide were found at 2.160 μg/l and 2.340 μg/l, respectively. In the other ponds, only minor concentrations of herbicides were found, except for 650 ng/l of mechlorprop in P6. The insecticide pirimicarb was found in the ponds P1, P3, P4 and P9 with the highest concentration in P9 (460 ng/l). All individual measurements of pesticides are listed in appendix 10.3 and dates of spraying and dose are listed in appendix 10.1 (landowner interviews). In 1993 and 1995 the detection limits were around 10-40 ng/l, but in 1994 the detection limits were raised to 100-500 ng/l. Pesticides were only found in 1 out of 9 ponds in 1994. In 1993 pesticides were found in all 7 ponds tested and in 1995 pesticides were found in 7 out of 8 ponds tested. Test of laboratories Two identical samples from P1 (10/7-95) were sent to the laboratories on DTI (Dansk Teknologisk Institut) and MLK (Miljø- og Levnedsmiddel Kontrollen) to evaluate the precision of the measurements between the two laboratories. The insecticide pirimicarb was found at 115 ng/l by DTI and at 90 ng/l by MLK. DTI found that the concentration of the fungicide propiconazol was below the limit of detection (<20 ng/l) but MLK found 40 ng/l of propiconazol. Because the deviations were minor no further parallel analysis was conducted. Both laboratories are tested yearly by the Danish Environmental Protection Agency (DEPA). Persistence of pesticides The time from spraying to the last detection of a pesticide varied between groups of pesticides. Herbicides persisted generally much longer in the ponds than insecticides and fungicides. The herbicides propyzamide and clopyralide were found at concentrations above 2 μg/l in P8 in June 1995 about 7½ months after spraying which was done in October 1994. Other herbicides could be detected for 26 to 76 days after spraying. Except for the fungicide propiconazol, insecticides and fungicides could often only be detected until 5 days after spraying. Disappearance of pesticides from the water In a few cases the disappearance of pesticides from the water could be traced: Herbicides
Insecticides
Fungicides
A comparison of concentrations of the fungicides propiconazol and fenpropimorph in P8 in 1994 showed that propiconazol was much more persistent than fenpropimorph (table 4.2). In spite of the fact that fenpropimorph was applied at a 2.4 times higher dose than propiconazol, fenpropimorph was only found in high concentrations within a few days from spraying whereas propiconazol was still found at a high concentration 24 days after spraying. In each of the examples mentioned above either the laboratory on DTI or MLK were chosen (but not both) for analysis of the samples. Therefore the results reflect the individual persistence of the pesticides and not an effect of changing laboratories. Table 4.2 Sammenligning af koncentrationer af fungiciderne propiconazol og fenpropimorph i P8 i 1994. Propiconazol og fenpropimorph blev sprøjtet på marken omkring P8 i en blanding med forholdet 1:2,4.
Herbicides were found where they had not been sprayed Several phenoxy acids (herbicides) were detected in ponds surrounded by fields where the compounds where not used. Dichlorprop, for example, was found in 7 out of 8 ponds in 1993 in concentrations up to 341 ng/l, though only sprayed on fields around P2. 4.4 Pesticides and buffer zoneDecreasing number of findings due to buffer zone The number of pesticide findings increased significantly with decreasing width of buffer zone (rs=0.811, p<0.005) (figure 4.3). The number of analysed pesticide samples varied between ponds, introducing a possible bias. Therefore Rf/m, describing the ratio of the number of findings of pesticides in relation to the number of samples measured from the respective pond, was also tested against the width of the buffer zone (figure 4.3 and table 4.3). This ratio also correlated significantly with buffer zone width (rs=0.739, p<0.002) indicating that the correlation between number of findings and buffer zone width is true. For ponds with buffer zones >4 m the average value for Rf/m was 0.68 compared to 2.2 for ponds with buffer zones of 4 m.
Figure 4.3 Pesticidfund og ratio af pesticidfund i forhold til antal målte pesticidprøver (Rf/m) - som funktion af bræmmebredde. Ved variabel bredde af bræmme blev data for hvert enkelt år afsat mod den respektive bræmmebredde. Tendency toward decreasing concentrations with wider buffer zones There was found a weak tendency towards decreasing peak concentrations of pesticides with increasing width of buffer zones (rs=0.64, p=0.1) (figure 4.4). In ponds with buffer zones of 4 m or less, maximal concentrations of pesticides exceeded 1 μg/l in 4 out of 5 cases (table 4.3). Maximal pesticide contamination of ponds with buffer zones wider than 4 m was below 500 ng/l. However even in a pond with a buffer zone of 10 m pesticides were found. There was no correlation between findings of pesticides or maximal pesticide concentrations and height of vegetation in the buffer zone. The value given for the total number of sprayings comprises both the frequency of spraying and the number of compounds used and thus provides information on the potential risk of contamination of each pond. If three different compounds were sprayed at the same time, three sprayings were counted because three compounds may have contaminated the pond. The total number of sprayings varied considerably between ponds (table 4.3). There was no correlation either between findings of pesticides and spraying of pesticides (rs=0.507, p<0.2) or between spraying of pesticides and width of the respective buffer zone (rs=0.211, p>0.5). It was tested if there was any correlation between number of samples measured and width of buffer zone in the respective ponds. No correlation was found (rs=0.427, p=0.2). Table 4.3 Sammenligning af bræmmebredde med antal fund og maksimal koncentration af pesticider.
Figure 4.4 Pesticidkoncentration som funktion af bræmmebredde. Ved variabel bredde af bræmme blev koncentrationer for hvert enkelt år afsat mod den respektive bræmmebredde. 4.5 Population of Bombina bombina4.5.1 Population size and breedingCalling males Variation in number of calling males between years was small except in P3, P4 and P9 (figure 4.5). The populations were minor in most of the ponds and only in P2, P4 and P11 there were more than 10 calling males. In P8 there was no population of Bombina bombina. Variation in the total population of B. bombina in the ponds on Avernakø and the east coast of Fyn (except P8) between years was rather small, but the highest number of calling males was heard in 1994. The total numbers of males heard in the ponds in 1993, 1994 and 1995 were respectively 60, 65 and 55.
Figure 4.5 Antal kvækkende klokkefrø hanner og index for ynglesucces. Breeding success In 6 of the 8 ponds on Avernakø both calling males and eggs were found and natural breeding success was proved evident by metamorphosed frogs (figure 4.5). The breeding success was highly variable between years and in many cases breeding success was not apparent although calling males were heard. Only in P1, P4 and P9 there were large successful breedings with more than 100 metamorphosed frogs. The natural breeding success was much higher in 1994 than in the other years. The average score for successful breeding was 1.2 in 1994 compared to 0.5 in 1993 and 0.3 in 1995. The 5 largest successful breedings occurred in ponds surrounded by buffer zones wider than 5 m, but there was no significant correlation (rs=0.464, p<0.1, n.s.) between breeding success and width of buffer zone (figure 4.6).
Figure 4.6 Index for ynglesucces, hvert år relateret til bredden af bræmmen omkring det pågældende vandhul (rs=0,464, p<0,1, n.s.). Score 1: 1-10 metamorfoserede frøer; score 2: 11-99 metamorfoserede frøer; score 3: >100 metamorfoserede frøer. 4.5.2 Survival of adultsSurvival and cultivation Yearly survival rates of Bombina bombina older than 1 year ranged between 43 and 94 % (figure 4.7). There were only small variations in survival within localities between the different periods except for Knudshoved Odde east where the lowest and highest yearly survival were found. Survival estimates were calculated over a number of years and were related to the median year of the periods. On Avernakø, where 90 % of the area was cultivated, the yearly survival was maximally 60 %. On Hjortø and Knudshoved Odde east where respectively 51 % and 0 % of the land was cultivated, up to 93 % and 94 % yearly survival was found. On the islands Nekselø and Agersø with 40 % and 80 % cultivated land respectively, the yearly survival ranged between 62 % - 74 % and 73 % - 77 % respectively. The results indicate that yearly survival rates of adult B. bombina are generally lower in intensively arable lands than in more natural areas, such as dry and wet permanent grasslands (figure 4.8). See appendix 10.5 for more information.
Figure 4.7 Årlig overlevelse af klokkefrø ældre end 1 år på danske lokaliteter. Overlevelsesestimater er udregnet som gennemsnit over flere år.
Figure 4.8 Årlig overlevelse af klokkefrøer ældre end 1 år på danske lokaliteter som funktion af dyrkningsgrad af habitaten. Vandhuller, moser, enge, overdrev, hegn og skov er udyrkede arealer, mens landbrugsarealer med jordbearbejdning er dyrkede arealer. 4.6 Enclosure experiment with Bombina bombina4.6.1 Hatching of eggsSuccessful hatching With one exception the success of hatching was above 90 % in all ponds (figure 4.9). In P3 in 1995 the hatching success was only 47 % and it was observed that embryo development had stopped before hatching.
Figure 4.9 Klækningsprocent for klokkefrøæg. 4.6.2 Survival of newly hatched tadpolesSurvival was highly variable The survival of the small tadpoles till 14 and 30 days of age was highly variable between ponds and years (figure 4.10). In 1993, 1994 and 1995 all tadpoles died within 30 days in at least three ponds.
Figure 4.10 Overlevelse af 0 til 14 dage og 14 til 30 dage gamle nyklækkede klokkefrø haletudser. Connection to presence of predators The conditions were worst in P5 with survival ranging from 0 to 50 % from day 0-14 and 0 to 13 % from day 14-30. Only in the ponds P4, P8 and P11 survival through development above 50 % was seen in more than one year during the investigation. No significant correlations could be found between density of predators and survival of small tadpoles but in a few cases there was an obvious connection. Several small leaches were observed inside the bags in P6 and P7 in 1994 and the survival ranged from 0 to 25 % that year. 4.6.3 Growth and survival of large tadpolesGrowth and survival was highly variable The growth rate of the tadpoles was highly variable between ponds and years (figure 4.11). In P1 in 1993, in P5 and P7 in 1995 the growth rates were very low through the first week.
Figure 4.11 Vækstrate af klokkefrø haletudser de 2 første uger efter udsætning i bure. The survival of tadpoles from a size of ca. 0.2 g to metamorphosis was also highly variable with no examples of more than 50 % survival in every one of the three years (P9-P11 was only investigated in 1994-95). In P8 in 1993-94 and in P1, P2, P9-P11 in 1994-95 the survival exceeded 50 % (figure 4.12). In P1 in 1993 and in P8 in 1995 the survival was extremely low (<5 %). The average survival varied between years and the highest survival of large tadpoles to metamorphosis was found in 1994, when 63 % survived. In 1993 the average survival was 56 % compared to 48 % in 1995. No significant correlations could be found between density of predators and survival of large tadpoles. Survival and growth did not correlate Survival did not correlate with growth rate. The very low growth rate in P1 in 1993 was coincident with a very low survival. Also the extremely low growth rates during the first week in P5 and P7 in 1995 was followed by a low survival. The very low survival in P8 in 1995 occurred despite a high growth rate.
Figure 4.12 Overlevelse af klokkefrø haletudser fra en størrelse på ca. 0,2 g til metamorfose. 4.6.4 MetamorphosisNo connection between time and weight The average metamorphosis weight ranged from 0.6 to 0.8 g in most of the ponds (figure 4.13). In P3, P10 and P11 in 1994 and P10 in 1995 the metamorphosis weight was very low ranging from 0.34 to 0.40 g. The weight at metamorphosis was very high in P9 in 1994, up to 0.98 g. Time from a size of approximately 0.2 g to metamorphosis ranged between 6 and 10 weeks. No clear pattern between time to metamorphosis and weight could be found. In 1993 there was a significant negative correlation between metamorphosis weight and density of predators in general (rs=-0.830, p<0.05). A significant negative correlation between metamorphosis weight and density of the predator Hirudinea was found in 1995 (rs=-0.767, p<0.05).
Figure 4.13 Metamorfosevægt og -tid for klokkefrø haletudser i bure. 4.7 Food Quality IndexVariation of FQI between ponds The variation in the abundance and diversity of food sources for the tadpoles, denoted as Food Quality Index (FQI), was small between years but very large between ponds (figure 4.14). The FQI was extremely low in P3 in 1994 and in P8 in 1995 with only a thin epiphytic layer of a few algae species and no Leptothrix bacteria or protozoa. In P2, P6 and P9 the FQI was above 7 in both 1994 and 1995 and the tadpoles could feed on a very diverse and thick layer of algae, Leptothrix bacteria and protozoa. In 1994 the FQI was not sufficiently described in the ponds on the east coast of Fyn (P8, P10-P11). The abundance and diversity of potential food sources for the tadpoles are described in detail in appendix 10.8. Thick coverings of sulphur bacteria was found in P5 in 1993, in P5, P6 and P9 in 1994 and in P2, P5, P6, P8 and P9 in 1995.
Figure 4.14 Food Quality Index: mængde og diversitet af potentielle fødekilder for klokkefrø haletudser. Correlation with growth parameters There was a tendency towards positive correlation between FQI and the average metamorphosis weight pr individual in 1994 but not in 1995 (1994: rs=0.734, p<0.1; 1995: rs=0.049, p>0.5) (figure 4.15). The total biomass of metamorphosed frogs from each pond includes both growth and survival and can therefore describe the capacity of the pond to support production of frog larvae. FQI was positively and significantly correlated with the total metamorphosed biomass in 1994 but not in 1995 (1994: rs=0.874, p<0.05; 1995: rs=0.558, p>0.05). The average specific growth rate of the tadpoles in the first 2 weeks did not correlate with FQI in 1994 (rs=0.383, p<0.5) but in 1995 there was a positive significant correlation (rs=0.628, p<0.05). Survival to metamorphosis was significantly positively correlated with FQI in 1995 (rs=0.754, p<0.05) but not in 1994 (rs=0.199, p>0.5). Growth may depend on FQI Although growth variables were only significantly correlated to FQI in 3 out of 8 cases, rs - values were always positive, indicating that growth may have been dependent on abundance and quality of food sources.
Figure 4.15 Spearman Rank korrelationer mellem Food Quality Index og A: Metamorfose vægt, 1994: rs=0,734, p<0,1, n.s.; 1995: rs=0,049, p>0,5, n.s. B: Total biomasse af metamorfoserede frøer, 1994: rs=0,874, p<0,05; 1995: rs=0,558, p>0,05, n.s. C: Specifik vækstrate af haletudser, 1994: rs=0,383, p<0,5, n.s.; 1995: rs=0,628, p<0,05. 4.8 Water temperature and water levelNo correlation with growth parameters Average maximum temperatures ranged from 18.4 °C to 23.6 °C in 1994 (May to June) and 18 °C to 25.3 °C in 1995 (June) (appendix 10.9). Maximum temperatures of 30 °C was reached in a few ponds. In 1994 and 1995 the influence of temperature on metamorphosis weight and time, growth rate and hatching of eggs was tested. No significant correlations were found. Low water level in P8 each year In some cases the ponds were close to dry out too early and it was not possible to keep the water level in the cages at 30 cm (figure 4.16). This happened every year in P8, where the water level sank to 10 cm during the last 2 weeks of the experiment. At the end of the experiment in 1993 the pond P4 was too small too maintain a water level of 30 cm in both cages. In P9 the water level was down to 20 cm at the end of the experiment in 1994.
Figure 4.16 Vanddybde i bure.
Signature to pond drawings. 4.9 Summing up of resultsIn this section a brief summary of data and results from the ponds are given. Drawings of the ponds and surroundings are included to the left of the descriptions of the ponds. P1
Pond P1 In 1993 growth and survival of large tadpoles were very low. In May a thick epiphytic layer consisting mostly of cyanobacteria covered the net of the cages and all higher plants in the pond. In 1993 more fertiliser was supplied to the surrounding field than recommended by the agricultural advisor. Survival of the small tadpoles was average in 1994 and 1995. In 1994 and 1995, when detailed microscope investigations were made, both abundance and diversity of algae, protozoa and bacteria and the growth rate, survival and metamorphosis weight of the tadpoles were average. Natural breeding occurred with success in 1990, 1991, 1994 and 1995. The buffer zone was 6.7 m wide and the area of the pond was about 750 m2.
Figure 4.17: Vandhul P1 i 1995. Billede taget fra sydvest. P2
Pond P2. In this pond the growth of the tadpoles was good and stable in all three years, and in 1994-95 the Food Quality Index was very high. Survival of small and large tadpoles was good in 1994-95 but in 1993 the survival of large tadpoles was low. The average metamorphosis weight was high and stable during the investigation. Natural breeding success occurred from 1990-94. The buffer zone was 9.3 m wide and the area of the pond was about 170 m2.
Figure 4.18 Vandhul P2 i 1992. Billede taget fra vest. P3
Pond P3. The small tadpoles survived very well in 1993, at average in 1994 but in 1995 all died after the second week. The growth and survival of the large tadpoles were lower than the average value. The Food Quality Index was very low in 1994 but high in 1995. The Average metamorphosis weight was more than doubled from 1994 to 1995. Natural breeding success was not observed in 1993-95 but was seen in 1990 and 1991. A peak concentration of 7.475 g/l of fenpropimorph was found in 1993 at the day of spraying (12th of June) which coincided with the cage experiment. The buffer zone was 4 m wide and the area of the pond was about 940 m2.
Figure 4.19: Vandhul P3 i 1995. Billede taget fra sydøst. P4
Pond P4, 1993. None of the small tadpoles survived in 1993. The pond was then rather small (140 m2) with a narrow buffer zone (2.5 m). The survival of small tadpoles was good in 1994-95. This time the pond was large (1,050 m2) and the buffer zone wider (5.5 m). The survival of the large tadpoles decreased from an average level in 1993 to below average in 1995. The Food Quality Index was rather good in 1994-95 and the tadpoles grew very well from 1993 to 1995. Natural breeding success occurred in 1994 and 1995, but not from 1990 to 1993 when the water level was low and the area covered by water was less than 150 m2.
Pond P4, 1995.
Figure 4.20 Vandhul P4 i 1993. Billede taget fra øst. P5
Pond P5. In all three years the survival of the small tadpoles was very low. The growth rate of the large tadpoles was good in 1993 but in 1994 and 1995 it was very low during the first week. In all years the tadpoles ended on an average metamorphosis weight. The Food Quality Index was low in 1994-95. Thick coverings of purple sulphur bacteria were found each year and this was the only pond where Lemna minor was dominating. The pond received drainage water from 2-3 hectares of farmed land through an inlet. Successful natural breeding was not observed in 1993-95. The buffer zone was 4.2 m wide and the area of the pond was about 170 m2.
Figure 4.21 Vandhul P5 i 1996. Billede taget fra vest. P6
Pond P6. Growth and survival of both small and large tadpoles were good in 1993 and 1995 but in 1994 no small tadpoles survived and the growth rate and survival of large tadpoles were at an average level. Low survival of small tadpoles in 1994 coincided with the presence of several small leaches inside the bags. In 1993 and 1995 no leaches were observed inside the bags. Survival of the large tadpoles in 1993 was good even though 115 ng/l of fenvalerate, 581 ng/l of fenpropimorph and 1.19 g/l of ioxynil were found the 1st of June, 2 weeks after spraying. The buffer zone was only 2.2 m wide and the area of the pond was about 640 m2. The Food Quality Index was high and the metamorphosis weight was average. Successful natural breeding occurred in 1994 and 1995.
Figure 4.22 Vandhul P6 i 1995. Billede taget fra sydvest. P7
Pond P7, 1994. The survival of the small tadpoles was low in 1993 and 1994 but good in 1995. In 1994 several small leaches were observed inside the bags but not in 1993 and 1995. The growth rate of tadpoles ranged from average in 1993-94 to low in 1995 when also very low survival occurred. The Food Quality Index was fairly high. Natural breeding was successful in 1994. The field surrounding P7 was fallow in 1993 but in 1994 and 1995 the field was farmed with a buffer zone of 9.2 m and 4 m respectively. The area of the pond was about 300 m2.
Pond P7, 1995.
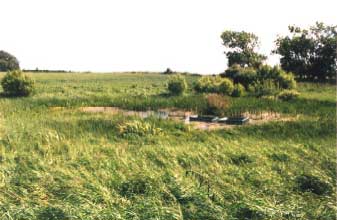
Figure 4.23 Vandhul P7 i 1990. Billede taget fra sydvest. P8
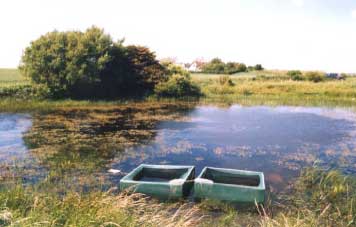
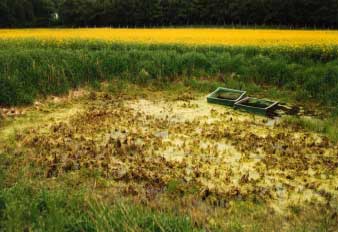
Pond P8. The highest concentrations of herbicides was found in P8 in 1994 where mechlorprop reached 11.44 μg/l. In 1995 the herbicide concentrations was again high with more than 2 μg/l of clopyralide and propyzamide. It was also noticed that the tractor tracks in the field was so close to the margin of the pond that pesticides could have been sprayed straight across the pond. No damage to higher plants was noticed in 1994 but in 1995 the dominating population of Sparganium erectum was dead and was replaced by mats of filamentous algae, covering the entire surface of the pond. The buffer zone was only about 1 m all years and the area of the pond only about 50 m2. The survival of the small tadpoles was good in 1993 and 1994 but in 1995 all died. The growth rate of the large tadpoles was at an average level. The large tadpoles survived very well in 1993-94 but in 1995 only 1 out of 40 tadpoles survived to metamorphosis. In 1995 the Food Quality Index was extremely low. Natural breeding could not take place, because Bombina bombina is extinct in the area.
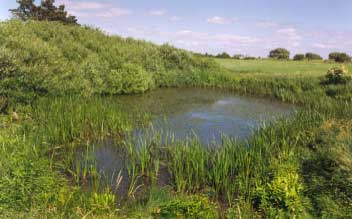
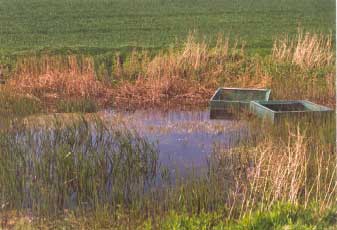
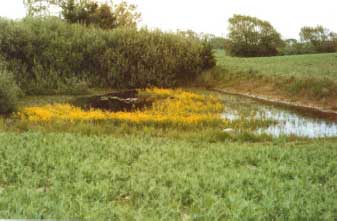
Figure 4.24 Vandhul P8 i 1993. Billede taget fra vest.
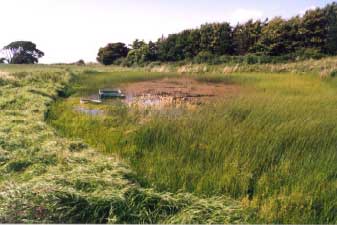
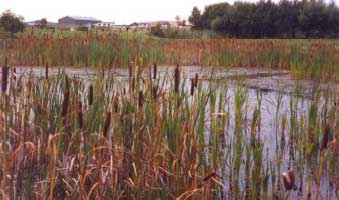
Figure 4.25: Vandhul P8 i 1995. Der blev fundet høje koncentrationer af herbicider i 1994 og 1995 og Sparganium erectum døde i 1995. Billede taget fra nord. P9 
Pond P9. Both in 1994 and 1995 the survival of the small tadpoles was very low. On the other hand growth and survival of the large tadpoles was very good and the average weight at metamorphosis was very high. The Food Quality Index was very high from 1994-95, including a very large amount of rotifers and Vorticella. As in P5 large coverings of purple sulphur bacteria appeared. There was successful natural breeding in 1994 coincident with flooding of the 10 m wide buffer zone. The area of the pond was about 80 m2.
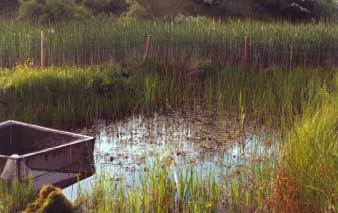
Figure 4.26 Vandhul P9 i 1995. Billede taget fra nordvest. P10 
Pond P10. The survival of the small tadpoles was at average but growth and survival of the large tadpoles were good. The Food Quality Index was medium in 1995.
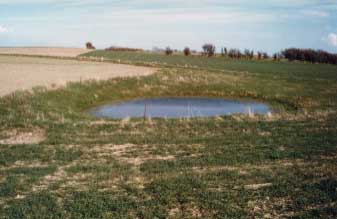
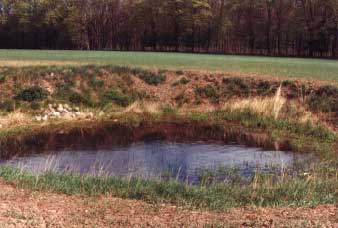
Figure 4.27 Vandhul P10 i 1993. Billede taget fra sydøst. The average weight at metamorphosis was low. There was successful natural breeding in 1993-95. The area of the pond was about 40 m2 and the pond is situated in a camping site. P11
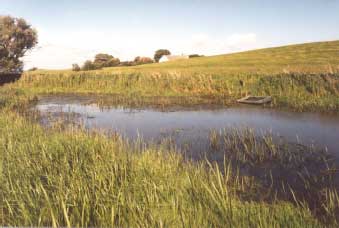
Pond P11. The survival of small tadpoles was average but growth and survival of the large tadpoles were good. The Food Quality Index was medium in 1995. The weight at metamorphosis was low in 1994 but average in 1995. Successful natural breeding occurred in 1993. Nine-spined sticklebacks entered the pond in 1994 and in 1994-95 no breeding occurred. In 1996 the pond was emptied and the sticklebacks were removed with nets. Hereafter breeding was again successful. The pond is situated in a grazed meadow. The area of the pond was 1,100 m2.
Figure 4.28 Vandhul P11 i 1993. Billede taget fra sydøst.
|