|
Effects of Pesticides on Bombina bombina in Natural Pond Ecosystems 3 Methods
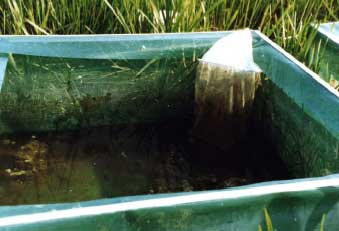
3.1 Field work programmeThe investigation was conducted from May to July 1993-95. All ponds on Avernakø (P1-P7, P9) were monitored intensively every seventh day. The ponds on the east coast of Fyn (P8, P10-P11) were monitored every seventh day in the first 2 weeks of the enclosure experiment and every 14-21 days thereafter. 3.2 EnclosuresCages Bags Experiments with eggs and tadpoles of Bombina bombina were conducted in two types of enclosures, cages and bags (table 3.1). The cages were made of an aluminium frame coated with a net of fine-meshed nylon (1 mm) and measured 1.25x1.25x0.6 m (figure 3.1). The cages were partly submerged in the ponds (<40 cm). The net both retained the tadpoles and assured a good exchange of water between pond and cage. In 1993 and 1994 the bags were made of large-meshed nylon (1x1 mm mesh width) but in 1995 bags of fine meshed nylon (mesh width<0.1 mm) were used in all ponds and, as control, the large-meshed bags were still used in 2 ponds. The bags were cylindrical with a diameter of 30 cm and a height of 50 cm (volume 35 l). The bags were submerged in the cages. Table 3.1 Program for forsøg med bure og poser. Antal bure i hvert vandhul og maskestørrelse på poser, L: stormasket nylon net, F: finmasket nylon net.
In 1994 and 1995 the experiments were conducted in all ponds but in 1993 the cages were only used in P1-P8 and the bags were only used in P3-P8.
Figure 3.1 Bur og pose brugt til æglægning, klækning af æg og til forsøg med vækst og overlevelse af haletudser. Predators removed Specimens of large predators appeared regularly in the cages. All larger predators such as Dytiscidae, Odonata and Hirudinea were removed by emptying the enclosures at every visit. The predators were identified and counted. All Lemna sp. and filamentous algae were removed from the cages at every visit. 3.3 Vegetation and buffer zoneArea of vegetation and buffer zones were measured In 1994 the ponds were drawn to scale, with the exact proportions of vegetated/non vegetated zones in the ponds and width and height of buffer zones. A zone of at least 180 ° of the buffer zone being without trees and bushes and with the shortest distance to the field was chosen for calculation of the average width of the buffer zone. The areas of the vegetation zones and buffer zones were estimated with a planimeter (Ushikata x-plan 360 cl). The vegetation in the buffer zones was not described. The dominating vegetation in the ponds were identified to individual species. In 1995 the distribution of vegetation zones was measured relative to the 1994 zones, and the 1994 maps were modified, according to the changes in vegetation. For the year 1993 the vegetation zone was extrapolated from 1994 maps, schematic drawings, notes and pictures from 1993. 3.4 Population of Bombina bombina3.4.1 Population size and survival of adultsCalling males Calling males were used as an indicator of the population size of Bombina bombina. Calling males were counted on warm sunny days in May or June. The males were first located by listening and finally individual males could be counted by means of binoculars. Adult B. bombina were caught on Avernakø in P1-P7 and P9 with a dip-net under good weather conditions from late April to early July to register as large a percentage of the population as possible by photographs of the frogs' belly pattern. Adult survival The results gathered from photographs of belly patterns were used to calculate the yearly survival of adult frogs. All survival data were calculated over a number of years. In year x a number of individuals in the population were photographed. A capture-recapture estimate was calculated in year x+y based on frogs photographed in year x. The method used is a simple Lincoln-index modified for survival calculations (Briggs 1993). A large proportion of the population (>50 %) must be caught in each round to obtain a reliable estimate. Survival data of Bombina bombina collected over a 10 year period in Fyn and West Zealand counties were used in this investigation. The data from Fyn (Hjortø, Avernakø) and Knudshoved Odde (east and west) were collected by Lars Briggs. Data from West Zealand was collected by Ditte Guldager Christiansen and Erich Wederkinch. The counties and persons involved kindly allowed these data to be used. 3.4.2 Breeding successTo monitor breeding success, tadpoles were registrated in July, and in August or September the number of metamorphosed frogs was counted in each pond. Breeding was not investigated in ponds where no calling males were heard. 3.4.3 Eggs for experimentsFertile males and females were caged until after spawning Fertile males and females were collected in late April each year, and females ready to spawn were put together with fertile males in the cages. It is very difficult to find Bombina bombina eggs in ponds and therefore it was necessary to use the cages to ensure that a sufficient amount of eggs were available. Within a few days eggs were collected from the enclosures and were used for further experiments. 400-650 eggs were collected each year Each year around the 20th-25th of April, 300-500 eggs were collected from 1-2 females on Avernakø. This was enough to raise 280-320 tadpoles for the experiments with growth and survival of tadpoles in the 8 ponds on Avernakø (P1-P7 and P9). In addition approximately 100-150 eggs were collected from one female on the east coast of Fyn, enough to raise 60-100 tadpoles for the experiments concerning growth and survival of tadpoles in P8, P10 and P11. From the 20th of April to the 20th of May several hundred eggs were collected from several females for the experiment on hatching of eggs. 3.5 Experiments with Bombina bombina3.5.1 Hatching of eggs and survival of small tadpolesEggclusters gathered from the enclosures were placed in the bags in the cages. The original egg number was determined at the beginning of the experiment and thereafter the number of hatched, remaining and dead eggs were noted every seventh day. As soon as all living eggs were hatched the survival of the small tadpoles was monitored. The experiment was terminated after one month at which time the tadpoles weighed approximately 0.2 g. 3.5.2 Growth and survival of large tadpolesRearing of tadpoles Eggs gathered from the enclosures were hatched and the tadpoles reared in an indoor aquarium. When the tadpoles had reached an almost equal weight of about 0.2 g, 20 tadpoles were transferred to each cage in all ponds (only P1-P8 in 1993).
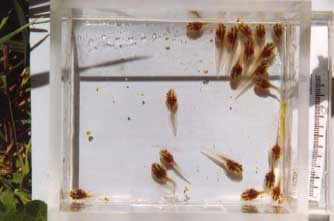
Figure 3.2 Klokkefrøhaletudser brugt til undersøgelser i bure Growth of tadpoles Every seventh day the tadpoles were weighed individually and photographed and the number of dead or missing tadpoles was recorded. Tadpoles were caught with a net, transferred to a small sieve, and excess water removed by gently touching the sieve with blotting paper. The tadpoles were after wards weighed in a container filled with water on a digital field weight. To measure growth in length the tadpoles were placed in a glass aquarium with length marks on the side and then photographed. The weight at metamorphosis and the time needed to reach metamorphosis were also registered. Growth of the tadpoles was calculated from equation 3.1:
where The method was tested with success by Andersen (1992). 3.6 Sampling and analysis3.6.1 PesticidesSampling of surface water Detection limits Water samples for pesticide analysis were taken from the ponds P1-P9 every seventh day during a period of 2 months. The samples were carefully taken from the top 0.5 cm surface layer of the water column in an open water area about 2 m from the margin of the pond. The sample bottles used were 1 and 2 l Pyrex or Duran glass bottles. Immediately after sampling, the bottles were stored in a freezer at -18 °C until they could be analysed for pesticides. The samples were analysed at two laboratories: MLK FYN, Odense (Environment and Food Agency) and DTI, Copenhagen (Danish Technological Institute). One sample from 1995 were sent to both laboratories for parallel analysis. In 1993 and 1995 the detection limits were around 10-40 ng/l but in 1994 the detection limits were 100-500 ng/l. Since the investigators were in weekly contact with several of the farmers, it was possible to get spraying information during the growing season. When information about pesticide application during the growth season was available, additional samples were taken shortly after spraying. 3.6.2 Food Quality IndexEpiphytic growth Epiphytic coverings of algae, bacteria, rotifers and protozoa in the ponds were described in 1994 and 1995. In 1993 only a few identifications were made. Plastic sheets were placed vertically in the water in the cages (2 sheets) and in the ponds (1 sheet) to study the thickness of the coverings and the composition of species of the epiphytic growth. Samples for analysis of dominating species of algae, Leptothrix bacteria and protozoa were taken every seventh day from these sheets. The samples were immediately analysed under a microscope and subsequently preserved in lugol for further examination later. In addition stems of macrophytes were collected, analysed and preserved as described above for analysis of epiphytic coverings. Identification The algae were identified to individual species. Leptothrix bacteria and sulphur bacteria were identified and the protozoa recognized as Vorticella, amoeba or Paramecium. Rotifers were only identified as a group. From the diversity and abundance of these organisms a score for the amount and quality of food sources for the tadpoles, the Food Quality Index, was assigned to each pond in 1994 and 1995. Food Quality Index The Food Quality Index was based on the following:
The Food Quality Index score was created by an addition of points based on the scheme in table 3.2. Table 3.2 Food Quality Index point system til beskrivelse af epifytisk vækst i vandhuller.
3.6.3 Water temperature and water levelMaximum and minimum temperatures were measured at 20 cm depth, which is the depth where the eggs of Bombina bombina are deposited and where the tadpoles live. The water level in the enclosures was also noted at every visit. 3.7 Landowner interviewUse of pesticides and fertilizer Farmers were well known The investigators had no influence upon the spraying regime of pesticides on fields surrounding the ponds. Information concerning use of specific pesticides and fertilizers was collected from the respective landowners every year after harvest. The landowners filled out a form about their use of pesticides and fertilizer around each pond and were also interviewed to ensure the precision of the data. In that way the exact dates for spraying of pesticides and distribution of fertilizer as well as the specific amount were known. The investigators have been in contact with these landowners for a number of years before this investigation, due to previous agreements between farmers and investigators about dredging of ponds. 3.8 StatisticsSpearman Rank analysis All statistics were done using Spearman Rank correlation analysis (Zar 1984). Ranking of data The ponds were ranked with the increasing rank to increasing exposure to pesticides. The highest ranks were given to ponds in which pesticides were detected. Pesticides could not always be found in ponds after spraying. The reason might be that the pond was not contaminated, lack of methods or low persistence of the specific pesticide in the environment. The medium rank values were given to ponds according to the number of pesticides used and times used, even if the pesticides were not detected. The investigators chose to assign ponds where pesticides were used but not found a medium rank value because of the potential risk of contamination. When pesticides were not used on fields surrounding a pond nor found in the samples, the pond was assigned the lowest rank. All herbicides, insecticides and fungicides were treated as having the same effect on the ecosystem. The knowledge concerning toxicity on ecosystem level of the various pesticides used in this investigation is limited. Therefore a more detailed ranking system was not possible. Examples of ranking The rank of herbicide, insecticide and fungicide in 1993 was based on the data in table 3.3. The data in table 3.3 were ranked from 1 to 8 (table 3.4). In the following an example of how the data were ranked is given. The example given concerns contamination with insecticides in 1993. In P3, P6 and P8 the maximum concentrations of insecticides were almost equal, 115-130 ng/l. Therefore all three ponds received the same rank, 7 instead of being ranked 6, 7 and 8. In the fields around P4 an insecticide was used but not detected in the pond water. Pond P4 was therefore given an intermediate rank value of 5, because of the potential risk of the pond having been contaminated without detection of the insecticide. Ponds, where insecticides were not used nor found in the samples, were all ranked equally low with the value 2.5 as a mean of the values 1, 2, 3 and 4. Estimation of rank An attempt was made to rank the pesticide exposure without the use of pesticide measurements but only based on the number of pesticides used multiplied by the times the pesticides were sprayed. The resulting rank was almost identical with the rank presented above. For none of the ponds the ranks deviated more than 1 point between the two methods. Growth and survival data were ranked according to the numerical values. The Food Quality Index was ranked as described in chapter 4.5. Table 3.3 Pesticidbelastning i 1993. Øverst i tabellen ses maksimum koncentrationer af pesticider. Den midterste del af tabellen viser vandhuller, der potentielt var eksponeret for pesticider, men hvor ingen pesticider blev fundet i vandprøverne. Den nederste del af tabellen viser vandhuller hvor pesticider ikke blev brugt på de omkringliggende marker og heller ikke blev fundet i vandprøverne.
Table 3.4 Vandhuller rangordnet i henhold til pesticid belastning i 1993. Summen af point for herbicider, insekticider og fungicider er brugt til at rang-ordne vandhullerne i henhold til den generelle pesticidbelastning.
|
|||||||||||||||||||||||||||||||||||||||||||||||||||||||||||||||||||||||||||||||||||||||||||||||||||||||||||||||||||||||||||||||||||||||||||||||||||||||||||||||||||||||||||||||||||||||||||||||||||||||||||||||||||||||||||||||||||||||||||||||||||||||||||||||||||||||||||||||||||||||||||