|
Environmental Project no. 977, 2005 Survey of Estrogenic Activity in the Danish Aquatic EnvironmentContents
2 Strategy and design of the study
4 Pre-monitoring tests and quality assurance
1. Pre-survey testing of procedures and equipment 3. In-vitro test - yes assay standard curves 4. Quality assurance data for yes assay and chemical analysis 5. Steroid estrogens versus estrogenic activity 7. Locations and sampling scheme PrefaceThe Danish Environmental Protection Agency has had a series of projects carried out since first addressing the issue of hormone disruption in the 1995 workshop on Male Reproductive Health and Environmental Chemicals with Estrogenic Effects (Environmental project no. 290). Most recent activities include the projects on Feminisation of fish, an Evaluation of in vitro methods for the determination of estrogenic effects, an evaluation of chemical analysis, a study on degradation and sorption of estrogens, and an evaluation of the occurrence of xenoestrogens and estrogens in wastewater. The present Survey of Estrogenic Activity in the Danish Aquatic Environment was tendered in the fall of 2003 and awarded to a Consortium of four Danish institutes and companies: the Department of Environment and Nature of the consulting company COWI (lead), the Environmental Chemistry Department at the Danish University of Pharmaceutical Sciences, the Ecotoxicology group at the University of Southern Denmark and the Analytical Laboratory Eurofins Denmark. The division of labour and the participants in the study were as follows:
The study was carried out from December 2003 to December 2004, and it was steered by a Committee with the following members: Danish Enviromental Protection Agency: Danish Medicines Agency: Steen Kristensen COWI: Frank Stuer-Lauridsen (project manager), Jesper Kjølholt. The Steering Committee members have provided valuable guidance and information in the course of the project, and are thanked for the contribution. Also a great number of individuals in the county administrations, at the municipal waste water treatment plants and local property owners have assisted significantly to the survey by identifying the proper sites and provide the sampling team with access to the nearly 150 locations. The great efforts provided to the study are highly appreciated. Summary and conclusionsSmall, traditional wastewater treatment plants do not remove estrogens The survey of estrogens in the Danish freshwater environment shows that modern treatment plants remove estrogens from waste water very efficient, and that this also applies to sand filters. In contrast, the simple treatment plants have very low removal efficiency. This type of treatment plants are most common in the countryside, where septic tanks also will contribute with waste water of low treatment quality regarding estrogens. In streams and lake without direct point sources the levels of estrogen activity are less than the levels causing hormone disruption in fish, whilst in the water bodies receiving waste water concentrations above 1 ng/L are twice as frequent. Why was this study initiated? Concern was raised regarding the water quality when in 2000, a Danish field study showed up to 44% hormone disruption in populations of trout and roach in selected water bodies of the County of Århus. A follow-up study in the Voel Bæk stream revealed that the observed anomalous sexual development in the trout population should be attributed not only to the localWWTP, but also to two field drains receiving untreated sewage from single farmhouses. A preliminary survey in 2002 of the contents of steroid hormones in Danish WWTPs effluents showed that steroid estrogens could be identified in effluents from 15 out of the 19 investigated plants. International studies have suggested that the major contributors to hormone disruption are the estrogen hormones rather than industrial manmade substances called xenoestrogens. This was confirmed in a limited Danish study in two WWTPs which revealed that the steroid estrogens could account for far more estrogenic activity than the analysed xenoestrogens; 80-94% and 90-95%, respectively. The Danish EPA therefore wished to initiate a comprehensive study of the sources of and levels of estrogenic activity in the Danish freshwater environment using a biological screening methods and a chemical anlysis programme focusing on the steroid estrogen hormones: estrone, estradiol and ethynylestradiol.
The survey The survey included a total of 341 samples from 148 locations in the Danish freshwater environment including a range of possible pollution sources. All samples were analysed by the biological assay for both free estrogens and total (see Box 2 on conjugation) estrogens giving a total of nearly 700 data sets. In addition, approx. 150 samples were analysed chemically for free estrogens and total (deconjugated) estrogens. Thus, the complete survey comprises almost 1000 data sets from 18 environmental or source-related categories. Selected locations and effluents points were sampled 2-4 times over the year of the study and some locations were sampled up and downstream of effluent points. All samples were tested with the biological test for estrogenic activity, the YES assay, and approx.40% were analysed with chemical methods (GC-MS) for the three steroid estrogens shown in Box 1. Box 2: Conjugation. Estrogens are very fat soluble and cannot be effectively eliminated from the body with the urine unless they are chemically changed by the kidneys. This is called conjugation and involves the attachment of a water soluble molecule either (glucoronide or sulphate). The conjugated form has no estrogenic activity Once excreted the process can be reversed in the WWTP or the environment and the free active estrogen is formed again. In the study the conjugated estrogens are found as the difference between free and total estrogens. Conclusions The results indicate that there is no widespread impact from estrogens in the Danish freshwater environment. However, downstream discharges of poorly treated wastewater to small receiving water courses, or in case of overflow episodes, the resulting environmental concentration will probably exceed effect levels known from the scientific literature. In 33% of the samples from the aquatic environment the estrogenic activity if present was below the limit of detection, LOD (= 0.05 ng/L). However, low estrogenic activity is found with the YES assay in almost all types of freshwater environments in Denmark, but typically at concentrations lower than 1 ng/L. In almost 70% of the water courses receiving effluents from WWTPs the level of estrogenic activity immediately downstream the discharge point was higher than the upstream activity. Further downstream of the discharge point the estrogenic activity had decreased back to pre-discharge level. In the affected section of receiving water bodies the estrogenic activity was between one and five ng/L corresponding to 5-10 times the levels in background samples. Results For every sample two results from the YES assay exists (free and total estrogenic activity), and for the samples on which chemical analysis are performed, the four estrogen species are determined with and without enzymatic treatment. The results of all field samples are shown in Figure 1. Figure 1 A-D Presentation of all bioassay and chemical results for measurement of the total concentration of estrogens. Based on results in ng E2 equivalents/L. Influents Two to four influents in each WWTP category were sampled and the average estrogenic activity ranged from 20-90 ng/L. Most of the conjugated estrogens had already lost their conjugates since more than 90% of the estrogens were detected as free. The quantitatively dominating steroid estrogen in wastewater is estrone followed by 17β-estradiol, for which the influent concentrations in this study are typically 20-30% of the total. The typical hormone in anti-contraceptive pills ethynylestradiol occurs in more than half the influents, but in modest concentrations. Effluents At the modern(ised) WWTPs in categories A and B, activated sludge systems are installed for removal of nitrogen by nitrification/denitrification or nitrification only (MBND and MBN plants; Cat. A and B, respectively). The estrogen levels in the effluents from these plants are only a few ng/L, as appears from the tables, and in a few cases in Cat. A, the levels are even below the detection limit. Also, the simpler treatment technologies such as reed beds and biological sand filters perform well, in particular the latter (Cat. F) for which only one out of five effluent samples contained quantifiable levels of estrogenic activity.
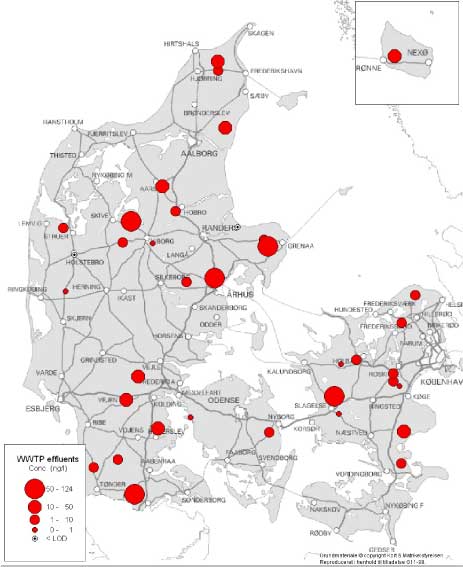
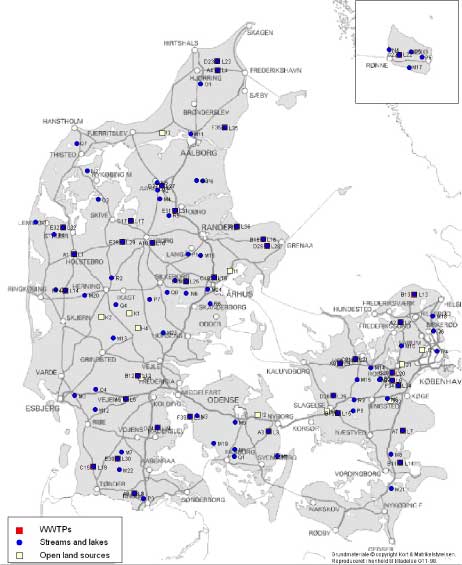
Figure 2 Map of the localisation of the WWTPs with indication of the estrogenic activity in their effluents. For the 12 WWTPs where more than one effluent sample were taken, the mean concentration has been used for the map. Based on results in ng E2 equivalents/L from total estrogenic activity measured in the YES assay. In contrast to these, the effluents from the less advanced traditional treatment plants with biological-mechanical or only mechanical treatment of the wastewater contain high levels of estrogens. The effluent levels are indistinguishable from the influent levels and, thus, these treatment technologies appear not to be capable of eliminating estrogens to any significant extent. In more than 100 effluent samples from a broad range of WWTPs we only found EE2 in concentrations exceeding 1 ng/L in seven samples from six WWTPs representing all categories except B. Due to its potency EE2 does occasionally account for a significant part (50%) of the estrogenic activity as measured in E2 equivalents, but most often approx. some 60-70% of the activity derives from E1 and 30-40% from E2.
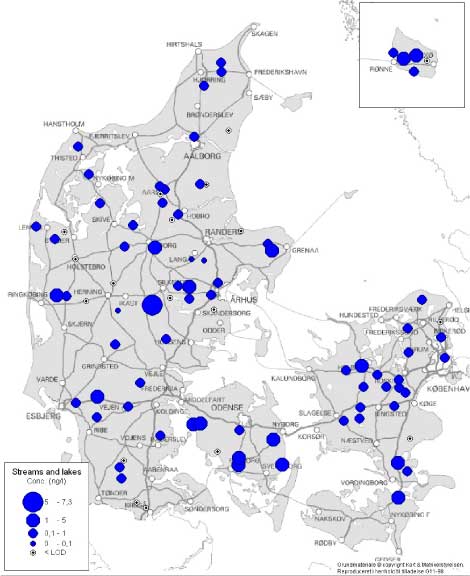
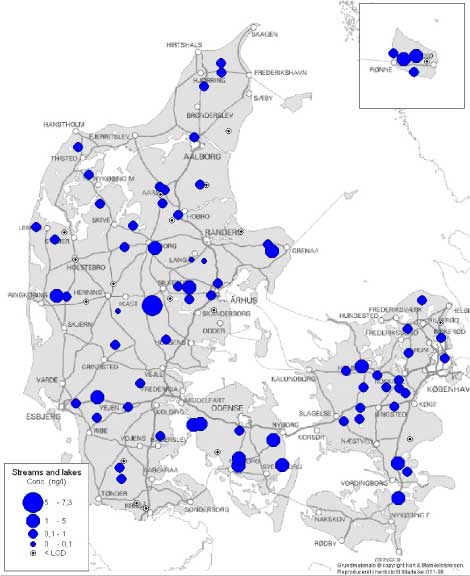
Figure 3 Overview of estrogenic activity in Danish streams and lakes. For the locations where more than one sample have been taken, the mean concentration has been used for the map. Based on results in ng E2 equivalents/L from total estrogenic activity measured in the YES assay. The sources in the open areas Effluent from septic tanks and generally from isolated houses (category G) displayed relatively high estrogenic activities with weighted averages of more than 70 ng/L. In category H, drains from fields where manure was applied approximately 2 weeks before the sampling, there are detections in 4 of the 8 samples, but in these samples the levels of total estrogens determined by the bioassay are low; from 0.1 - 1.1 ng/L and caused by estrone. It was not attributed to occurrence of the tracer for livestock. In category I, drains from fields amended with sludge before the first sampling in the spring of 2004, all five samples contain quantifiable levels of estrogenic activity. One of the samples showed more than 30 ng/L estrogenic activity, but the sampled drain is suspected of also carrying sewage from a septic tank. Stormwater retention basins did not show estrogenic activity. The freshwater environment In all sub-categories of freshwater aquatic environment (categories M-R) the weighted average levels of estrogenic activity are below 1 ng/L. Reference streams have the lowest level of all categories while samples from reference lakes are found to exhibit estrogenic activity at or near the same level as that of presumably more affected lakes. The "hit rate" i.e. the number of samples with quantifiable estrogenicity compared to the total number of samples is slightly higher in categories N and O (streams and lakes in areas with high density of cattle/pigs) than in the other sub-categories. Thus, the overall results provide no indications of significant differences between the categories. Geographical variation It is not expected that any geographic variations in wastewater composition with impact on estrogenic activity, although parameters such as water hardness may vary. A demographic variation may be expected e.g. due to a relatively younger population in urban areas with less women in menopause and increased use of anti-contraceptive pills, but if such an effect exist it is masked by the increased occurrence of WWTPs of high efficiency. In the freshwater environment the data give no indications of systematic regional differences due to geological conditions or differences in land use at the macro-level, except maybe for a slight indication of generally higher estrogenicity levels in the streams and lakes of the island of Funen. Seasonal variation The variation in the estrogenic activity of the effluent does not appear related to the season, likewise free and total activity in the effluent samples are not related to season. The samples taken winter-summer or spring-fall show that at the five sites for which winter-summer data are available, the summer samples are higher. The picture in the spring-fall samples is less clear, but may be interpreted as highest level at the sampling time in the fall. There is no observable pattern in the free-to-total ratio of estrogens over the seasons. The samples taken from sources in the open areas are by nature seasonally variable since they are linked to a seasonal activity such as the spreading of manure or sludge, or drainage systems primarily running during rains. From the fish farm wit a production including rearing of sexually mature adults the samples from fall showed a higher estrogenic activity. In the freshwater environment, no systematic pattern of seasonal variation is evident for samples taken in the spring and fall, but in the winter-summer sample pairs the summer samples appear to display higher estrogenic activity. This could be caused by less water in the streams and lakes during the dry season rather than higher loads of estrogen. Upstream and downstream An analysis of a total of 46 data sets from 34 out of the 36 WWTP locations and their receiving streams (one data set missing, one discarded) shows that in 24 cases out of 35 where estrogenicity was detectable (68%), the downstream level was higher than the upstream. In 5 cases the levels were equal, while in 6 cases (17%) the upstream concentration was the highest. In one of the samples from sources in the open areas (fish farms) a difference between up and downstream was observed. Sammenfatning og konklusionerSmå, traditionelle renseanlæg udleder østrogener til vandmiljøet Kortlægningen af østrogener i det danske ferskvandsmiljø viser, at de store og avancerede renseanlæg fjerner østrogener fra spildevandet ret effektivt. Det samme gælder de teknologisk mere simple biologiske sandfiltre. Derimod har de mekaniske og mekanisk-biologiske anlæg uden slambehandling en meget lav renseeffektivitet. Denne type anlæg, der typisk er små, er mest almindelige i landzonen, hvor enkeltejendommes septiktanke med lav renseeffektivitet yderligere vil bidrage til østrogenbelastningen af vandmiljøet. I de vandløb og søer, som ikke modtager spildevand, er koncentrationen i almindelighed under niveauer, der giver hormonforstyrrelser i fisk, mens der i vandløb, som modtager spildevand, er dobbelt så mange prøver med mere end 1 ng/l. Hvorfor blev kortlægningen sat i gang? Det vakte opsigt og bekymring omkring det danske ferskvandsmiljø da en undersøgelse i Århus Amt i 2000 viste, at op til 44% af populationer af ørreder og skaller i nogle af amtets vandløb udviste tegn på kønshormonale forstyrrelser (feminisering). En opfølgende undersøgelse i Voel Bæk godtgjorde, at de observerede kønsforstyrrelser i ørredbestanden ikke alene kunne tilskrives udledningen fra det lokale renseanlæg, men også måtte bero på andre kilder så som udledninger fra markdræn med tilsluttede septiktanke. En præliminær kortlægning i 2002 af indholdet af steroidhormoner i udløbene fra en række danske renseanlæg viste, at disse stoffer kunne påvises i det rensede spildevand fra 15 ud af de 19 undersøgte anlæg. Resultaterne af udenlandske undersøgelser indikerer, at hovedparten af den østrogene aktivitet skyldes naturlige og syntetiske (p-pille) østrogener snarere end forskellige industrikemikalier med østrogen aktivitet, de såkaldte xenoøstrogener. Dette billede blev bekræftet i en anden dansk undersøgelse på to renseanlæg, hvor den østrogene aktivitet langt overvejende (hhv. 80-94% og 90-95%) kunne tilskrives indholdet af de tre vigtigste steroidøstrogener. Miljøstyrelsen ønskede på denne baggrund at iværksætte en undersøgelse med karakter af en egentlig kortlægning af niveauerne af østrogener i danske ferskvandsmiljøer samt kilderne hertil. Undersøgelsen skulle baseres på en biologisk laboratorietestmetode støttet af kemiske analyser med fokus på steroidøstrogenerne østron, østradiol og ethinyløstradiol (p-pille østrogenet).
Kortlægningen Kortlægningen har samlet set omfattet udtagning af 341 prøver fra 148 lokaliteter i danske ferskvandsmiljøer samt mulige forureningskilder, ikke mindst renseanlæg af forskellige typer. Alle prøver er ved en biologisk test (assay) kaldet YES blevet analyseret for østrogen aktivitet fra de frie (aktive) østrogener såvel som den samlede pulje af potentiel aktivitet fra konjugerede (dvs. bundne, midlertidigt inaktive) østrogener, hvorved der er tilvejebragt næsten 700 datasæt. Hertil skal lægges ca. 150 prøver, som blev analyseret kemisk for både frie og konjugerede steroidøstrogener. I alt har kortlægningen således omfattet næsten 1000 datasæt fordelt på 7 typer af ferskvandsmiljøer og 11 typer af mulige forureningskilder. Udvalgte ferskvandslokaliteter og udledningssteder blev prøvetaget 2-4 gange i løbet af året og i tilknytning til renseanlæggene blev der indsamlet recipientprøver både op- og nedstrøms udløbspunkterne. Alle prøver blev testet med en biologisk test for østrogen aktivitet, YES testen, og omkring 40% blev også analyseret med en kemisk metode (GC-MS) for østrogenerne vist Boks 1. Boks 2: Konjugering Steroidøstrogener er stoffer, der let opløses i og bindes til fedt, og de kan derfor kun dårligt udskilles fra kroppen via nyrerne medmindre, der først sker en kemisk omdannelse, således at de bliver mere vandopløselige. Denne proces kaldes konjugering og består i, at der hæftes en vandopløselig molekyledel (en sulfat- eller en glucoronidgruppe) på østrogenet, hvorved det samlede molekyles egenskaber ændres så det lettere kan udskilles. Det konjugerede østrogen har ingen østrogen aktivitet, men efter udskillelsen kan konjugatet, når det kommer ud i spildevandssystemet, blive spaltet igen og derved genvinde sin aktivitet. Konklusioner Resultaterne af kortlægningen peger på, at der næppe forekommer udbredte effekter af østrogener i danske ferskvandsmiljøer. Umiddelbart nedstrøms udledninger af dårligt renset spildevand til små recipienter, eller i forbindelse med overløbssituationer, vil der dog sandsynligvis kunne optræde koncentrationer over effektniveauer kendt fra litteraturen. I 33% af prøverne fra vandløb og søer var den eventuelle østrogene aktivitet så lav, at den lå under den biologiske testmetodes detektionsgrænse på 0,05 ng/l (et nanogram = en milliontedel milligram). Der har dog kunnet påvises østrogen aktivitet med YES-assayet i praktisk taget alle typer af ferskvandsmiljøer i Danmark, dog typisk i koncentrationer på mindre end 1 ng/l. I næsten 70% af prøverne fra recipienter for spildevandsudledninger fra renseanlæg var den østrogene aktivitet i vandløbet umiddelbart nedstrøms udledningspunktet højere end aktiviteten opstrøms. Længere nedstrøms kunne påvirkningen fra renseanlægget typisk ikke erkendes mere. I den påvirkede zone af vandløbene var niveauet for østrogenaktiviteten typisk 1-5 ng/L svarende til ca. 5-10 gange niveauet på baggrundslokaliteterne. Resultater Til hver prøver hører to resultater fra YES assayet (fri og total østrogen aktivitet) og i de prøver, der er analyseret kemisk, er fire specifikke steroidøstrogener blevet bestemt på fri form samt som total mængde. Resultaterne fra alle feltundersøgelser er vist herunder. Figur 1 Præsentation af alle resultater fra biotest og kemiske analyser af østrogen aktivitet. Indløb (urenset spildevand) To anlæg i hver kategori af renseanlæg (dvs. i alt 12 anlæg) blev udvalgt til mere grundig undersøgelse, herunder udtagning af en indløbsprøve. Østrogenaktiviteten lå i hovedparten af disse prøver i intervallet 20-90 ng/L, men enkelte værdier var betydeligt højere. Det viste sig, at mere end 90% af østrogenerne var på fri form allerede i indløbet og dermed at spaltningen af konjugaterne øjensynligt finder sted hurtigt i spildevandsystemet. Det kvantitativt dominerende østrogen i spildevand er stoffet østron (E1) efterfulgt af 17β-østradiol (E2), der typisk udgjorde ca. 30% af det samlede indhold. Det hyppigst anvendte aktivstof i svangerskabsforebyggende midler (p-piller), ethynyløstradiol (EE2), forekom i godt halvdelen af indløbsprøverne, men kun i beskedne koncentrationer. Udløb (renset spildevand) De moderne eller udbyggede renseanlæg (kategorierne A og B) er forsynet med procestrin, der, typisk ved hjælp af aktivt slam, skal fjerne kvælstof fra spildevandet ved nitrifikation/denitrifikation (MBND-anlæg; kategori A) eller alene ved nitrifikation (MBN-anlæg; kategori B). Østrogeniveauet i udløbene fra disse renseanlæg er i næsten alle tilfælde kun nogle få ng/l og i enkelte tilfælde under detektionsgrænsen. Også i de teknologisk simple rodzoneanlæg (kategori E) og biologiske sandfiltre (kategori F) opnås der en god udløbskvalitet, ikke mindst i sidstnævnte, hvor der i en betydelig del af prøverne ikke kunne påvises nogen østrogen aktivitet. Resultaterne af udløbsprøverne er illustreret på Figur 2 herunder.
Figur 2 Kort med rensenlægslokaliteter og indikation af østrogen aktivitet i udløb. For de 12 anlæg med fire årstidsprøver er årsgennemsnittet anvendt. Baseret på østrogen aktivitet målt i ng/L fra biotest for total østrogen. I modsætning til disse anlægstyper indeholdt udløbsvandet fra traditionelle, lavteknologiske anlæg, dvs. mekaniske og mekanisk-biologiske anlæg (hhv. kategori C og D), østrogener i høje niveauer. Indholdet i udløbsprøverne kan praktisk taget ikke skelnes fra indholdet i indløbsprøverne og der synes dermed ikke at ske nogen nævneværdig fjernelse af østrogener fra spildevand ved anvendelse af disse teknologier. I mere end 100 prøver af renset spildevand fra en bred vifte af renseanlæg kunne vi kun påvise EE2 i koncentrationer større end 1 ng/L i seks prøver fra fem renseanlæg i kategorierne C, D, E og F. På grund af stoffets høje potens tegner EE2 sig dog i enkelte tilfælde for en betydelig del (50%) af den samlede østrogene aktivitet omregnet til E2-ækvivalenter, men i de fleste tilfælde tegner E1 sig for 60-70% af aktiviteten og E2 for 30-40%.
Figur 3 Kort med lokaliteter for overfladevand og indikation af østrogen aktivitet i udløb. For lokaliteter med mere end en prøve er gennemsnittet anvendt. Baseret på østrogen aktivitet målt i ng/L i biotest for total østrogen. Forureningskilderne i det åbne land Udløb fra septiktanke, der i vid udstrækning stadig bruges på isoleret beliggende, ukloakerede ejendomme i det åbne land, indeholdt generelt høje koncentrationer af østrogener med et (vægtet) gennemsnit på mere end 70 ng/L. I kategori H, dræn fra marker hvor gylle var udbragt omkring to uger før første prøvetagning, blev der påvist østrogen aktivitet i 4 ud af 8 prøver. Indholdet var dog lavt, 0,1-1 ng/L, og ikke forårsaget af biomarkøren for kvæg, 17α-E2, men skyldtes hovedsageligt østron (E1). I kategori I, dræn fra marker behandlet med spildevandsslam før forårsprøvetagningen i 2004, kunne der påvises lav østrogen aktivitet i alle fem prøver. En efterårsprøve fra én lokalitet indeholdt dog mere end 30 ng/L, hvilket fører til en mistanke om, at drænet også transporterer spildevand fra en septiktank eller lignende. Vandet i to forsinkelsesbassiner for opsamlet regnvand fra veje og tage udviste ingen østrogen aktivitet i YES-assayet. Ferskvandsmiljøet For de syv typer af ferskvandsmiljøer tilsammen blev der fundet et vægtet gennemsnitsindhold af østrogen aktivitet på mindre end 1 ng/L. I ca. 30% af prøverne var indholdet under detektionsgrænsen. Baggrundsvandløbene havde de laveste indhold af samtlige kategorier, mens baggrundssøer viste sig at udvise næsten den samme østrogene aktivitet som formodet mere belastede søer. Andelen af prøver med kvantificerbar østrogen aktivitet i forhold til det samlede antal prøver inden for en kategori var lidt højere i kategorierne N og O, dvs. hhv. vandløb og søer i områder med stor husdyrtæthed, end i de øvrige, men de vægtede gennemsnit adskilte sig ikke. Alt i alt må forskellene mellem de forskellige typer ferskvandsmiljøer betegnes som meget små. Geografisk variation Det var ikke forventet, at der skulle optræde systematiske regionale variationer med hensyn til spildevands indhold af østrogener som følge af forskelle i fysiske eller naturbetingede forhold. En mindre, demografisk betinget variation på grund af den generelt yngre befolkning i byområder og deraf følgende mere hyppig anvendelse af p-piller kunne derimod ikke på forhånd udelukkes. Der er dog ikke fundet tegn på dette i undersøgelsen. Heller ikke de tilvejebragte data fra ferskvandsmiljøet giver nogen indikationer af systematiske regionale variationer som følge af forskelle i jordbundsforhold, nedbør eller arealanvendelse på makro-niveau. Årstidsvariation Den samlede østrogene aktivitet i spildevandsudledninger synes ikke at have sammenhæng med årstiden, ligesom det relative forhold mellem frie og konjugerede østrogener heller ikke udviser årstidsafhængighed. Prøverne fra de vandløb som modtager spildevand fra de 12 udvalgte renseanlæg er taget i sæt enten vinter-sommer eller forår-efterår. I de fem vinter-sommer sæt, der er til rådighed, er indholdet i sommerprøverne højest. Billedet i forår-efterårsprøverne er mindre tydeligt, men med en tendens til højere indhold i efterårsprøverne. Der synes ikke at være nogen årstidsafhængighed i den relative sammensætning mht. frie og konjugerede former. Prøverne taget fra kilder i det åbne land er af natur sæsonbetingede eftersom de enten er knyttet til en sæsonbetinget aktivitet (så som udbringning af gylle eller slam) eller transportmekanismen (dræn) er stærkt afhængig af, om der er overskudsnedbør eller ej (som igen er sæsonbetinget). På et dambrug med blandet produktion blev der konstateret større forskel mellem opstrøms og nedstrøms prøver taget om efteråret end om foråret. Dette kunne enten skyldes en større andel af kønsmodne fisk om efteråret eller en sæsonrelateret anvendelse af hormonstoffer. I ferskvandsmiljøet i øvrigt kunne der ikke iagttages noget sæsonbetinget mønster i de prøver, der blev udtaget forår-efterår, mens der i vinter-sommer prøvesættene synes at være mere aktivitet i sommerprøverne. Dette skyldes muligvis en ren fortyndingseffekt, der er større i vintermånederne. Opstrøms- og nedstrømsprøver En gennemgang af i alt 46 sæt af recipientdata fra 34 ud af de 36 undersøgte renseanlæg (et datasæt manglede og et blev forkastet) viste, at i 24 ud af 35 tilfælde, hvor østrogen aktivitet kunne påvises (altså 68%), var den østrogene aktivitet nedstrøms udledningspunktet højere end opstrøms. I fem tilfælde var aktiviteten den samme, mens der i de sidste seks tilfælde (17%) var højere aktivitet i opstrøms- end i nedstrømsprøven. I langt de fleste tilfælde var forskellene dog små, og kun i et tilfælde afgørende anderledes. 1 Background1.1 Estrogens as an Environmental problem 1.1 Estrogens as an Environmental problemThe recognition of steroid hormones and other chemical substances with estrogenic activity as environmental contaminants and as an issue with potentially wide ecological implications is rather new. However, a few isolated examples date more than 20 years back. Already in 1980 visible changes in sexual development and fertility in a population of alligators in Lake Apopka, Florida, was observed following a massive release of the insecticide DDT and the chemically very resembling acaricide dicofol into the lake. Also the use of TBT (tributyltin oxide) as an antifouling agent in ship paints has been shown to severely affect the aquatic environment by impairing the reproduction of oysters and marine snails in coastal waters of e.g. western and northern Europe. Within the last 10 years a number of studies from Europe, Japan and North America have reported anomalous sexual development and reduced reproductive capacity among species of fish, amphibians, reptiles and molluscs as a result of exposure to chemicals with estrogenic activity. In Great Britain in particular, a number of field studies as well as controlled experiments have demonstrated the sensitivity of roach and other freshwater fish species to discharges of municipal and industrial wastewater leading to feminisation of the males, a phenomenon known as intersex. E.g., in two rivers heavily polluted by discharges of municipal wastewater almost 100% of the male population of roach was found to exhibit intersex and only half of the males were able to reproduce normally (cfr. Christiansen et al. 2002). Many of the investigations in the aquatic (freshwater) environment as well as controlled exposure of fish in the field and in the laboratory indicate that the natural steroid hormones of humans (and other mammals, e.g. domestic animals) to a large extent may be responsible for the sexual and reproductive disturbances that have been observed. It is suspected that effluents from municipal sewage treatment plants are major contributors to this type of pollution though other sources such as drainage water or surface runoff from fields fertilised with liquid animal manure may also contribute. A comprehensive study was recently conducted in the Netherlands (Vethaak et al. 2002), in which field observations were combined with controlled experiments and laboratory tests to give an overview of the problem of estrogens in the Dutch aquatic environment. In was concluded, among others, that municipal wastewater effluents generally exhibited estrogenic activity and that natural and synthetic steroid hormones in domestic sewage were accountable for a major part of the observed activity. In the USA, a "national reconnaissance" of pharmaceuticals, hormones and other wastewater contaminants was conducted in 1999-2000 by the U.S. Geological Survey (Kolpin et al. 2002a) in streams "susceptible to contamination". The investigation included more than 10 natural and synthetic reproductive hormones, including estrone (E1), 17-β-estradiol (E2) and 17α-ethynylestradiol (EE2). In total, the frequency of detection of reproductive hormones in the streams was 37% (Kolpin et al. 2002b), and the specific detection frequencies of E1, E2 and EE2 were 7%, 10% and 5.7%, with median detectable concentrations of 27 ng/L, 9 ng/L and 94 ng/L, respectively (the latter value being remarkably high). Also German scientists, e.g. Ternes et al. (1999), quite early started to investigate the emissions of estrogenic substances with discharges from wastewater treatment plants (WWTPs). Körner et al. (2001) found that E2 and EE2 (and to some extent E1) could account for about 90% of the estrogenic activity determined by the E-screen assay in effluents from 16 German WWTPs. In Italy, D'Ascenzo et al. (2003) studied the fate of the conjugated forms of steroid estrogens (the form on which the estrogens are excreted from the human body with urine) in sewage systems and WWTPs. They found that glucuronide conjugates were easily transformed back to the original, active form in these systems, while a sulphate glucuronide was more resilient to degradation. Reports of findings as the above did, at a quite early stage, also in Denmark lead to considerable concern among scientists, politicians and the general public. In recent years a number of studies with limited scope have been carried out to provide preliminary information on the possible extent and severity of this issue in the Danish environment. A brief review of the conducted field and laboratory studies is given below. 1.2 Previous Danish studies on estrogens1.2.1 Field studies of intersexIn 2000, a field study to reveal possible sexual disturbances in populations of roach and trout was conducted in a number of streams and lakes in the County of Århus (Århus Amt 2001). A high frequency (44%) of males with elevated vitellogenin plasma concentrations was observed among trout in the Voel Bæk stream as well as a high blood concentration of vitellogenin in the fish. In another watercourse, Kristrup Landkanal, in which a major part of the flow originates from the effluent of the 75.000 PE WWTP (current actual load) of Randers town, the intersex frequency among roach males was 26%. A follow-up study (Århus Amt 2003) in the Voel Bæk stream revealed that the observed anomalous sexual development in the trout population could not exclusively be attributed to the outlet from the small WWTP of Voel village as high concentrations of steroid hormones were also observed in two field drains receiving septic tank effluents from single farmhouses. Drains from fields amended with liquid manure were not investigated specifically, but the catchment of Voel Bæk is known to hold a quite high density of cattle and pigs. It was not possible to link the observed intersex effects to exposure from one single source of pollution. 1.2.2 Preliminary survey of WWTP effluentsIn the late autumn of 2002, Ingerslev et al. (2003a) conducted a preliminary survey of the contents of steroid hormones in effluents from 19 Danish WWTPs (one sample per WWTP) comprising a range of sizes, technologies and geographical locations. It is concluded by the authors that steroid estrogens could be identified in effluents from 15 out of the 19 investigated plants and that in 8 of the 19 samples the content exceeded the limit of quantification of 2 ng/Liter for E1 and 1 ng/Liter for E2/EE2, respectively. Generally, estrone was detected in the highest concentrations and, maybe, the WWTPs from the greater Copenhagen area had higher levels of estrogens in their effluents than the WWTP effluents from other parts of the country. Also, as a weak trend, the Copenhagen WWTP effluents contained more EE2 than the other effluents. This pattern in the results could be due to the higher population density in the Copenhagen area but might as well simply be a result of degradation of the labile estrogens in the samples from outside the Copenhagen area, which in general did not arrive at the laboratory until 1-3 days after sampling (in one case as much as five days). 1.2.3 Characterisation of WWTP influents and effluentsA study of 3 steroid estrogens and 10 xeno-estrogens in influents and effluents from Danish WWTPs was reported by Kjølholt et al. (2003), who in the summer/autumn of 2002 carried out three rounds of wastewater influent and effluent sampling at the WWTPs in Avedøre and Usserød (actual load 345.000 PE and 30.000 PE, respectively), which both serve suburban municipalities of Copenhagen. The results are shown in the table below. Table 1.1 Concentrations of Three estrogens in influent and effluent of two WWTPs in the greater Copenhagen area.
Overall, the influent concentrations correspond quite well whereas it appears that the elimination of the estrogens is more efficient at Usserød WWTP. This could be due to a sand filter installed after the clarifier tank at Usserød, a feature that Avedøre WWTP does not possess. Otherwise, the two plants have been designed according to the same overall principles and mainly differ with respect to size. At both plants, the steroid estrogens could account for far more estrogenic activity than the analysed xenoestrogens; 80-94% and 90-95% of the total (calculated as E2-equivalents), respectively. 1.2.4 Estrogen elimination processes at WWTPsAndersen et al. (2004) studied the degradation of E1, E2, EE2 and two conjugates of E1 (E1-3Glu and E1-3Sul), in laboratory experiments under aerobic and anaerobic conditions using activated sludge from Egå WWTP (near Århus). Aerobic degradation was found to take place very fast for E1 and E2 i.e. with half-lives of only a few minutes, while the half-life of EE2 was more than 100 times slower. The glucoronide conjugate of E1 (E1-3GLU) was transformed slightly slower than E1/E2 whereas the transformation rate of the sulphate conjugate (E1-3SUL) resembled that of EE2. In conclusion, the observed order of aerobic degradability was: E2 > E1 > E1-3Glu >> EE2 > E1-3Sul. Under anaerobic conditions, the degradation rates for E1 and EE2 were considerably (10-20 times) lower than under aerobic conditions while the degradation of E2 was not significantly changed i.e. still only a few minutes or lower depending on sludge concentration. Predictions of estrogen elimination at Egå WWTP based on the laboratory results indicated that more than 99.9% of E1, E2 and E1-3Glu in the sewage would be removed while about 3.3 % of EE2 would still remain in the effluent. The removal rate of E1-3SUL could not be estimated. The predicted removal efficiencies were higher than typically observed in monitoring studies at WWTPs, an observation that may be explained by the presence of one or more rate determining processes in real WWTPs (e.g. desorption rate of the sorbed fraction) that could not easily be simulated in the laboratory. 1.3 Project objectivesIn addition to the international findings and the Danish field and lab studies mentioned above, three review studies on feminisation of fish (Christiansen et al. 2002), analytical chemical methods (Ingerslev & Halling-Sørensen 2003) and biological assays (Kinnberg 2003) were carried out by initiative of the Danish Environmental Protection Agency. On this basis, the Danish minister of environment decided to launch new initiatives to further elucidate the estrogen issue. The initiatives should include generation of Danish data on estrogens in the environment to enable a better national assessment of the potential problem. Therefore, the present study was initiated with the following two main objectives, which should be reflected in the selected scenarios for investigation and in the choice of locations and sample types for testing and analysis:
Some minimum requirements to scenarios/types of samples were stated by the DEPA as part of the project description:
The strategy for meeting the objectives is described in the following chapter. 2 Strategy and design of the study2.1 Overall strategy 2.1 Overall strategyDEPA's project description in the tender documents calls for a broad investigation of the estrogenic activity in the Danish aquatic (freshwater) environment with a good geographic coverage of the environmental situation and the potential pollution sources. This request has been the cornerstone in the development of the overall strategy and the operational design of the investigation programme of the study to be described in this chapter. 2.1.1 Selection of scenarios and locations
2.1.2 Sampling
2.1.3 Biological testing and chemical analysis
2.2 Selection of sampling sitesThe requested scenarios (Section 1.3) were divided into three main categories, each containing a number of sub-categories:
A more detailed description of each main category and its sub-categories is provided in section 2.2.1 - 2.2.3. It was a general requirement to all sampling sites that they should be reasonably accessible by car (to a close distance), that sampling should be possible without site modifications or non-standard equipment, and, preferably, that relevant data on the site and its characteristics were available.
*: Treatment processes: **: Septic tanks An overview map of the selected locations is shown in Figure 2.1. Detailed information regarding the sampling such as site names and location, the planned sampling programme etc. is included as Appendix 5 to this Report.
Figure 2.1 Location of sampling sites. WWTP sampling sites are always associated with sampling stations in the receiving stream upstream and downstream the point of discharge. 2.2.1 Wastewater treatment plantsThere are 1,240 registered wastewater treatment plants in Denmark (Miljøstyrelsen 2004), ranging from simple facilities serving only a few people to technically advanced plants with a current load of up to about 500,000 PE. An overview of the number of plants within the six simplified technical categories applied for the purpose of this project together with their share of the total volume of municipal wastewater in Denmark is shown on the following page. It should be mentioned here that WWTPs with tertiary treatment processes such as sand filters, lagoons, or UV- or ozone treatment on the effluents deliberately were not selected for the investigation programme. The reason for this was to keep the number of factors influencing the WWTP performance (effluent quality) sufficiently low to enable conclusions to be drawn. Explanation of WWTP categories: A. MBND/MBNDC: Plants with Mechanical, Biological (phosphorus removal), Nitrification and Denitrification (usually by activated sludge) treatment processes for removal of nitrogen, which on a significant number of plants are complemented by Chemical precipitation. This category includes all major WWTPs in Denmark. B. MBN/MBNC: WWTPs basically with same technology as above, however, without the denitrification step, and therefore without removal of nitrogen (only conversion of ammonia to nitrate). Mostly relatively small plants. C. MB/MBC: Small, simple plants usually located in rural areas. D. M/MC: Very small plants, often not much more than big septic tanks. Generally speaking, the technologically most advanced plants are also the largest and at the same time those with the biggest share of their wastewater influent originating from industrial enterprises. Of course exceptions occur, e.g. if a small community is substantially influenced by one major local enterprise. It should also be mentioned that with respect to reduction of traditional wastewater parameters (e.g. COD, nutrients and suspended matter), the performance of the WWTPs largely fall into the same four main categories of traditional WWTPs that are used for classification in this project (Cat. A-D) (Miljøstyrelsen 2004).
As appears from the table the plants in category A are completely dominant with regard to volume of wastewater treated. The 30 largest plants (all >100,000 PE) are currently treating almost 50% of the total volume of municipal wastewater in Denmark. However, the majority of these WWTPs are situated at or near the coast and their effluents are discharged directly into the marine environment. Hence, such plants are of limited interest in relation to this project and its objectives. It seems likely that the smaller, and often more simple, WWTPs are relatively influential on the water quality of streams, rivers and lakes. Their treatment efficiencies are lower (as assessed by common water quality parameters) and, in addition, they often discharge into rather small water bodies. Thus, they may have a considerable impact on the total flow and quality of the stream including the estrogenic activity. For these reasons the number of WWTPs within each category of this study is more even than it should be if the share of the total wastewater volume alone was the determining parameter. Some general requirements to the character and state of the WWTPs were put forward to the Danish counties and others in the process of identifying and selecting the specific installations for the study. These were:
Within each of the six mentioned categories of WWTPs, two sites were selected for more detailed examination:
2.2.2 Other potential sources of pollution (open land sources)In addition to the WWTPs a number of other sources may contribute to the total estrogenicity in the aquatic environment, particularly in the open land. These potential sources are, within each sub-category, believed to be relatively homogenous in terms of release and composition of estrogens and, hence, only relatively few locations have been selected to characterise their respective contributions to estrogenicity. All samples in this main category were, in addition to the biological testing, analysed chemically. Category G - effluents from isolated houses Isolated single houses (mostly farmhouses) in the open land outside towns and villages are not always connected to a sewer but may discharge their domestic wastewater via field drainage systems, normally following an initial settling of particulate matter in a septic tank or similar. Such a settling system does, however, not offer much in terms of improvement of the general effluent quality and therefore an impact of such effluents with regard to estrogens cannot be excluded and may even under specific circumstances be significant locally. It was a requirement to the sites in this category that the effluent should be possible to sample without having to modify the installation. This turned out to be a problem and, hence, it became necessary to introduce "surrogate" samples from other sites (WWTPs) where sampling of wastewater of a quality believed to resemble that of septic tank effluents was possible. Categories H and I - drains from manure and sludge amended fields, respectively Huge amounts of liquid and solid manure from pigs and cattle are each year applied to agricultural fields as organic fertilizers. Similar to humans, domestic animals produce estrogens that potentially exhibit the same type of effect on fish and other aquatic wildlife as the human estrogens. Likewise, a significant volume of sewage sludge (with sorbed estrogens) is amended to arable soils as a means of waste disposal that concomitantly provides nutrients and improvement of soil structure and organic carbon content. When applied onto agricultural soil, these waste products can be said to undergo a type of treatment process similar to sewage in WWTPs as the soil micro-organisms will degrade a significant fraction of the estrogens while another will be sorbed onto the soil matrix. Still, cracks and other macropores in the soil may enable some leaching of the substances to drainage depth and subsequent release to the aquatic environment. Category J - Stormwater runoff from separate collection systems A significant fraction (about 50%) of stormwater runoff from separate collection systems in towns and along roads is emitted directly into water bodies. This potential source is anticipated to be an insignificant one with regard to steroid estrogens, but it is known from other investigations that surface runoff can contain significant concentrations of heavy metals and various xenobiotics including some with known or suspected estrogenic activity (e.g. Arnbjerg-Nielsen et al. 2002; Kjølholt et al. 1997). Sampling for this category was done in the retention basins where an integrated figure of the quality from a whole rain episode could be obtained without having to install and operate flow-proportional equipment. Retention basins that were dry in between rain episodes were selected for the sampling. Category K - Fish farms Fish are very sensitive to estrogens in their environment but they also produce and excrete such substances themselves in low amounts. Therefore, a few trout fish farms are selected to investigate whether a large number and high density of fish in one place results in a measurable increase in estrogenic activity. Several types of fish farms exist, the most common being one producing sexually immature trouts for individual consumption. Other trout farms also rear mature fish for production of eggs or fry. Category K was investigated by testing/analysis of samples taken up- and downstream the effluent points. One farm of each of the mentioned main types was selected for the study. 2.2.3 The freshwater environmentThe environmental samples are sub-divided into a number of categories defined on basis of the anticipated level of exposure to estrogens from either urban or open land sources. Within each category a few sites were selected for more detailed examination i.e. they were sampled twice during the course of the study (the others only once), and the samples were not only tested biologically but also analysed chemically. Category L - streams/rivers receiving WWTP effluents For each of the selected WWTPs the stream/river receiving the treated effluent is also sampled upstream and downstream the point of discharge. Hereby it is attempted to identify and, if possible, semi-quantify the impact of WWTP effluents on surface water quality. The distance of the sampling point relative to the discharge point is determined by the width of the receiving stream/river as this is easy to use as a measure of when complete mixing of effluent and stream water has been achieved. Upstream samples are taken just 2-3 widths upstream while downstream samples are taken approximately 10 x river width from the discharge point. At the WWTPs selected for more detailed examination, some additional L-samples were taken 100 x river width downstream. Categories M and R - generally exposed/affected streams and lakes, respectively By "generally exposed/affected" is meant that no nearby point sources are evident but in the catchment of the stream/river (Cat. M) or the lake (Cat. R) both drained fields, single houses and towns with WWTPs are present, which may affect the general water quality. Most of the upstream samples from Category L can also serve as examples of "generally exposed" streams and rivers (Category M), as they are not located in reference areas. Some upstream L-samples are, however, taken in urban areas and are for the purpose of serving as "generally exposed" streams put in their own sub-category; LU(U). Categories N and O - Streams/rivers and lakes in husbandry areas, respectively Information from the Danish counties has been used to select a limited number of streams/rivers and lakes in areas with high densities of pigs and/or cattle to elucidate whether this type of agricultural activity and the associated need for waste disposal on the fields is reflected in a concomitant higher level of estrogenic activity than in general. Categories P and Q - reference streams and lakes, respectively It is also important to know whether estrogenic activity is an inherent property of aquatic environments in the sense that such activity can be detected even in places without known inputs from anthropogenic sources including husbandry. Therefore a number of small streams and lakes in catchments known or assessed to be practically without human settlements and/or activity have been identified for the study. 2.2.4 Special investigationsThe special investigations mentioned in the overview table in the introduction to Section 2.2 consisted of a study on three selected WWTPs representing different treatment technologies with the aim to determine the variation in effluent composition during 24 hours (and the error introduced by spot sampling compared to flow-proportional sampling). The investigation is described thoroughly in Section 4.1. 3 Overview of activities3.1 Sampling methodology This chapter gives an overview of the sampling, conservation and storage procedures applied to ensure sample integrity as well as the chosen methodologies for biological testing and chemical analysis, respectively. 3.1 Sampling methodologyAll samples were taken as spot samples as the flow-proportional sampling were not considered to be feasible for the survey, see section 2.1.2. To limit the error introduced by the use of spot samples all samples were taken by “qualified spot sampling” (German Ministry of Environment 1997), a sampling procedure where each sample is mixed from equal parts of five sub-samples taken with at least 2 minutes time intervals within a maximum of 2 hours (for practical reasons typically about 30 minutes in this project). A special investigation was undertaken to document the possible error introduced by the use of spot sampling instead of the ideal flow-proportional sampling. The investigation is described further in Section 4.1. Two-litre and ten-litre glass bottles were used for sampling. The glass bottles from Schott (Blue Cap) were equipped with Teflon lined screw caps. Before use the bottles were cleaned by the usual laboratory washing procedure followed by 4 hours ignition at 430°C. Each of the five sub-samples were taken in a two-litre bottle and equal amounts, generally 2 litres, transferred to one ten-litre bottle. The samples were immediately preserved by the addition of sulphuric acid to pH 3. After the preservation the mixed sample was further transferred to 4 two-litre glass bottles. The samples were kept cool during the field operations, and after the day's work the samples were transported to the laboratory under cooled condition. For all samples the analysis was started the in the morning of the next day i.e. within a maximum of 30 hours after field sampling and preservation. In the laboratory the sample consisting of four identical sub-samples were treated as described in the following. 3.2 Analysis of steroid estrogens and estrogenic activityIn the project the samples were analysed either for their content of free estrogens or for the content of estrogens after cleavage of conjugated estrogens (i.e. total estrogen concentration). It was possible to analyse both total and free estrogens with the chemical as well as the biological method. The overall sample handling procedure is illustrated in Figure 3.1. Samples were divided intro four sub-samples which were treated differently. Sub-sample 01 was used for the biological analysis of estrogenic activity of both total and free estrogens. Sub-sample 02 was used for chemical analysis of free estrogens in the sample. In sub-sample 03, the deconjugation step enabled the determination of total estrogens with the chemical method. Sub-sample 04 was stored in the “sample-bank” for later purposes. In the following, brief descriptions of the different methods used in the determination of estrogens and estrogenic activity are given. The detailed descriptions and documentation of each method are given in the appendices to this report.
Figure 3.1 overall sample handling procedure. 3.2.1 Sample pre-treatmentAs illustrated above all samples were filtered prior to extraction on solid phase columns. GF/C glass fibre filters were used for filtration. Solid phase extraction (SPE) was made by eluting 2 litre samples through C18-cartridges (Varian, Mega Bond Elut® 1 g/6 mL) which were stored in the freezer until further analysis. After storage 5 mL of acetone was used to elute the analytes from the cartridges. The acetone extract was evaporated to dryness under a gentle stream of nitrogen. The dried acetone extracts from SPE-cartridges were treated with -glucuronidase enzyme 2 from Helix pomatia to cleave the conjugated estrogens and thus enable free and conjugated estrogens to be determined in one analysis. This procedure was applied to 03 sub-samples and half of the acetone extract used for biological analysis (sub-sample 01). To remove substances interfering with the chemical analysis, a cleanup step using silica gel was applied prior to GC-MS-MS analysis. More details on methods and testing related to the handling and pre-treatment of samples can be found in Appendix 1. 3.2.2 Biological testingThe estrogenicity of the water samples was determined by means of the YES-assay as described by Routledge and Sumpter (1996). Sub-samples from the project were analysed as follows: Initially, the samples were evaporated to dryness under N2 at 35°C after which the evaporation residue was dissolved in 300 µl ethanol. This is referred to as the undiluted sample. The sample was transferred to a vial which was stored at -20°C. 100 µL of each sample was transferred to a microtiter plate (the dilution plate) and a dilution series was produced; the dilution factor in the series was 2 and 12 diluted samples were produced. The assay plate contained one row of standard (17β-estradiol), one row of blank and six rows of samples. 10 µL of each dilution was transferred to a new microtiter plate (the assay plate). This step was carried out in a Laminar Air Flow bench. The assay plates were allowed to dry in the bench after which 200 µL yeast culture were added. Subsequently, the assay plates were incubated at 32°C for 3 days. The absorbance at 540 and 630 nm was determined and sample absorbance was converted to E2 equivalents by comparison with the E2 standard curve. The slope of a fairly large number of the sample response curves deviated from the slope of the E2 standard curve and the maximum absorbance was lower than the absorbance of the E2 standard curve (shown in Appendix 3). For these samples only the lower part of the response curve was used for the calculation of E2 equivalents (described in Appendix 3). 3.2.3 Chemical analysisSeparation and detection of the steroid estrogens were accomplished using a gas chromatographic-tandem mass spectrometry system (GC-MS/MS) consisting of a gas-chromatograph (Varian, CP-3800) and a triple quadrupole mass spectrometer (Varian, MS 1200 Quadrupole MS/MS system). Extracts of samples cleaned up with silica gel were evaporated to dryness and derivatized using a 50 µL of a mixture of N-methyl-N-(trimethylsilyl)-trifluoroacetamide (MSTFA), N-trimethylsilylimidazole (TMSI) and 1,4-dithioerythritol (DTE). After one hour of incubation at 60 °C the liquid was evaporated to dryness and re-dissolved in 200 µL heptane. Similarly, the initial sample volume of 2000 mL was reduced 10,000 times and the analytes pre-concentrated proportionally. The analytical method is described in more detail in Appendix 2. Concentrations of the steroid estrogens were calculated using a calibration curve for the ratio of the responses of the analytes and their deuterated internal standards. The calibration curve is fitted to a linear equation. 3.2.4 Data treatment and E2 response factorsThe chemical analysis provided concentrations of four individual estrogens, which were recalculated to total estrogenic activity based on equivalence factors determined in this study to be 0.29, 0.88, and 0.04 for E1, EE2 and -E2, respectively. The results in the main report are mainly presented as the calculated E2-equivalents, while the data for the individual steroid estrogens can be found in Appendix 6. It is attempted to give an unbiased expression of the data and the data sets are shown without correcting for the deviation in control samples (see section 4.3). 3.3 Quality Assurance3.3.1 Quality Control samplesTo monitor the performance of the analytical method during the project, an internal quality control scheme has been established involving blind samples and control samples that are prepared and analyzed together with every series of real samples. Results from these analyses are monitored by registration in control charts. 3.3.2 Inter-laboratory comparisonSince two different laboratories are responsible for conducting the chemical analyses in this project a small scale inter-laboratory comparison between the two laboratories has been conducted. A total of 12 identical authentic samples were analyzed by both laboratories in order to reveal any disagreement between results from the two laboratories. An inter-calibration of the YES assay was made between our laboratory and the laboratory of Prof. John Sumpter at Brunel University, UK, where this assay was developed originally. The implemented quality assurance measures are described more thoroughly in Appendix 4. 4 Pre-monitoring tests and quality assurance4.1 Sampling procedure This chapter will briefly discuss the reasons to carry out the special studies and the results developed. It also contains the assessment of the quality assurance programmes. 4.1 Sampling procedureThe ideal sampling procedure for wastewater (and streams/rivers) is flow-proportional sampling. In the Danish national aquatic monitoring programme (NOVANA), flow-proportional sampling is applied when influents and effluents are sampled at the WWTPs. However, for reasons of economy and practicality the flow-proportional sampling was not used in this survey. Therefore, a special investigation was undertaken partly to study the variation in effluent composition during 24 hours and partly to document the possible error introduced by the use of the alternative sampling method applied, the so-called qualified spot sampling (see Section 3.1). By this method, a sample is produced by mixing of five sub-samples of equal volume, taken with intervals of at least 2 minutes within a total period of half an hour. The investigation was concentrated on effluents from three WWTPs representing different treatment technologies and already (from previously sampling rounds in this study) known to contain quantifiable estrogenicity. Effluent samples to describe the variation in composition during one day were taken by spot sampling at different hours during the day. Also the temporal variations between day, evening and night during 24 hours was examined by taking flow-proportional samples covering three consecutive periods of 8 hours, 6 hours and 10 hours. The three WWTP's were:
On these treatment plants it was possible to obtain flow-proportional samples either with the stationary sampler or a portable waste-water sampler. After sampling the samples were treated according to the general procedure in the survey. The samples were subjected to biological measurements and the total and the free estrogenic activity was determined. The results are presented in Table 4.1 for the flow-proportional samples and in Table 4.2 for the spot samples. Some explanations are given:
Table 4.1 Results from the special investigation of the sampling procedure. Upper panel are Flow-proportional samples and lower panel spot samples.
For the flow-proportional samples in Table 4.1 the variation measured as RSD is low, between 6% and 22%, except for results near the limit of detection for the method (approx. 0.1 ng/L). This implies that there is no significant change in the mean of the estrogenic activity during day, evening and night. For the spot samples taken during the day, a RSD between 19% and 28% was found, except for results near the limit of detection. The variations are within a factor of two, when the highest activity is compared with the lowest activity from a certain WWTP. This shows that the variation during the day is relatively low. A comparison between the activities found in the flow-proportional samples and the activities found in the spot samples shows very small and not significant differences. The investigation confirms that the chosen sampling strategy with the use of qualified spot samples instead of flow-proportional samples has not resulted in a significantly increased error from the sampling process. 4.2 Enzymatic treatment of conjugated estrogens4.2.1 BackgroundEstrogens are primarily excreted from humans and animals in conjugated form. The conjugants are either sulphate or glucuronide and each of them can bind to the estrogens on either the 3 or the 17 positions (see Figure 4.1) or on both positions. The di-conjugated estrogens are, however, chemically unstable and are readily cleaved to mono-conjugates. This cleavage occurs almost instantly (D'Ascenzo et al 2003), and the di-conjugated estrogens will therefore not occur in sewage and are therefore irrelevant in the current context. The current section discusses the importance of the conjugated estrogens with regard to interpretation of the results and to the assessment of the potential “delayed” release of estrogens to the environment when conjugated estrogens are cleaved in the environment.
Figure 4.1. Structural formula of 17β-estradiol 4.2.2 Investigation of loss of conjugated estrogensIn the project, the conjugated estrogens have only been measured indirectly, by measuring the total estrogen concentration after enzymatic de-conjugation and subsequently subtracting the observed level of free estrogens. As will be discussed in the following, there is in principle a risk that this determination of conjugated estrogens underestimates the actual amount of these substances. Two factors may have impact on the result (though it turned out that this was not the case here): The first occur if the conjugated estrogens not are cleaved completely during the enzymatic deconjugation procedure. Here, it was shown that the cleavage was quantitative with the exception of E2-17S of which only approximately 9% was cleaved (Appendix 1.4). A number of studies has however, shown that E2-17S is not excreted from humans and therefore this insufficient cleavage is unimportant in the current context (Andreolini et al 1987; D'Ascenzo et al 2003; Zhang and Henion 1999). The second reason for a potential underestimation of the concentration of conjugated estrogens is if the loss of conjugated estrogens during the analytical steps is significantly different than that of the parent compounds. This reduction is not taken into account in the calculation of the concentrations which is based on the use of deuterated internal standards (E1, E2 and EE2). Investigations have therefore been made in order to quantify any on loss of conjugated estrogens due to:
Each of these experiments is described in detail in Appendix 1. The results show that there is no reduction in the amount of conjugated estrogens in the samples during storage. The loss during solid phase extraction is independent of the compound in question and range from 2 to 27%. These findings are consistent with the observations made for the non-conjugated estrogens (the parent compounds) and consequently it can be assumed that the amount of conjugated estrogens is determined with a precision, which is close to that of the parent compounds. 4.2.3 Losses during transport and storageConjugated estrogens were analysed indirectly by using the procedure for enzymatic cleavage of the conjugates and subsequently measuring the concentration of the parent compounds. The stability of the parent compounds during transport is well documented in the scientific literature. In contrast, such data are sparse with regard to the conjugated estrogens. As the conjugated estrogens were measured indirectly in the current project, we therefore performed a study with the aim of assessing the stability of conjugated estrogens during transport and storage. The experimental details as well as the results of this study are described in Appendix 1.1. The study revealed that within 7 days the conjugated estrogens are not significantly degraded in sewage effluent that has been acidified with H2SO4 (pH=3). In conclusion the study revealed that similarly to the free estrogens, the conjugated estrogens are stable during transport and storage. During handling of samples to be analysed for chemicals at very low concentrations, the binding of the analytes to glass equipment may be a significant factor leading to loss of the analyte. Documentation exists, showing that the free estrogens do not bind to glass equipment (Fürhacker et al., 1999). It is characteristic for the conjugated forms of the steroid estrogens that they are more hydrophilic and therefore are more likely to bind to glass equipment during handling and treatment of the samples. A study was therefore conducted to assess whether there was a significant loss of these substances during transport and storage due to their binding to glass equipment. Briefly, the study was conducted by incubating conjugated estrogens in mili-Q water for two days and then comparing the concentrations in water when the experiment was initiated and after two day. The experiment and the results are described in more details in Appendix 1.2. The results revealed that no significant loss of conjugated estrogens could be expected during transport and storage. 4.2.4 Losses during sample pre-treatmentThe recovery of free estrogens on SPE columns has been studied by several authors and it is generally accepted that high recovery (> 60%) is achieved when using a method as the current (see e.g., Desbrow et al., 1998; Snyder et al., 2001, Ternes et al., 1999). In a preliminary study, five different cartridges (Varian® C18 Bond Elut® (6 ml/1 g); Isolute® C18 (6 ml/500 mg); Waters Oasis™ HLB (6 cc/200 mg); Isolute® ENV+ (6 ml/1 g); Waters Porapak™ Rdx (6 cc/ mg)) were tested using spiked tap water to 100 ng/L. The highest recovery was obtained using the Varian cartridges, which subsequently has been applied though out the project. This column material has previously been used for analysis of steroid estrogens (Andersen et al., 2004). Additional recovery experiments were conducted with these columns and selected conjugated estrogens. These studies, which are described in details in Appendix 1.3, revealed that the column material gave recoveries similar to those obtained for the free estrogens. The enzymatic cleavage of conjugated estrogens was developed as a part of this project. If the method should be suitable for its purpose, we needed to document the following:
As described in Appendix 1.4, experiments were performed showing that all of these three demands were fulfilled. In order to remove substances with interference on the chemical analyses a clean-up procedure using silica gel was used for all samples for chemical analyses. Briefly, the acetone eluate from the SPE cartridge was evaporated to dryness under N2-gas. The samples were then redissolved in 200 µl of hexane:acetone (65:35 vol:vol). And then loaded onto the silica gel column and eluted with the hexane-acetone mixture until 5 ml eluate were collected. The absolute recoveries of the analyte for the clean up step were evaluated for the free estrogens and it was found that the clean-up is almost quantitative for each analyte (Appendix 1.4). 4.3 Quality controlSeveral different measures have been taken to ensure the quality of the results obtained during this project. The quality assurance elements consisted of (1) an internal quality control scheme and (2) measures to compare results with other laboratories. 4.3.1 Internal quality control schemeIn connection with every series of samples a set of quality control samples was analysed along with the real samples, i.e. taken through the complete analytical procedure. Each set of quality control samples consisted of one blank sample (tap water) and two identical control samples (tap water to which a mixture of the three estrogens (estrone, 17β-estradiol and ethynylestradiol - E1, E2 and EE2) had been added at a level 2.5 ng/L of each analyte). The same set of quality control samples were used for the biological assay and for the chemical analytical method. Results from the control samples were collected in quality control charts, which all are shown in Appendix 4. The control chart displays mean values of the two control samples for each series of samples (X-chart) as well as the difference between duplicate results (R-chart). 4.3.2 Precision and Limit of Detection (LOD)4.3.2.1 Chemical LODsFrom the control charts the precision can be calculated for each parameter measured. The control chart with results from the biological assay gave an overall precision (RSD, reproducibility)) of 29 % from measurement of estrogenic activity. Similarly, the overall precisions from the chemical determination of the three analytes were 30 % (E2), 17 % (E1) and 27 % (EE2), respectively. For the chemical parameters the Limit of Detection (LOD) was used as a measurement of the lowest amount that can be determined by the method used. The chemical LOD is defined by the formula:
where Sw is the standard deviation determined in the same series of samples (repeatability) at concentrations near the LOD, and t0.995(f) is between 3 and 4 with more than 6 repetitions. Based on this definition, an experimentally generated general LOD for the chemical analyses was determined to 0.1 ng/L for each component. In the both of the abovementioned procedures, tap water was used instead of real samples (i.e. sewage effluent or surface waters) though, obviously, more analytical problems due to effects from the matrix could be expected if real samples were analysed. However, by comparing chromatograms from sewage effluent and surface water with those obtained with tap water, matrix effects generally appeared to have only minor importance. There were, however, situations where such problems occurred and resulted in elevated detection limits. 4.3.2.2 Detection limits in YES-assayFormal limits of quantification and detection cannot be defined in a bioassay as the YES-assay the same way it is possible in a chemical analysis. Samples with a detectable estrogenic activity have been defined by the following criteria:
The lowest level of estrogenicity detected in the investigation by these criteria was 0.03 ng E2 equivalents per litre. Since the absorbances of the blind samples throughout the analytical series were fairly constant, a general detection limit in the YES-assay in the present investigation is 0.05 ng E2 equivalents per litre. In the individual cases it ranges between 0.03 and approximately 0.07 ng E2 equivalents per litre. 4.3.3 Inter-laboratory comparisonAs two laboratories were involved in the chemical analysis of the samples, an inter-laboratory comparison between the two laboratories was performed. A total of 12 identical authentic samples were analyzed by both laboratories in order to reveal any disagreement between results from the two laboratories. The results are presented in Appendix 4. Briefly, good correlations between the results produced in the two laboratories were obtained. 4.3.4 Comparison between control sample results from biological and chemical measurementsSince the control samples used for the quality control in both the biological assay and the chemical analysis are identical samples, data from the control charts can be used to compare the overall agreement between the two methods. This can be expressed as the ratio between the biological and chemical measurement including the standard deviation of the ratio. The calculated mean estrogenic activity of the control samples measured by YES assay was 6.8 ng/L, whereas the calculated mean content (expressed as estrogenic activity) from the chemical analysis was 5.2 ng/L. These results indicate that the ratio (biological/chemical) between measurements performed on identical samples is 1.3. From the control chart of the biological assay a RSD of 29 % is calculated. For the chemical results converted to E2-equivalents the RSD can be calculated from the individual RSD's from the control charts giving a RSD of 39% for the chemical analysis. This means that measurements of ratios between biological and chemical results are accompanied by a combined RSD of 49 %. Consequently, a ratio of 1.3 with a RSD of 49% indicates that ratios (biological/chemical measurements) lower than approximately 2.6 are not statistically significant (given a 95% level). 5 Presentation of field dataThe data to be presented in this and the subsequent two chapters are based on a total of 341 samples incl. the special investigations from 148 locations in the Danish aquatic environment including a range of possible pollution sources. All samples were analysed by the YES assay for both free estrogens and total (deconjugated) estrogens giving a total of nearly 700 data sets. In addition, approx. 150 samples were analysed chemically for free estrogens and total estrogens. Thus, the complete survey comprises almost 1000 data sets. This section presents an overview of the data as well as the statistical methods used in the presentation of the results. The overall results for the bulk of data are shown in Table 5-1, while the complete set of biological and chemical data obtained in the project are listed in Appendix 8. In the following chapters most figures will display the biological data adding and discussing the chemical data sets when relevant. The chemical analysis provides concentrations of four individual estrogens, but as a general rule only the combined activity is presented calculated by using the response factors determined for the YES assay. In Tables 5.2-5.3 the chemical concentrations of individual steroid estrogens in environmental as well as pollution source samples are included except for the data from the special investigation of variation in effluent composition at three WWTPs. It has been chosen to follow the data presentation strategy outlined in the American survey (Kolpin 2002a). This includes calculating median values (geometrical means) rather than arithmetic means due to the typical skewed distribution of data, and use the maximum values for range setting. It should be borne in mind when directly comparing the median levels between categories, that they are based only on the detected levels, which in the case of a significant number of non-detects will lead to conservative estimates of median values. Table 5.1 Presentation of all bioassay and chemical results for measurement of the Free and total level of estrogen activity (total is measured after enzymatic deconjugation). N is separated into samples below detection limit ('clean' samples), hits above detection limit and total number of samples.
Table 5.2. Presentation of chemical results for measurement of free estrogens. N is separated into samples below detection limit ('clean' samples), hits above detection limit and total number of samples. Median concentrations (ng/L) are calculated on basis of results above LOD.
Table 5.3. Presentation of chemical results for measurement of total estrogens. N is separated into samples below detection limit ('clean' samples), hits above detection limit and total number of samples. Median concentrations (ng/L) are calculated on basis of results above LOD.
Overleaf in Figure 5.1, the entire data set is presented in four panels depending on the assay and treatment: biological (total), biological (free), chemical (total) and chemical (free). The lettering code refers to the source and environmental categories described in Section 2. For convenience the names are repeated below the figure. Two figure panels show data obtained measuring estrogenicity (E2-equivalents) with the YES-assay in samples with and without enzymatic cleavage of conjugated estrogens (Figure 5.1a and 5.1b respectively). Figure 5.1c and 5.1d present results obtained with the chemical analysis after transformation of the data obtained for each analyte to E2-equivalents. The calculation of E2-equivalents is based on equivalence factors of 0.29, 0.88, and 0.04 for E1, EE2 and a-E2 respectively. These equivalence factors were determined experimentally as a part of the project by testing each substance with the YES-assay. Click here to see Figure 5.1 A-D. Figure 5.1 A-D Presentation of all bioassay and chemical results above the limit of detection for determination of the free and total concentration of estrogens. In accordance with other similar projects (e.g. Kolpin et al., 2002a), graphical presentations of data represent only samples where estrogens were found at concentrations above the limit of detection (LOD). Similarly, the median concentrations and number of detections listed in tables are calculated on basis of only those samples where analytes were detected. The arguments for this practise is discussed by several authors (Kolpin et al. 2002a; Till, 2003) and can be summarized as follows: the reason for not including blank samples is that if their number is high, calculated medians and fractiles would be low and thus not be representative for the samples where estrogens were detected. However, samples with estrogenic activity below the detection limit represent the 'clean' environment or sources with very low release of estrogens, and this information is highly relevant in a survey of sources and levels. In the following we have therefore chosen to show diagrams with the proportion of the results occurring in selected intervals (<0.1; 0.1-1; 1-10; 10-50 and >50 ng E2 equivalents/L). In Figure 5.2 an example of such a graphical presentation is given for the total set of biological data for total estrogenicity (as E2-equivalents) i.e. the data presented in Table 5.1. In the tables and figures in the forthcoming chapters where medians and percentiles are calculated, these values are based only on data >LOD. This does lead to slightly conservative statistical estimates in the cases where non-detects are a significant part of the total number of samples in a category as in category A and F, and in environmental samples. In Appendix 6 re-calculated versions of the results presented in Chapters 6 and 7 can be found. The data have been re-calculated in accordance with the format used for presentation of point source data in the national Danish environmental monitoring programme, NOVANA. This implies that all data (including those <LOD) have been used for calculation of median and average values and 95% percentiles.
Figure 5.2 Presentation of all bioassay data for total estrogenicity as relative distribution between concentration categories ranging from levels <LOD to level >100 ng/L. 6 Sources of estrogens6.1 Wastewater treatment plants (W WTPs) 6.1 Wastewater treatment plants (W WTPs)The estrogenic activity in municipal wastewater has been investigated in samples from 36 WWTPs divided into 6 categories, A-F, based on their process technology as described in more detail in Chapter 2. A total of 12 plants, two within each category, were selected for more detailed examination of variations in effluent quality and were sampled four times each during the project, while the other locations were only visited once. Effluent samples were taken each time at all plants, while influent samples were only taken once (early summer), and only at the 12 WWTPs selected for more detailed examination. All samples have been tested for their estrogenic activity by the YES assay, while only the samples from the 12 specially selected plants were also analysed chemically The samples have been analysed according to the previously described strategy and methodologies. Thus, for every sample two results from the YES assay exists (free and total estrogenic activity), and for the samples on which chemical analysis are performed, four estrogen species are determined with and without enzymatic treatment. The eight chemical values are recalculated into two corresponding results for estrogenic activity to allow comparison to the YES assay. The response factors used, relative to 17β-estradiol (E2), are for estrone (E1) 0.29 and for 17α-ethynylestradiol (EE2) 0.88. Estriol has also been tested, but its potency is very low (< 0.01). In the tables below, only data for the total estrogenic activity is given for the bioassay and for the calculated activity expressed as E2-equivalents (EEQ) based on chemical analysis. The detailed data for each of the specific steroid estrogens can be found in Appendix 8. Septic tank effluent data are not presented in this section, but in Section 6.3 under "Open land sources". 6.1.1 InfluentsThe influent data from the 12 selected WWTPs are presented in Table 6.1 and 6.2 for free and total (free + conjugated) estrogens, respectively. Estrogenic activity was detected in all influent samples. As it appears from the table, there is no systematic trend in the figures for the six plant categories, and it should be kept in mind that the selection of WWTPs for the detailed investigations did not include criteria related to the possible differences in estrogenic load. The average of the median results on total estrogenicity is 55.3 ng/L for the bioassay, and 28.8 ng/L for the chemical analysis. This difference is, based on the result of the comparison of control samples (Section 4.3.3), not statistically significant. A somewhat higher total estrogenic activity based on the bioassay seems probable as the test result includes all chemical substances with estrogenic activity, also those not determined by the chemical method but potentially present in the samples. Table 6.1 Median and max. content of free and total estrogenic activity in the influents to wastewater treatment plants in categories A-F. Measured with YES-assay and given as ng Estradiol equivalents/L. N, the number of samples, is separated into values <LOD, values >LOD, and all values.
Table 6.2 Median and max. content of free and total estrogenic activity in the influents from wastewater treatment plants in categories A-F. Three Individual estrogens measured chemically and recalculated to ng Estradiol equivalents/L. N, the number of samples, is separated into values <LOD, values >LOD, and all values.
The bioassay results for free and total estrogenic activity, respectively, are not systematically different, and hence they provide no indication that significant amounts of conjugated estrogenic species are present in the influent. The chemical results confirm that conjugates in untreated wastewater do not constitute more than a few percent of the total content of the measured steroid estrogens at the inlet to WWPTs. The chemical analysis confirm the results from studies published in the international literature that E1 (estrone) is the quantitatively dominating steroid estrogen in wastewater followed by E2 (17β-estradiol), for which the influent concentrations in this study are typically about 30% of those of E1. Ethynylestradiol is detected with the chemical analysis in seven of the 12 influent samples, but concentrations are relatively modest - up to 3.8 ng/L (total estrogens) - contributing 10% or less to the total E2 equivalents. 6.1.2 Effluents6.1.2.1 ConcentrationsThe results of the bioassay tests and chemical analyses of WWTP effluents are shown in Tables 6.3 and 6.4, and presented graphically in Figures 6.1-6.3. It should be noted that the results from the bioassay are not directly comparable with the chemical data as bioassay data exist from all 36 WWTPs, while chemical analyses have only been performed on samples from the 12 plants selected for more detailed examination. At the modern(ised) WWTPs in categories A and B, activated sludge systems are installed for removal of nitrogen by nitrification/denitrification or nitrification only (MBND and MBN plants; Cat. A and B, respectively). The estrogen levels in the effluents from these plants are only a few ng/L, as appears from the tables, and in 25% of the samples from Cat. A, the levels are even below the detection limit (Figure 6.1). It should be noted that these samples come from the same WWTP. Also the simpler treatment technologies such as reed beds and biological sand filters perform well, in particular the latter (Cat. F) for which only half the effluent samples contained detectable levels of estrogenic activity (Figure 6.1). In contrast to these, the effluents from the less advanced traditional treatment plants with biological-mechanical or only mechanical treatment of the wastewater (categories C and D, respectively) contain high levels of estrogens. The effluent levels are practically indistinguishable from the influent levels and, thus, these treatment technologies appear not to be capable of eliminating estrogens to any significant extent. In more than 100 effluent samples from a broad range of WWTPs we only found EE2 in concentrations exceeding 1 ng/L in seven samples from six WWTPs representing all categories except B. Due to its potency EE2 does occasionally account for a significant part (50%) of the estrogenic activity as measured in E2 equivalents, but most often approx. some 60-70% of the activity derives from E1 and 30-40% from E2. Table 6.3 Median and max. content of free and total estrogenic activity in the effluents from wastewater treatment plants in categories A-F. Measured with YES-assay and given as ng Estradiol equivalents/L. N, the number of samples, is separated into values <LOD, values >LOD, and all values.
Figure 6.1 Distribution of samples between ranges of estrogenic activity in the categories A-F of WWTPs. Based on results in ng E2 equivalents/L calculated from total estrogenic activity measured in the YES assay. Table 6.4 Median and max. content of free and total estrogenic activity in the effluents from wastewater treatment plants in categories A-F. Three Individual estrogens measured chemically and recalculated to ng Estradiol equivalents/L. N, the number of samples, is separated into values <LOD, values >LOD, and all values.
Figure 6.2 Logarithmic plot of Median and range of estrogenic activity in WWTP category A-F effluents as determined by the YES assay. Box upper bound represent 75 percentile, the lower bound the 25 percentile, and the line is the median value. The upper bar is the maximum value and the lower bar the minimum detected value. Non-detects are not included.
Figure 6.3 Logarithmic plot of Median and range of estrogenic activity in WWTP category A-F effluents as determined by chemical analysis. Box upper bound represent 75 percentile, the lower bound the 25 percentile, and the line is the median value. The upper bar is the maximum value and the lower bar the minimum detected value. Non-detects are not included. 6.1.2.2 Correlation with general performance parametersThe performance parameters for the individual WWTPs were compiled during the site selection phase of the project. A direct comparison between the estrogen data and the performance data is therefore not possible. However, data on the design capacity and current load, on performance parameters such as COD, BOD, total-N, total-P and suspended solids (SS) has been compared to the WWTPs' concentration of total esrogenic activity in effluents. An overview a selected few of the results for A-F categories are shown in Figure 6.4 below.
Figure 6.4 WWTP capacity and effluent performance parameters including estrogenic activity (YES) of the investigated 36 WWTPs (sorted by location number; A =1-10; B = 11-16; C = 17-22; D = 23-28; E = 29-32; F = 33-36). For Y-axis units, see legend box. From the general data on mean effluent quality of the WWTPs it has not been possible to detect any significant correlation with the measured estrogenic activity in the effluents. In Figure 6.4 above only capacity and nitrogen is compared to estrogenic activity. If one excludes Category F (biological sand filters), which appear most to the right in the graph, there seems to be a reverse correlation between capacity ("size") and estrogenic activity i.e. the small plants have more estrogens in their effluents than the larger plants. Similarly, some coincidence with the level of total nitrogen in the effluents is found. These parameters are not independent variables as the largest plants are also the most advanced in terms of tot-N and/or ammonia removal, typically receive more homogenous wastewater and are operated in the most efficient way, factors that in themselves should imply better performance. 6.1.2.3 Geographic variationsThe geographic localisation of the WWTP effluent data based on total estrogenic activity as determined by the YES bioassay are presented on the map in Figure 6.5. The map shows that there is no geographic trend in the effluent data. Effluent quality is, as demonstrated by the data in Section 6.1.2.1, mainly dependent on the treatment technology applied. A geographic variation in wastewater composition with impact on estrogenic activity is not expected, although parameters such as water hardness may vary. A demographic variation may be expected e.g. due to a relatively younger population in urban areas with less women in menopause and increased use of anti-contraceptive pills, but if such an effect exist it is masked by the increased occurrence of WWTPs of high efficiency.
Figure 6.5 Map of the localisation of the WWTPs with indication of the estrogenic activity in their effluents. For the 12 WWTPs where more than one effluent sample were taken, the mean concentration has been used for the map. 6.1.2.4 Seasonal variationsSeasonal variation of estrogenic activity in influents is not expected and has not been studied. However, in the inlet to a reed bed facility two influent samples were in fact taken during sampling 3 and 4 (summer and fall influent samples from plant E30). The results show no dramatic differences for total estrogenic activity: 57.9 vs. 43.7, or for free estrogens: 60.1 vs. 44.7 ng/L. Figure 6.6 Bar diagrams of total and free estrogenic activity (ng E2 equiv./L) in WWTP samples with four effluent samples Taken over eight months. The influent sample was taken during the third sampling (summer) and is shown first in each panel (A-1 is not shown as no estrogenic activity was detected in any sample. The influent to F-33 was not possible to sample). The observation from Figure 6.6 is again that most treatment technologies remove estrogenic activity except the C and D facilities, where influents and effluents do not differ. The variation in the free/total estrogenic activity ratio of the effluent does not appear to be related to the season, likewise free and total activity in the effluent samples are not related to season. 6.1.3 Species of estrogens and their distributionIn almost 100 effluent samples from a broad range of WWTPs we detected estrogenicity with the YES-assay in almost all samples. Estrone (E1) occurred in 53 of the 55 samples that were analysed chemically. In these samples, the median concentration of E1 was 9.9 ng/L. Similar data are listed for all steroid estrogens in Table 6.5 for sewage effluent and it can be calculated that E2, E2 and EE2 were detected in 42%, 29%, and 55% of all samples. Based on median concentrations we see that the concentrations of the analytes occurred in the following order: E1>E2>E2 >EE2. By calculating the ratios between the concentration of E1 and the other analytes the relative importance of each analyte can be assessed. Within the selection of samples representing 10-90 % percentiles of the ratios between E1 and the other compounds, E1 occurred at concentrations that were 3-16.5, 6.7-59 and 2.2-173 times higher than those of E2, E2 and EE2 respectively. In sewage effluent samples that were analysed chemically, it was found that in 50% of all samples E1 contributed with more than 79% of the total estrogenicity in each sample. Similarly we found that in only 15.7% and 12.2% of effluent samples more than 50% of the estrogenicity measured in the sample was due to E2 or EE2, respectively. Thus we can conclude that E1 in most effluent samples was the primary cause of the estrogenicity observed. The relative amount of steroid estrogens excreted from humans has been studied by D'Ascenzo (2003) who report that E1 account for around 65% of the release of steroid estrogens. If these numbers are corrected for the relative estrogenicity, E1 contribute with only 35% of the total estrogenicity. Therefore the high impact from E1 in the samples of the current project may be surprising. This may be explained by the oxidation of E2 to E1, a process which has been frequently reported (Lai et al., 2000; Colucci et al., 2001). Table 6.5 Presentation of chemical results for measurement of total estrogens in WWTP effluents (in ng E2 equiv./L). N<Lod denotes the number of samples where estrogens were detected at concentrations below the limit of detection and n>lod the number of samples above limit of detection. Nsamples is the total number of samples analysed. Median concentrations (ng/L) are calculated on basis of results above LOD.
In contrast to the other steroid estrogens analysed in the current project, EE2 is a synthetic substance and the compound has therefore gained special attention (see eg., Larsson et al., 1999). In more than 100 effluent samples from a broad range of WWTPs we only found EE2 in concentrations exceeding 1 ng/L in six samples from five WWTPs in the C-F categories. 6.2 Conditions in water courses receiving WWTP effluents6.2.1 Upstream and downstream estrogenic activityIt is anticipated that the discharge of WWTP effluent in water courses will lead to elevated levels of estrogenic activity. The levels of estrogenic activity in the receiving streams/rivers are much lower than in the effluents with only a few samples above 5 ng/L. Also, the proportion of samples below the detection limit is 28-32% with more frequent detections in the downstream samples (Figure 6.7).
Figure 6.7 Distribution of samples between ranges of estrogenic activity upstream and immediate downstream (10 x stream width) of WWTP discharge points. Based on results in ng E2 equivalents/L from total estrogenic activity measured in the YES assay. In the following Table 6.6, the estrogenic activity is shown for samples taken at the WWTPs: upstream, effluent and downstream 1 and 2 at distances approx. 10x width of stream and 100x width of stream, respectively. The total and free activity as determined by the YES assay is shown in Figure 6.8. Additional upstream/downstream data can be found in the previously presented figure on seasonal variations (Figure 6.6, section 6.1.2.4). An analysis of a total of 46 data sets from 34 out of the 36 WWTP locations and their receiving streams (one data set missing (L-19), one discarded (L-26)) shows that in 24 cases out of 35 where estrogenic activity was detectable (68%), the level of estrogenic activity at the downstream 1-position was higher than the upstream level. In five cases the levels were equal, while in six cases (17%) the upstream concentration was the highest. The chemical analysis of estrogens show that the predominant species is E1with E2 accounting for up to 30% of the activity. EE2 is only found in six samples of 37 samples from the waters receiving treated waste water (L17, 18, 29 and 33). The concentrations ranging up to 0.7 ng/L represent a contribution to the estimated estrogenic activity of 25-75% compared to other steroid estrogens. Table 6.6 Up and downsteam estrogenic activity in water courses receiving Effluent from a range of waste water treatment plants . U: Upstream, E: Effluent, D1: First downstream sample, D2: Second downstream sample.
6.2.2 Seasonal variation in receiving watersThe water courses receiving effluents from the 12 WWTPs selected for more detailed examination were targeted with sampling programme for seasonal variations involving two sampling campaigns at each selected site. The effluent sites were sampled upstream of the discharge points of the WWTP effluents and downstream at a distance corresponding to about 10x (in some cases also 100x; see Section 2.2 for details) the width of the river/stream. These samples are grouped under Category L. In Table 6.7 below a comparison is made between sets of Category L-samples taken at the same location either winter+summer or spring+fall to evaluate a possible systematic seasonal variation in the data. Table 6.7 Comparison of estrogenic activity in receiving waters of WWTP effluents measured in pairs of samples from two samplings performed either winter-summer or spring-fall.
* The estrogenic activity was below the detection limit in all L1-samples In 11 of the 12 samples taken, estrogenic activity was detected in at least one sample (total of 11 sites). The samples taken winter-summer or spring-fall show that at the five sites for which winter-summer data are available, the summer samples are higher. The picture in the spring-fall samples is less clear, but may be interpreted as highest level at the sampling time in the fall. There is no observable pattern in the free-to-total ratio of estrogens over the seasons. Absolute values are up to 3 ng/L total estrogenic activity.
Figure 6.8 Seasonal variation in Up and downstream free and total estrogenic activity in water courses receiving Effluent from wastewater treatment plants of different categories. Samples were taken on two occasions. U: Upstream, E: Effluent, D1: First downstream sample (10x stream width) D2: Second downstream sample (100x stream width, not always available). 6.3 Open land sourcesThe possible sources in the open land to contamination of the aquatic environment with estrogens constitute a quite diverse group (location categories G-K):
The results from categories G-I are presented in Table 6.8 and Table 6.9, while a table has not been created for category J because it contains only two data. Category K results are presented in table 6.10. A graphical presentation of the data from all five categories is made in Figure 6.9. In the five open land source sub-categories the proportion of samples without detectable estrogenic levels varies from 0 to 67% (100% including cat. J). It should be borne in mind that direct comparison of the median levels between categories is based only on the detected levels, which in the case of a significant number of non-detects will lead to conservative estimates of median values. For Category G, a total of eight samples (including surrogate samples) were tested by the YES assay and analysed chemically. It is noted that the observed estrogenic activity is somewhat higher than the average of WWTP effluents described in Section 6.1.2. This may be caused by the very limited degradation in the tanks and a relatively higher share of human urine and faeces in the effluents. In category H, drains from fields where manure was applied approximately 2 weeks before the sampling in the spring of 2004 (second sampling in September 2004), there are positive detections in 4 of the 8 samples, and in these samples the levels of total estrogens determined by the bioassay are low; from 0.1 - 1.1 ng/L. In category I, drains from fields amended with sludge before the first sampling in the spring of 2004, only five samplings from three locations have been possible to carry out during the study period. However, all five contain quantifiable levels of estrogenic activity. The results are shown in Table 6.8 and 6.9. In four of the five samples the total levels of estrogenicity range from 0.2-3.8 ng/L, while one sample (sampling in the fall at the same location where 3.8 ng/L was found in the spring) contained as much as 32 ng/L. This level is remarkably high, not least considering that the sample was taken several months after the sludge amendment, and therefore leads one to suspect that the drain also transports effluents from one or more farmhouses. The estrogenic activity measured by YES assay in the manure amended fields was low and caused by E1. It was not attributed to occurrence of the tracer for livestock E2, which also has a low potency. EE2 was detected in two open area sources: in a drain from fields treated with manure and in a septic tank effluent from isolated houses. Category J, retention basins for separate system urban stormwater, was only sampled once as the results showed that the runoff contained no estrogenic activity as determined by the bioassay. With regard to the fish farm data it is noted that at the spring sampling the levels were low at both locations and no systematic differences between levels up- and downstream the discharge point was apparent. In the fall, only the farm with mixed production (including rearing of sexually mature adults) was sampled, and a somewhat higher general level of estrogenic activity was observed compared to the spring as well as a more marked increase in downstream level as compared to the first sampling. Table 6.8 Median and max. content of free and total estrogenic activity in the septic tank effluents from isolated houses and in drains from fields amended with manure and sludge respectively. Measured with YES-assay and given as ng E2 equivalents/L.
* Category supplemented with influent data from F category Table 6.9 Median and max. content of free and total estrogenic activity in the effluents from isolated houses and in drains from fields amended with manure and sludge respectively. Three Individual estrogens measured chemically and recalculated to ng E2 equivalents/L.
* Category supplemented with influent data from F category Table 6.10 Estrogens in receiving waters up- and downstream discharge points from fish farms. Na = not analysed.
Figure 6.9 Distribution of samples between ranges of estrogenic activity in the categories G-K of sources in the open areas. Based on results in ng E2 equivalents/L from total estrogenic activity measured in the YES assay. 7 State of the environment7.1 Overall results 7.1 Overall resultsThe overall results from the sampling in streams and lakes of different categories are shown in Table 7.1 and presented graphically in Figure 7.1. The division of the streams and lakes into sub-categories is explained in Section 2.2.3 but one additional comment should be given here. For the purpose of the overview tables (Table 7.1 and 7.2), the anticipated 'generally exposed' upstream samples from streams/rivers receiving WWTP effluents (Cat. L) have been added to the data from the generally exposed/affected streams/rivers category (Cat. M). The cases chosen were those where the discharge points were situated outside urban areas. The remaining upstream L-samples from WWTPs in urban areas have been given their own sub-category in Table 7.1 and 7.2, called Lu(U) (lower case "u" for upstream, upper case "U" for urban). It should be borne in mind when directly comparing the median levels between categories, that they are based only on the detected levels, which in the case of a significant number of non-detects will lead to conservative estimates of median values. E.g. if samples below detection limit were given the value zero in category M the median would shift towards 0.35 from presently 0.5 ng/L. The non-detects are, however, included in the graphical presentation of results in Figure 7.1. Table 7.1 Estrogenic activity of free and total estrogens in various sub-categories of the aquatic environment in Denmark.
* The results from one location - 84 and 80 ng/L for free and total estrogens, respectively - were discarded as artefacts.
Figure 7.1 Distribution of samples between ranges of total estrogenic activity in the categories M-P from the aquatic environment. Based on results from total estrogenic activity measured in the YES assay. Table 7.2 Free and total estrogenic activity in various sub-categories of the aquatic environment in Denmark.
In all sub-categories of freshwater aquatic environments the median levels of total estrogenic activity as measured by the YEs assay are below or at 1 ng/L and, overall, in about one third of the samples the level is below the limit of detection. Reference streams have the lowest level of all categories while samples from reference lakes are found to exhibit estrogenic activity at or near the same level as that of presumably more affected lakes. The origin of the observed estrogenicity in the reference lakes (e.g. from phyto-estrogens) has not been investigated. The "hit rate" i.e. the number of samples with quantifiable estrogenicity compared to the total number of samples is slightly higher in categories N and O (streams and lakes in areas with high density of cattle/pigs) than in the other sub-categories. In the M, P, Q and R categories the number of samples without detectable estrogenic activity constitute from 25% to more than 50% of the samples. Thus, 'clean' samples are prominent in surface waters, and in particular in the P and R categories (reference streams and generally exposed lakes, respectively). The highest level of total estrogenicity detected is 8.2 and 8.8 ng/L for free and total estrogens, respectively. Both findings originate from the same sample from a stream on the island of Funen. It should be added, however, that the other sample taken in the same stream only showed an estrogenicity level of 0.4 ng/L (for both free and total estrogens). The chemical species found ot the aquatic environment was typically E1 and rarely E2. In one case EE2 was also found in the aquatic environment. The considerable EE2 concentration of 3.7 ng/L, for which no explanation can be given at present, was measured in a sample from a "generally exposed" lake (Cat. R). 7.2 Geographical distributionThe data on total estrogenic activity (YES assay) in all categories of streams and lakes and their geographical distribution throughout Denmark are illustrated in Figure 7.2. The data give no indications of systematic regional differences due to geological conditions or differences in land use at the macro-level, except maybe for a slight indication of generally higher estrogenicity levels in the streams and lakes of the island of Funen.
Figure 7.2 Overview of total estrogenic activity in Danish streams and lakes. For the locations where more than one sample have been taken, the mean concentration has been used for the map. Levels given in ng E2 equiv./L. 7.3 Seasonal/temporal variationThe seasonal variation of estrogenic activity in the aquatic environment is shown in Table 7.3 for the categories with detection of estrogenic activity in at least one sample. Samples were taken in "pairs" at each location i.e. either "winter-summer" or "spring-fall". Table 7.3 Number of samples displaying difference in free and total estrogenic activity during the season is shown with indication of time of highest level.
In general., no systematic pattern of seasonal variation is evident for the spring-fall samples, but in the winter-summer sample pairs the summer samples appear to display higher estrogenic activity. In 13 of the cases the difference between the two seasonal samples are below 0.5 ng/L, which, in consideration of the RSD of 29%, should be interpreted as a non-significant difference. The pattern for free estrogenic activity was almost similar. In the category for diffusely polluted streams (M) the data set is shown in Table 7.4 with mean and standard deviation calculated for two seasons. Table 7.4 Seasonal variation in YES assays estrogenic activity in samples from category M, generally exposed streams. M1 samples are Winter/spring and M2 are Summer/fall.
A tentative interpretation, given the fact that the total activities are equal in early and later samples, could be that the proportion of free estrogens are higher in the summer/fall samples than in winter/spring samples. 8 Discussion of the results8.1 Sources of estrogens 8.1 Sources of estrogens8.1.1 Wastewater treatment plantsInfluent estrogenic activities and steroid estrogen concentrations were measured once (summer) at each of the 12 WWTPs (out of a total of 36 plants) that were selected for closer examination. The levels, reported as E2-equivalents (EEQ), varied somewhat but stayed in most cases within a range of 20-90 ng EEQ/L (with one extreme result at 385 ng EEQ/L). It has not been possible to correlate the concentrations with size or character of the catchment (to the extent that this has been known). The effluent quality with regard to steroid estrogens was, however, clearly dependent on the applied process technology, and the importance of the activated sludge systems was evident (categories A and B). Trickling filters and simple retention tanks (categories C and D) did not contribute much to removal of estrogenic activity. That the Cat. D plants appear to perform slightly better than the Cat. C plants is considered purely incidental but might be associated with the fact that the influent levels at the two category D-plants were very low. These findings are in line with the results obtained in a German investigation at 16 municipal WWTPs (Körner et al., 2001; Spengler et al., 2001), a Swedish survey of WWTP effluents from 20 treatment plants representing a range of technologies (Svenson et al. 2003), and the information on estrogens in WWTP effluents presented in the review report on feminisation of fish prepared by Christiansen et al. (2002) for the Danish EPA. It appears that the process technology needs not to be very advanced in terms of requirements to investments and costs of operation in order to produce fine results. In this study, the effluents from reed beds (category E) and, in particular, biological sand filters (category F) contain very low levels of estrogenic activity. It has previously been demonstrated by researchers in Japan that a sand filter installed for (pilot-scale) tertiary treatment of a WWTP effluent did not significantly reduce effluent estrogenicity (cfr. Christiansen et al. 2002). This is, however, not regarded contradictory to the high removal efficiency of biological sand filters observed in this study since a traditional sand filter for tertiary treatment has a very short hydraulic retention time (HRT) and practically exclusively act as a physical filter, while the biological sand filter treats influent and not effluent, has a much higher HRT and contains an active microbial biomass, which transforms organic matter, nutrients and many specific substances. No correlation with the general performance parameters from each of the sampled WWTPs (effluent quality in terms of COD, BOD, SS, N and P) could be revealed. This does not necessarily mean that such correlations do not exist but apparently measurements in the same samples as the estrogens are required to elucidate them - it is not enough to compare with average general performance data as was done here. Stormwater overflow episodes were not investigated in this study because it is possible to predict discharge concentrations from influent data and typical dilution factors of the system in question. As a rule of thumb a dilution factor of 5 can often be used, which, if using the influent levels observed, implies that the level of estrogenic activity in stormwater overflows typically will be about 5-20 ng/L. 8.1.1.1 Steroid estrogens and their forms in wastewaterThe relation between the free estrogens and the total estrogens (free and conjugated estrogens) are shown in Figure 8.1 and Figure 8.2. The full drawn lines indicate where measurements of total and free estrogens are equal and an almost full agreement between free and total estrogens was observed. Thus, in general free estrogens make up 90-100% of the total estrogens in the samples. The samples with conjugated species reveal themselves by occurring above the line of unity. Samples taken from the open land sources and the aquatic environment (G-R) rarely contain more than 10% conjugated estrogens, and in most environmental samples almost 100% of the total estrogenic activity can be attributed to free estrogens. The samples taken directly in the WWTP effluents are somewhat higher in the concentration of conjugates, and often display a 20 % contribution from the conjugated species when concentrations exceed 5 ng/L. All values are included in Figure 8.1 with an expansion of the 0-12 ng/L range in Figure 8.2.
Figure 8.1 Comparison of total and free estrogens determined in YES assay.
Figure 8.2 Expansion of the lower range 0-12 ng/L of the data set. Therefore the concern that a major part of the potential aquatic estrogenic activity occurs in a form that is mobilised during deconjugation is not supported with the present data. By far the highest activity of a water sample from the environment will be found in the free estrogenic fraction compared to the conjugated. With regard to the chemically analysed steroid estrogens in can be concluded that in WWTP effluents E1 is in most samples the main contributor to the estrogenic activity observed followed by E2. Only occasionally did EE2 occur at a significant level. 8.1.1.2 Environmental load of estrogens from WWTP effluentsIt is relevant to consider the overall release of estrogens from anthropogenic sources to the aquatic environment and the relative importance of the various sources. For the WWTPs so many data exist that a rough estimate of the total load and the relative share of each of the WWTP categories A-F can be made. Table 8.1 presents such an estimate of the relative share of each WWTP category to the total emission of estrogens with WWTP effluents to fresh surface waters and coastal waters in Denmark. The estimate is based on the median level of total estrogenic activity in the YES assay for each category (calculated as ng E2 equivalents/L) including the non-detect results, which for this purpose have been assigned the value of 0.025 ng/L (= ½ x LOD for the YES assay). These data have then been combined with the most recent data on wastewater volumes (average of last three years, 2001-2003 = 713 mill. m3) and distribution on categories (2003 data) from the national Danish surveillance programme for the aquatic environment (Miljøstyrelsen 2004). The total emission of estrogens with WWTP effluents to the aquatic environment in Denmark can hereby roughly be estimated to less than 3 kg E2 equivalents/year. This corresponds to about 10 % of the calculated total excretion of estrogens by the Danish population (based on data given in Christiansen et al. 2002, p. 84). Table 8.1 The relative contribution by category to the estimated total load of estrogenic activity from the Danish WWTPs to the aquatic environment (marine as well as freshwater). Based on national wastewater data from 2003 (Miljøstyrelsen 2004).
* Based on all data (only one value per WWTP) including non-detects, for which a value of 0.025 ng/L (= ½ x LOD for the YES assay) has been used. As can be seen from the table, the A and B categories, i.e. the most advanced treatment plants, contribute, despite their good elimination efficiency, with more than 83% of the total estrogenic activity released from Danish WWTPs because they are responsible for more than 97% of the total effluent volume. Category C and D plants are responsible for about 16% of the activity despite their modest 2.2% share of the total effluent volume, while the emissions from categories E and F are negligible in the overall picture. It should be stressed, however, that a major part of the effluent volume from the A and B plants (probably more than 70%) is released directly into the marine (coastal) environment and thereby does not contribute to the load on the freshwater systems. The share of Category C and D effluents being discharged into the marine environment is believed to be considerable lower than for A+B, and therefore the relative importance of these two categories in relation to the freshwater environment becomes even more pronounced. 8.1.2 Drains from manure treated fieldsAll mammals excrete natural estrogens and therefore, significant amounts are released from household animals (cattle, swine, and poultry). Raman et al., (2004) recently reported representative concentrations of estrogens in animal waste in the range 1-100 µg/L. The concentration is dependent of the animal type and the manure storage procedures. When manure is spread on agricultural soil, it is an obvious risk that the estrogens are transported to the aquatic environment. Although the substances has been shown to absorb and dissipate strongly (half-lives range from hours to a few days) in soil (Lee et al., 2003), studies linking estrogens detected in the environment directly to animal sources (Finlay-Moore et al., 2000; Peterson et al., 2000) and the total amount of estrogens released gives reason to believe that the steroid estrogens from farm animals may reach the surface waters. It is therefore anticipated that estrogens from household animals may reach the environment due to transport mechanisms including binding to colloids and transport through macro-pores in the soil. In the current project, the estrogenic activity in drainage water from fields where manure was applied in the late winter/early spring of 2004 (Cat H), was below the LOD in 4 out of 8 samples while in the remaining 4 samples the levels were 0.1-1.1 ng/L. The sampling was carried out in the spring, shortly after application had taken place, and again in the fall (late September). Due to the few locations sampled and only two samples taken at each site, possible pulses with higher concentrations of estrogens (as known from investigations of pesticide transport to the aquatic environment via drainage systems) may very well have been overlooked. Thus the data must be described as inconclusive though none of the results from the testing and analysis of samples from the aquatic environment indicate that severe estrogen contamination originating from manure applied to fields occur widespread. 8.1.3 Other open land sourcesSeptic tank effluents from single farmhouses (Cat. G) were expected to be quite "dirty" and they have also been shown to contain about the same estrogenicity as the influents to WWTPs in categories A-F. Drainage water from three fields amended with sewage sludge in 2004 (Cat. I) was sampled in the spring and again in the fall (late September). All the samples contained steroid estrogens at a level above the LOD. At two of the sites the levels were below 1 ng/L, but in one case 32 ng/L was found in the September sample while the spring sample from the same drain contained 3.8 ng/L. This result can only be logically explained if it turns out that also effluents from one or more households are connected to the drainage system. As the drainage data from the manure treated fields also the data for the sludge treated fields are considered inconclusive due to the few locations sampled and few samples taken. The two samples of stormwater effluents from separate systems (Cat. J) did not contain any appreciable amounts of estrogens, and a possible low level of estrogens is probably rather due to xenoestrogens than steroid estrogens. This expectation corresponds well with the findings in the Netherlands reported by Vethaak et al. (2002). Effluents from two fish farms (Cat. K) only displayed little estrogenicity but the sampling carried out in the fall indicated that fish farms that rear adult fish for production of eggs or fry may have higher levels in the fall where a larger number of the fish are sexually mature. An alternative explanation of the higher estrogenicity in the fall samples could be that hormones have been used in the production (this hypothesis has not been verified). 8.1.4 Geographical variationThere were no signs of systematic geographic variation in the results from neither the categories A-F (WWTPs) nor the categories G-K (open land sources). Such differences are not likely to occur with regard to the categories A-F (and G, which actually is a kind of WWTP) because Denmark is a small and demographically very uniform country, i.e. the cultural and technological regional differences are likely to be correspondingly small. With regard to geographical variation in categories H-K, and in particular in the categories H and I (the field drains), some geographical variation may exist but has not been possible to elucidate within the framework of this study. 8.1.5 Seasonal variationThe data set from WWTPs is quite comprehensive (winter, spring, summer and fall samples at 12 WWTPs), and it is clear that the estrogenic activity in the winter samples are lower than in the summer samples, but otherwise there is not a clear pattern. However, the four samples taken at each of the two low tech treatment facilities (C and D) sampled for seasonal change all show a clear increase in estrogenic activity in the spring samples compared to the winter samples. No clear seasonal variation is observed in the A, B or F categories while there is a slight tendency in the E category for the estrogenicity to increase from the winter/spring samples to the summer/fall samples. There has been found no evident explanation for these observations. With the limited number of samples taken in the G-K categories it was not possible to reveal seasonal variations, if any. As mentioned before, effluents from fish farms with sexually mature fish should, theoretically at least, display more estrogenicity in the fall compared to the spring. 8.2 State of the aquatic environment8.2.1 General state of the aquatic environmentAbout 130 samples (categories M-R plus upstream samples from streams receiving WWTP effluents (category L)) have been sampled and tested by the YES bioassay to determine the state of the Danish aquatic environment with regard to total estrogenic activity. A limited number of samples (47) were also analysed chemically. In one third of the samples there was no detectable estrogenic activity while in about half of the samples the estrogenicity was low; from the LOD up to 1 ng/L. In all sub-categories except "generally exposed lakes" (category R), the median estrogenic activity of the samples with detectable estrogenic activity (i.e. > LOD = 0.05 ng/L) was 0.6 ng/L or lower. In the "generally exposed lakes" category, the median level of estrogenicity was 1 ng/L for the 4 out of 9 samples with detectable estrogenic activity. There is a slight tendency that in the samples taken in streams and lakes situated in areas with known high density of pigs and cattle (categories N and O), and thereby significant need for disposal of manure onto fields, a higher frequency of detection than in the other categories was observed. This weak trend was, however, not accompanied by a correspondingly higher median level of estrogenic activity. 17α-estradiol was detected in too few samples to allow any correlations with husbandry intensity to be drawn. This corresponds with the findings of Vethaak et al. (2002) in the Netherlands. If discarding one inexplicable result of 80 ng/L (presumably an artefact since the result could not be repeated), only 25 of the 130 samples showed a total estrogenic activity of more than 1 ng/L, hereof four samples above 5 ng/L with a maximum of 8.8 ng/L. In 18 of the 25 samples containing >1 ng/L, the estrogenic activity was below 2 ng/L. These results compare quite well with literature data from investigations or surveys undertaken in other European countries. Thus, Fawell et al. (2001) analysed water from 8 sites in the Severn and Trent rivers in the UK and found E2-equivalent (EEQ) levels from <0.01 ng/L to 2.3 ng/L. Murk et al. (2002) studied the estrogenic activity in Dutch surface waters (4 sites) by means of (among others) the YES assay and found activities of free estrogens from about 0.4 to 3.0 pmol/l corresponding to 0.1-0.8 ng EEQ/l. Other European investigators report results of chemical analyses of steroid estrogens in surface waters (e.g. Vethaak et al. 2002; Williams et al. 2003), and generally find levels of E1 and E2 in the sub-ng/L or low ng/L range. Most often E1 is observed but also E2 is detected regularly. EE2 is uncommon to find in most surface waters. These findings are in line with the results of this study, An American survey of exposed rivers and streams (Kolpin 2002a) operates with too high detection limits (typically 5 ng/L) to enable direct comparison with our results, but positive detections are also here only found in 5-21% of the samples. 8.2.2 Streams receiving WWTP effluentsThe streams receiving WWTP effluents appear to be typical of Danish streams/rivers when looking at the upstream levels of estrogenic activity and comparing to the data in the other freshwater environment categories (M-R). A total of 46 data sets were available for an evaluation of whether the effluent discharges result in a measurable impact on downstream water quality. In 11 of the data sets no estrogenic activity could be found neither up- nor downstream but among the remaining 35 data sets 24 showed an increase downstream (10x stream width) the discharge point while only 6 samples showed the opposite. In 5 samples the up- and downstream levels were identical. A possible impact on water quality further downstream (100x stream width) has not been possible to deduct from the data obtained in this study. However, the impact of wastewater effluent discharges on downstream water quality in the receiving rivers or streams was generally rather limited; only in 13 of the 24 cases where downstream levels were elevated did the increase exceed 0.5 ng/L. But in extreme cases (high estrogenicity level in discharge, low dilution in stream) significant increases will be possible. One such example exists among the data where the discharge of a category D plant effluent at 47 ng/L into a very small stream resulted in an increase in the estrogenic activity in the stream from 1.1 ng/L upstream to 31 ng/L downstream the discharge point. 8.2.3 Reference streams and lakesThe estrogenic activity in the reference (background) streams was generally very low i.e. from <LOD to 0.3 ng/L in all cases except one, where a total level of 7.3 ng/L was found (but no free estrogens, therefore maybe an artefact). In more than 50% of the stream reference samples (6 out of 11), the estrogenic activity was below the LOD. In the reference lakes it was possible to detect esrogenic activity in 9 out of 11 samples and the median level among these was higher than in the streams (0.4 ng/L against 0.1 ng/L). In 4 of the 12 samples the levels were above 1 ng/L and one sample contained 6.0 ng/L (and the second sample at that site 1.5 ng/L) although no anthropogenic activities including husbandry were apparent at the site in question (forest lake). In summary, the results from the reference sampling stations indicate that estrogenic activity at a low level is often present even at locations where the anthropogenic influence is not apparent. The explanation could be that other sources and types of estrogens (e.g. natural estrogens such as phytoestrogens) exist that give a response, albeit small, in the YES assay. 8.2.4 Geographical variationIt has not been possible to find any clear regional differences or correlations between soil types or land use and estrogenicity in the aquatic environment. To establish such possible relations, if possible at all, a much more focused investigation with many more samples per site than was possible in this study is probably required. 8.2.5 Seasonal variationAs is the case for WWTP effluents, also the samples from the freshwater environment appear to exhibit slightly higher estrogenic activity in the summer than in the winter. No difference between spring and fall has been observed. Probably it is necessary to sample selected locations more intensively to be able to detect any differences, if such indeed exist. 8.3 Effect levels of estrogens in freshwater environmentsThe concentrations of estrogens and estrogenic activity as determined by in vitro bioassays being necessary to induce the feminising effects observed in male fish in the field are unknown. Therefore, predictions of the potential effects of the concentrations of estrogen found in the present investigation will rely mainly on results obtained in short to medium time experiments in the laboratory and under semi-field conditions. In such experiments production of yolk protein in males, development of intersex or other disturbances in the male testis have been used as markers for estrogenic effects. It is important to note that sensitivity towards estrogens among different fish species may vary. Likewise, the sensitivity to estrogens varies considerably during the different life stages of a specific fish species. Most of the controlled laboratory or semi-field experiments have been carried out with rainbow trout Oncorhynchus mykiss, roach Rutilis rutilis, carp Cyprinus carpio, japanese medaka Oryzias latipes, fathead minnow Pimephales promelas or zebrafish Danio rerio. 17ß-estradiol (E2) E2 has induced the production of yolk protein in rainbow trout at a concentration of 5 ng/L. Adult, male zebrafish generally respond to E2 concentrations from approximately 20 ng/L and higher (Rose et al. 2002, Brion et al. 2004). E2 has induced intersex in japanese medaka Oryzias latipes at 10 ng/L. A range of other testicular effects have been seen at concentrations between 10 – 50 ng/L and also at concentrations above 100 ng/L. Examples of other effects are inhibition of the normal development of male germ cells, which can be seen as a lower relative weight of the testis and/or a presence of a larger proportion of early stages of germ cells; the presence of degenerated germ cells has also been seen. Estrone (E1) A similar or slightly lower estrogenic activity has been detected for E1 in comparison with E2. Induction of yolk protein in male rainbow trout and fathead minnow has been seen at concentrations of approximately 30 ng/L and 10 ng/L (Metcalfe et al 2001). Estrone alters the gonadosomatic index in fathead minnow with a NOEC of approx. 100 ng/L (Panter et al 1998). Ethynylestradiol (EE2) EE2 is more potent than the natural estrogens with regard to induction of disruptions in the male reproductive system. Induction of yolk protein have been seen at 0.1 ng/L in trout (42). The EC-50 value for vitellogenin induction in adult, male zebrafish is 2.5 ng/L (Rose et al. 2002) and 1 ng/L induced vitellogenin production in fathead minnow (Pawlowski et al. 2004). EE2 changed sex ratio in zebrafish at concentrations below 0.6 ng/L and egg production was affected in fathead minnow at exposure to 0.1 ng/L (Pawlowski et al. 2004). A range of other reproductive effects such as inhibition of normal sperm cell development has been seen at concentrations below 10 ng/L. The concentrations of estrogens present in the effluents from some of the WWTPs investigated in the present survey, in particular in the C and D categories, are obviously so high that they are likely to induce feminisation in male fish, whereas effluents from well-functioning WWTPs have contents of estrogens that probably are below an effect level. The estrogenicity levels in the surface water samples are generally lower than in the effluents, but with the existing scientific knowledge it cannot be excluded that feminisation can result from long term exposure to the levels observed in a number of the investigated streams and lakes. The prediction, however, whether or nor estrogenic effects are likely to occur in a specific effluent is - with our present knowledge - not straightforward. This is illustrated in a recent publication (Aerni et al. 2004) in which five WWTP effluents were investigated for estrogenic activity (YES), estrogenic chemicals (E1, E2, EE2, estriol and nonylphenol by chemical analysis) and the ability of the effluents to induce vitellogenin production in rainbow trout. Vitellogenin production was induced in two out of five effluents, but not in a way that was totally predictable from the YES-assay results. An effluent with 2.1-5.3 E2 equivalents/l did not induce vitellogenin production, whereas an effluent with 2.4-5.5 E2 equivalents/l did; most of the estrogenic activity in the effluents was accounted for by E1 and E2 while EE2 was below the LOD. 8.4 Occurrence of the synthetic hormone EthynylestradiolIt was somewhat unexpected that only very few samples contained the synthetic hormone ethynylestradiol, which originate from the use of anti-contraceptive pills. In more than 100 effluent samples from a broad range of WWTPs we only found EE2 a concentration exceeding 1 ng/L in six samples. We do find EE2 in nine of 15 influent samples and a high removal efficiency in the more advanced WWTPs comprising the vast majority of the total effluent volume in Denmark. In the less advanced plants the elimination efficiency is low, but fortunately so are the influent concentrations in this study (though probably only incidentally). Nevertheless, it is downstream of these plants EE2 is found in the water courses, and in the open land EE2 is detected in a drain from fields treated with manure and in an effluent from isolated houses. Thus, although not common EE2 does occur and when it does it contributes with 25-75% of the total estrogenic activity. The German WWTP survey published in 2001 (Körner et al., 2001; Spengler et al., 2001) demonstrated that advanced technology would remove nearly 100% of parent steroid estrogens, while the effluent from a WWTP with a more simple technology (trickling filter) contained about 20 ng/L of E1 and 5-10 ng/L of E2 and EE2. The latter type of WWTP is roughly comparable to the categories C and D in this study, where three of four detections of EE2 occur. In the US survey of streams in risk of receiving effluents from WWTPs, it was shown that 5.7% of all samples contained EE2. It should be noted that the original publication (Kolpin et al. 2002a) states that 15.7% of samples with EE2, but a subsequent correction mentions 5.7% as the correct result (Kolpin et al.(2002b) in a response to a comment by Ericson et al., 2002). In the comparable categories of our study (L-R), EE2 is found in approx. 2 % of the samples. 8.4.1 Samples with non-steroid estrogenic activityThe majority of data presented above should be interpreted in the light of the statistical uncertainty of the two methods, and as described earlier a ratio of 2.6 between YES and chemical data is suggested as a criterion (Table 8.2). The uncertainties include standard analytical issues such as dilution effects, determination of recoveries etc, but also possible matrix effects and synergism. In 82% of the effluent samples from WWTPs the chemical estimation of estrogenic activity based on analysis of three estrogens matches the biological determination. This proportion is generally similar in the waters receiving effluents (86%) and the general aquatic environment (74%). It is in agreement with the findings reported in Kjølholt (2003), showing that steroid estrogens accounted for 80-95% of the activity in treated waste water. This study did not include the simple WWTPs of categories C and D. Table 8.2 Comparison of samples with detection both biologically and chemically. YES-to-Chemical ratio of 2.6 is significance criteria for matching values.
* Activity caused by other estrogens than E1, E2, áE2 and EE2 (possibly non-steroid). One important prerequisite for interpretation is that the data are corrected for known losses in analytical procedures by internal recovery standards, but the data set is uncorrected for recovery as measured against standards in quality control samples. This is a choice made to present the data as little manipulated as possible. Such a correction would increase the match between biological and chemical data. The response factors are another parameter that affects the comparison of biological and chemically determined estrogenic activity. The response factors determined here are slightly lower than those reported by Aerni et al (2004), who found 0.38 and 1.12 for E1 and EE2 respectively. 8.4.1.1 WWTPsOf the 11 samples from A-F categories where ratios exceed 2.6, four are from C and D categories. These two categories also have high concentrations of steroid estrogens and the data demonstrates that the efficiency in removing these substances and presumably also xenoestrogens is much smaller than in A-B and E-F. Thus, there is a suggestion in the data for C and D that non-steroid estrogen compounds contribute to the observed YES activity. In their recent study of five WWTPs Aerni et al. (2004) do not attribute more than 1% estrogenic activity from e.g. nonylphenol although the contribution may be higher from xenoestrogens in special cases. 8.4.1.2 Open land sources and surface watersThe unexpected high proportion of samples with additional estrogenic activity among the open land sources and to some extent the aquatic environment categories may be partly explained by the fact that in many samples the E2-activity is less than 1 ng/L and the statistical error increases as the lower bound of the test's dynamic range is approached. The activities in samples from G-K exceeding a ratio of 2.6 may have several causes: Two come from K-samples (fish farms) with a possible content of hormone disrupting agents from fodder. Samples from the field drains may contain higher amounts of phytoestrogens, but are also much more prone to local effects from isolated houses and non-steroid estrogenic components in manure and sludge. In the aquatic environment three such results come from “background” sites, which is surprising, but with the concentrations approaching the detection limits the data is less reliable. Based on the available data it is therefore our preliminary conclusion that there is no indication of widespread occurrence of non-steroid estrogen related activity in the aquatic environments. In effluents from particular sources (in particular categories C, D and possibly K) the activity from steroid estrogens is rivalled by non-steroid estrogen compounds. 9 Conclusions9.1 Sources of estrogens 9.1 Sources of estrogens9.1.1 Wastewater treatment plantsAt all sites and in nearly all samples from WWTPs estrogenic activity was found during the eight months duration of the sampling programme and some relatively clear relations between process technology and estrogenic activity in the effluent were noted. It is clear that the modern WWTP with a de- and/or nitrification step releases very low concentrations of estrogens with the purified effluents. Also, the low tech treatment facilities i.e. reed beds and, in particular, biological sand filters demonstrate a promising capacity to retain estrogens. The traditional, often relatively small WWTPs without nitrification and/or denitrification and only equipped with a trickling filter or even only a retention tank, are those with the poorest removal efficiency and therefore those who discharge the highest concentrations of estrogens with their effluents. These treatment plants often serve very small rural communities and, thus, they can also be regarded as a kind of "open land sources". It is presently unknown if realistic technological solutions exist that can improve the performance of the small treatment plants with regard to estrogens. 9.1.2 Sources in the open landThe limited number of results from potential sources in the open land prevents firm conclusions to be drawn with regard to their relative share of the emissions of estrogens to the aquatic environment. However, the levels in septic tank effluents, which are typical of farms and other isolated houses in the countryside, were high, while the levels in the, albeit few, samples from other potential source types (drainage systems, fish farm effluents) in the open land were generally low. Considering the few open land samples taken in this study and the huge amounts of manure (and to some extent sewage sludge) being applied to farmland in Denmark, the possible emissions to water courses with drainage water could deserve a closer examination. Such an examination should also include drains transporting septic tank effluents. 9.2 Estrogenic activity in the aquatic environment9.2.1 General stateThe data presented here for the general aquatic environment does not suggest a widespread occurrence of estrogenic activity at levels known to give feminisation of fish. In 33% of the samples from the aquatic environment (43 out of 130) the estrogenic activity if present was below the limit of detection (0.05 ng/L). However, low estrogenic activity is found with the YES assay in almost all types of freshwater environments in Denmark, but typically at concentrations lower than 1 ng/L. Only 25 out of the 130 samples had a level of total estrogenic activity higher than 1 ng/L (18 of these were below 2 ng/L), and the highest level observed in any sample was 8.8 ng/L. 9.2.2 Streams receiving wastewater effluentsIn almost 70% of the water courses receiving effluents from WWTPs the level of estrogenic activity immediately downstream the discharge point (10 times the width of the water course) was higher than the upstream activity. In the remaining 30% the activity was either the same up- and downstream or the upstream activity was slightly higher. When looking at samples taken further downstream the discharge point (approx. 100 times the width of the water course) the observed estrogenic activity was generally not any longer possible to relate to the wastewater discharges. Hence, it may be concluded that in general the estrogenic activity provided by wastewater effluents is diluted or degraded to "general" levels within a relatively short distance from the discharge point. In the affected section of receiving water bodies the levels were often between 1-5 ng/L corresponding to 5-10 times the levels in background samples. 9.2.3 Background locationsIn samples from the aquatic environment anticipated not to be influenced by human activities including those connected with husbandry, i.e. samples from "background" locations, the estrogenic level was non-detectable in 35% of the samples and in the rest it was low with weighted average of 0.1-0.4 ng/L. In particular the levels in background streams were low while some activity was detectable in a majority of the lake samples. 9.3 Types and forms of estrogens9.3.1 Contribution from the steroid estrogensEstrone is the steroid estrogen found most frequently and in the highest concentrations followed by estradiol. These two estrogens typically contribute with 80-100% of the sample activity from the analysed estrogens. In a few cases the indicator for husbandry (αE2) exceeds that of estradiol in WWTP samples, but does not rival estrone or estradiol in contribution to estrogenic activity due to low response factor in the YES assay. In the environmental samples αE2 is only occasionally found in significant concentrations, and is not attributable to expected cattle concentrations. Ethynylestradiol is only found rarely and in low concentrations, and in general the activity from ethynylestradiol is not a significant contribution to the total estrogenic activity neither in WWTP effluents nor in the aquatic environment. 9.3.2 Conjugated versus free estrogensEstrogens are excreted from humans and animals mainly on a conjugated form while it is the free form that is active. The free form is ready to exhibit its estrogenic activity if released from WWTPs, but the conjugated form will only do so after loss of the conjugant (glucuronic acid or sulphate). During the transport in the sewerage system and in the subsequent WWTP processes the estrogens are bound or degraded, and the contribution of conjugated forms drops to 0-10% of the total activity in the effluent. In samples from the Danish aquatic environment and in the water courses receiving effluents almost all the activity (>90%) can be attributed to the free forms of estrogens. Thus, there is no "chemical time bomb" effect to be expected in the form of conjugated estrogens, which could cause a delayed effect in the aquatic environment. 9.3.3 Other chemicals may contribute to estrogenic activityEstrogenic effects have been ascribed to natural and synthetic estrogens, xenoestrogens and phytoestrogens by scientists and regulatory bodies over the last decade. In some early studies xenoestrogens were responsible for dramatic effects, but now the contribution from natural and synthetic estrogens are considered to be the most important from an overall point of view. The present study shows that in a limited number of cases other substances than E1, E2 and EE2 probably contribute to the total estrogenic activity observed. However, because of the statistical uncertainty associated with the two methods it has not been possible to evaluate with certainty if or how much of the difference between the biologically detected and the chemically determined estrogenicity is due to an actual additional activity from other substances being present than E1, E2 and EE2. 9.4 Geographical and seasonal variationsEffluent samples taken during winter show lower estrogenic activity than summer samples at the measured sites. The difference between spring and fall samples does not suggest a general trend. Also the samples from the aquatic environment seem to exhibit more activity in the summer than in the winter. It has not been possible to reveal any regional differences due to differences in soil types/geology, land use or demography in neither WWTP effluents, other sources or in the aquatic environment. 9.5 Environmental significanceThe concentrations of estrogens present in the effluents from some of the WWTPs investigated in the present survey, in particular in the C and D categories, are obviously so high that they are likely to induce feminisation in male fish, whereas effluents from well-functioning WWTPs have contents of estrogens that probably are below an effect level. The estrogenicity levels in the surface water samples are generally lower than in the effluents, but with the existing scientific knowledge it cannot be excluded that feminisation can result from long term exposure to the levels observed in a number of the investigated streams and lakes. The prediction whether or not estrogenic effects are likely to occur in a specific effluent or water body is, with our present knowledge, not straightforward. For example, Aerni et al. (2004) recently investigated WWTP effluents in Switzerland by means of both chemical analysis, the YES assay and analysis of vitellogenin in rainbow trout, and they found that some effluents induced vitellogenin production in the trout, but not in a way that was totally predictable from the YES-assay results or the results of the chemical analyses. As previously mentioned the data presented here does not suggest a widespread environmental occurrence of estrogenic activity at levels known to give feminisation of fish. Nevertheless, it must be acknowledged that in water bodies heavily affected by WWTP effluents hormone disrupting effects have previously been found in fish. Given the levels of estrogenic activity in a number of effluents measured in this study, impacts may be observable at locations where an inefficient WWTP discharge a volume of effluent that is large compared to the flow in the receiving water course, e.g. in rural areas where creeks and small streams may receive a high proportion of effluents from less advanced WWTPs. 10 ReferencesAerni HR, Kobler B, Rutishauser BV, Wettstein FE, Fischer R, Giger W, Hungerbuhler A, Marazuela MD, Peter A, Schonenberger R, Vogeli AC, Suter MJF, Eggen RIL (2004). Combined biological and chemical assessment of estrogenic activities in wastewater treatment plant effluents. Analytical and Bioanalytical Chemistry 378:688-696. Andersen, H., Halling-Sørensen, B., Ingerslev, F., Nielsen, S.N. (2002). Renseanlægs bidrag til østrogene stoffer i det danske vandmiljø. Andersen, H., Kjølholt, J., Hansen, M., Stuer-Lauridsen, F., Blicher, T.D., ingerslev, F., Halling-Sørensen, B (2004). degradation of Estrogens in Sewage Treatment Processes. Environmental Project No. 899, 2004. Danish Environmental Protection Agency. Andreolini, F., Borra, C., Caccamo, F., Dicorcia, A. (1987). Estrogen Conjugates in Late-Pregnancy Fluids - Extraction and Group Separation by A Graphitized Carbon-Black Cartridge and Quantification by High-Performance Liquid-Chromatography. Analytical Chemistry, 59: 1720-1725. Arnbjerg-Nielsen K, Hvitved-Jacobsen T, Ledin A, Auffarth, K, Mikkelsen PS, Baun A, Kjølholt J (2002). Bearbejdede målinger af regnbetingede udledninger af NPO og miljøfremmede stoffer fra fællessystemer i forbindelse med NOVA 2003. Miljøprojekt nr. 701, 2002 (in Danish with an English summary). Bjerregaard, P. (1999). Hvilke stoffer og stofgrupper har oestrogen virkning? Indlæg i Miljøforskning nr. 40, pp. 14-20. Udgivet under det Strategiske Miljøforskningsprogram, december 1999. Bjerregaard, P. (2002). Fokus på hormonforstyrrende stoffer. Indlæg i: Teknologirådet (2002), pp. 107-114. Brion F, Tyler CR, Palazzi X, Laillet B, Porcher JM, Garric J, Flammarion P (2004). Impacts of 17 beta-estradiol, including environmentally relevant concentrations, on reproduction after exposure during embryo-larval-, juvenile- and adult-life stages in zebrafish (Danio rerio). Aquatic Toxicology 68:193-217. Casey, P., Mackne, C., Lake, A. (1998). Ozone Disinfection. Fact Sheet by the National Small Flows Clearinghouse. Christiansen, L.B., Winther-Nielsen, M., Helweg, C. (2002). Feminisation of fish - The effect of estrogenic compounds and their fate in sewage treatment plants and nature. Environmental Project No. 729, 2002. Udgivet af Miljøstyrelsen. Colucci, M. S., Bork, H., Topp, E. (2001). Persistence of Estrogenic Hormones in Agricultural Soil: I. 17b-Estradiol and Estrone. Journal of Environmental Quality 30, 2070-2076. D'Ascenzo G, Corcia AD, Gentili A, Mancini R, Mastropasqua R, Nazzari M, Samperi R. (2003). Fate of natural estrogen conjugates in municipal sewage transport and treatment facilities. Sci.Tot.Env. 302:199-209. Desbrow C, Routledge EJ, Brighty GC, Sumpter JP, Waldock M. (1998). Identification of Estrogenic Chemicals in STW Effluent. 1. Chemical Fractionation and in Vitro Biological Screening. Environ.Sci.Technol. 32:1549-1557. Ericson JF, Laenge R, Sullivan DE (2002). Comment on "Pharmaceuticals, hormones, and other organic wastewater contaminants in US streams, 1999-2000: A national reconnaissance". Environmental Science & Technology; 36: 4005-4006. Fawell JK, Sheahan D, James HA, Hurst M, Scott S (2001). Oestrogens and oestrogenic activity in raw and treated water in Severn Trent Water. Water Research Vol. 35, No. 5, pp. 1240-1244. Finlay-Moore O, Hartel PG, Cabrera ML (2000). 17?-Estradiol and Testosterone in Soil and Runoff from Grasslands Amended with Broiler Litter. Journal of Environmental Quality Vol. 29, pp. 1604-1611. Food and Drug Administration (1996). Retrospective review of ecotoxicity data submitted in environmental assessments for public display. Docket no. 96N-0057. Fürhacker M, Breithofer A, Jungbauer (1999). A 17 beta-estradiol: Behavior during waste water analyses. Chemosphere; 39: 1903-1909. Garfield FM, Klesta E, Hirsch J. (2000). Quality Assurance Principles for Analytical Chemical Laboratories, 3 ed, AOAC International, USA. German Ministry of Environment (1997). "Verordnung über Anforderungen an das Einleiten von Abwasser in Gewässer und zur Anpassung der Anlage des Abwasserabgabengesetzes". Bundesgesetzblatt Jahrgang 1997 Teil I Nr. 19, Bonn, 25. März 1997. Halling-Sørensen B. (2000). Algal Toxicity of antibacterial agents used in intensive farming. Chemosphere 40:731–9. Halling-Sørensen, B. S. Nors Nielsen, P.F. Lanzky, F. Ingerslev, H.C. Holten Lützhøft & S.E. Jørgensen (1998). Occurrence, fate and effects of pharmaceutical substances in the environment - a review. Chemosphere 36, p 357-393. Halm, S., Pounds, N., Maddix, S., Rand-Weaver, M., Sumpter, J. P, Hutchinson, T. H., and Tyler, C. R. (2002). Exposure to exogenous 17ß-oestradiol disrupts P450aromB mRNA expression in the brain and gonad of adult fathead minnows (Pimephales promelas). Aquat Toxicol. 60(3-4), pp 285-299. Henschel, K.P., Wenzel, A., Didrich, M. & Fliender, A.(1997). Environmental Hazard Assessment of Pharmaceuticals. Regulatory Toxicology and Pharmacology Vol. 18 pp 220-225. Holbrook, R.D., Novak, J.T., Grizzard, T.J., Love, N.G. (2002). Estrogen Receptor Agonist Fate during Wastewater and Biosolids Treatment Processes: A Mass Balance Analysis. Environmental Science and Technology, 36, 4533-4539. Ingerslev F, Andersen HR, Hansen M, Jacobsen A-M, Krogh KA, Søeborg T, Halling-Sørensen B (2003). En præliminær kortlægning af steroidudledningen fra danske rensningsanlæg. Dansk Kemi 84, nr. 5 (in Danish). Ingerslev, F. & Halling-Sørensen, B. (2003). Evaluation of Analytical Chemical Methods for Detection of Estrogens in the Environment. Working Report 44. Danish Environmental Protection Agency, Copenhagen, Denmark Itoh, S., Ueda, H., Naasaka, T., Nakanishi, G., Sumitomo, H. (2000). Evaluation variation of estrogenic effect by drinking water chlorination with the MVLN assay. Water Science and Technology, Vol. 42 (7-8), pp. 61-69. Jones, O.A.H., Voulvoulis, N. and Lester, J.N. (2002). Aquatic environmental assessment of the top 25 English prescription pharmaceuticals. Water Research 36: 5013–5022. Kinnberg, K. (2003). Evaluation of In Vitro Assays for Determination of Estrogenic Activity in the Environment. Working Report No. 43, 2003. Danish Environmental Protection Agency. Kjølholt J, Poll C, Jensen FK (1997). Miljøfremmede stoffer i overfladeafstrømning fra befæstede arealer. Miljøprojekt nr. 355, 1997 (in Danish with an English summary). Kjølholt, J., Nielsen, P., Stuer-Lauridsen, F. (2003). Hormonforstyrrende stoffer og lægemidler i spildevand. Miljøprojekt Nr. 799, 2003. Miljøstyrelsen. Kolpin DW, Furlong ET, Meyer MT, Thurman EM, Zaugg SD, Barber LB, Buxton HT. (2002a). Pharmaceuticals, Hormones, and Other Organic Wastewater Contaminants in U.S. Streams, 1999-2000: A National Reconnaissance. Environ.Sci.Technol. 36:1202-1211. Kolpin DW, Furlong ET, Meyer MT, Thurman EM, Zaugg SD, Barber LB, Buxton HT. (2002b). Response to comment on "pharmaceuticals, hormones, and other organic wastewater contaminants in US streams, 1999-2000: A national reconnaissance". Environmental Science & Technology 2003; 36: 4007. Körner, W., Spengler, P., Bolz, U., Schuller, W., Hanf, W., Metzger, J. (2001). Substances with estrogenic activity in effluents and sewage treatment plants in southwestern Germany. 2. Biological analysis. Environmental Toxicology and Chemistry, Vol. 20 (10), pp. 2142-2151. Lai, K. M., Johnson, K. L., Scrimshaw, M. D. and Lester, J. N. (2000). Binding of Waterborne Steroid Estrogens to Solid Phases in River and Estuarine Systems. Environmental Science and Technology 34[18], 3890-3894. Larsson D.G.J., Adolfsson-Erici M., Parkkonen J., Petterson M., Berg A.H., Olsson P.-E. and Förlin L. (1999). Ethynyloestradiol - an undesired fish contraceptive? Aquat. Toxicol. 45, 91-97. Lee LS, Strock TJ, Sarmah A, Rao P (2003). Sorption and Dissipation of Testosterone, Estrogens, and Their Primary Transformation Products in Soils and Sediment. Environ. Sci. Technol. 37, pp 4098-4105. Metcalfe CD, Metcalfe TL, Kiparissis Y, Koenig BG, Khan C, Hughed RJ, Croley TR, March RE, Potter T. (2001). Estrogenic potency of chemicals detected in sewage treatment plant effluents as determined by in vivo assays with japanese medaka (Oryzias latipes). Environ Toxicol Chem 20:297-308. Miles-Richardson SR, Kramer VJ, Fitzgerald SD, Render JA, Yamini B, Barbee SJ, Giesy JP. (1999). Effects of waterborne exposure of 17ß-estradiol on secondary sex characteristics and gonads of fathead minnows (Pimephales promelas). Aquatic Toxicology 47:129-145. Miljøstyrelsen (2004). Punktkilder 2003. Det nationale program for overvågning af vandmiljøet; Fagdatacenterrapport. Orientering fra Miljøstyrelsen nr. 16, 2004. Murk AJ, Legler J, van Lipzig MMH, Meerman JHN, Belfroid A, Spenkelink A, van der Burg B, Rijs GBJ, Vethaak D (2002). Detection of estrogenic potency in wastewater and surface water with three in vitro bioassays. Environmental Toxicology and Chemistry, Vol. 21, No. 1, pp. 16-23. Murk, A.J., Legler, J., van Lipzig, M.M.H., Meerman, J.H.N., Belfroid, A.C., Spenkelink, A., van der Burg, B., Rijs, G.B.J., Vethaak, D. (2002). Detection of estrogenic potency in wastewater and surface water with three in vitro assays. Environmental Toxicology and Chemistry, vol. 21 no. 1, pp. 16-23. Nimrod AC, Benson WH. (1998). Reproduction and development of Japanese medaka following an early life stage exposure to xenoestrogens. Aquatic Toxicology 44:141-156. Nordic Council of Ministers (1996). Chemicals with Estrogen-like Effects. TemaNord 1996:580. Rapport, 278 pp. Panter GH, Thompson RS, Sumpter JP. (1998). Adverse reproductive effects in male fathead minnows (Pimephales promelas) exposed to environmentally relevant concentrations of the natural oestrogens, oestradiol and oestrone. Aquatic Toxicology 42:243-253. Pawlowski S, van Aerle R, Tyler CR, Braunbeck T (2004). Effects of 17 alpha-ethinylestradiol in a fathead minnow (Pimephales promelas) gonadal recrudescence assay. Ecotoxicology and Environmental Safety 57:330-345. Petersen GI, Norrgren.L., Holbech H, Lundgren A, Koivisto S. (2001). Suitablilty of zebrafish as testorganism for detection of endocrine disrupting chemicals. TemaNord 2001:597.Nordic Council of Ministers. Peterson EW, Davis RK, Orndorff HA (2000). 17?-Estradiol as and Indicator of Animal Waste Contamination in Mantled Karst Aquifers. Journal of Environmental Quality Vol. 29, pp. 826-834. Raman DR, Williams EL, Layton AC, Burns RT, et al. (2004). Estrogen content of dairy and swine wastes. Environmental Science & Technology, Vol. 38, pp. 3567-3573. Rose, J, H Holbech, C Lindholst, U Nørum, A Povlsen, B Korsgaard, P Bjerregaard. (2002). Vitellogenin induction by 17ß-estradiol and 17á-ethinylestradiol in male zebrafish. Comp. Biochem. Physiol. 131C: 531-539. Routledge EJ, Sheahan D, Desbrow C, Brighty GC, Waldock M, Sumpter JP (1998). . Identification of estrogenic chemicals in STW effluent. 2. In vivo responses in trout and roach. Environ Sci Technol 32:1559-1565. Sattelberger, R. (1999). Arzneimittelrückstände in der Umwelt. Umweltbundesamt GmbH, Wien, report R-162. Snyder SA, Villeneuve DL, Snyder EM, Giesy JP. 2001. Identification and quantification of Estrogen Receptor Agonists in Wastewater effluents. Environ.Sci.Technol. 35:3620-3526. Spengler, P., Körner, W., Metzger, J.W. (2001). Substances with estrogenic activity in effluents and sewage treatment plants in southwestern Germany. 1. Chemical analysis. Environmental Toxicology and Chemistry, Vol. 20 (10), pp. 2133-2141. Stuer-Lauridsen, F., Birkved, M., Hansen, L., Holten Lützhøft, H.C. & Halling-Sørensen, B. (2000). Environmental Risk Assessment of Human Pharmaceuticals in Denmark after Normal Therapeutic Use. Chemosphere 40: 783-793. Stuer-Lauridsen, F., Hansen, L., Birkved, M., Kjølholt, J., Mikkelsen, S. (2002). Litteraturudredning vedrørende human medicin i miljøet. Miljøprojekt nr. 661. Udgivet af Miljøstyrelsen. Svenson, A., Allard, A.-S., Ek, M. (2003). Removal of estrogenicity in Swedish municipal sewage treatment plants. Water Research, Vol. 37, 4433-4443. Takigami, H., Taniguchi, N., Matsuda, T., Yamada, M., Shimizu, Y., Matsui, S. (2000). The fate and behaviour of human estrogens in a night soil treatment process. Water Science and Technology, Vol. 42 (7-8), pp. 45-51. Teknologirådet (2002). Hormonforstyrrende stoffer. Resumé og redigeret udskrift af høring i Folketinget 25. april 2002. Ternes TA, Stumpf M, Mueller J, Haberer K, Wilken RD, Servos M. (1999). Behaviour and occurrence of estrogens in municipal sewage treatment plants - I. Investigations in Germany, Canada and Brazil. Sci.Tot.Env. 225:81-90 Ternes, T. (1998). Occurence of Drugs in German Sewage Treatment Plants and Rivers. Wat Res 32, p 3245-3260. Thorpe K, Hutchinson TH, Hetheridge M, Scholze M, Sumpter JP, Tyler CR. (2001). Assessing the biological potency of binary mixtures of environmental estrogens using vitellogenin induction in juvenile rainbow trout (Oncorhynchus mykiss). Environ Sci Technol 35:2476-2481. Thorpe KL, Hutchinson TH, Hetheridge MJ, Sumpter JP, Tyler CR (2000). Development of an in vivo screening assay for estrogenic chemicals using juvenile rainbow trout (Oncorhynchus mykiss). Environ Toxico Chem 19:2818-2820. Till A. (2002). Comment on "Pharmaceuticals, hormones, and other organic wastewater contaminants in US streams, 1999-2000: A national reconnaissance". Env. Sci. Tech.; 37: 1052-1053. Vethaak, A.D., Rijs, G.B.J., Schrap, S.M., Ruiter, H., Gerritsen, A., Lahr, J. (2002). Estrogens and xeno-estrogens in the aquatic environment of the Netherlands - Occurrence, Potency and Biological Effects. RIZA/RIKZ-report no. 2002.001. Williams RJ, Johnson AC, Smith JJL, Kanda R (2003). Steroid Estrogens Profiles along Ribver Stretches Arising from Sewage Treatment Works Discharges. Environmental Science & Technology, Vol. 37, pp. 1744-1750. Wojtenko, I., Stinson, M.K., Field, R. (2001). Performance of Ozone as a Disinectant for Combined Sewer Overflow. Critical Reviews in Environmental Science and Technology, 31(4):295-309. Zhang HW, Henion J (1999). Quantitative and qualitative determination of estrogen sulfates in human urine by liquid chromatography/tandem mass spectrometry using 96-well technology. Analytical Chemistry 1999; 71: 3955-3964. Appendix Report to "Survey of Estrogenic Activity in the Danish Aquatic Environment"1 Pre-survey testing of procedures and equipment
3 In vitro test - YES assay standard curves
4 Quality assurance data for YES assay and chemical analysis 5 Steroid estrogens versus estrogenic activity 6 Alternative presentation of study results 7 Locations and sampling scheme 1 Pre-survey testing of procedures and equipment1.1 Assessment of loss of conjugates during analysis 1.1 Assessment of loss of conjugates during analysisEstrogens are primarily excreted from humans and animals in conjugated form. The conjugants are either sulphate or glucuronide and each of them can bind to the estrogens on either the 3 and 17 positions (see Box 1 below) or on both positions. The di-conjugated estrogens are however chemically unstable and are readily cleaved to mono-conjugates. This cleavage occurs almost instantly [1] and the di-conjugated estrogens will therefore not occur in sewage and are therefore irrelevant in the current context. The current section discusses the importance of the conjugated estrogens with regard to interpretation of the results and to the assessment of the potential “delayed” release of estrogens to the environment when conjugated estrogens are cleaved in the environment.
Box 1.1: Structure and numbering of 17β-estradiol In the project, the conjugated estrogens have only been measured indirectly, by measuring the total estrogen concentration after enzymatic de-conjugation. As will be discussed in the following, there is a risk that this determination of conjugated estrogens underestimates the actual amount of these substances. Two factors may have impact on this result. The first occur if the conjugated estrogens not are cleaved completely during the enzymatic deconjugation procedure. Here, it was shown that the cleavage was quantitative with the exception of E2-17S of which only approximately 9% was cleaved (appendix 1.5). A number of studies has however, shown that E2-17S is not excreted from humans and therefore this insufficient cleavage is unimportant in the current context [1-3]. The second reason for a potential underestimation of the concentration of conjugated estrogens is if the loss of conjugated estrogens during the analytical steps is significantly different than that of the parent compounds. This reduction is not taken into account in the calculation of the concentrations which is based on the use of deuterated internal standards (E1, E2 and EE2). Investigations were therefore made to quantify any on loss of conjugated estrogens due to:
Each of these experiments is described in details in the subsequent sections. Our results show that there is no reduction in the amount of conjugated estrogens in the samples during storage. The loss during solid phase extraction is independent of the compound in question and range from 2 to 27%. These findings are consistent with the observations made for the non-conjugated estrogens (the parent compounds) and consequently it can be assumed that the amount of conjugated estrogens is determined with precision which is close to that of the parent compounds. Reference List
1.2 Stability of mono-conjugated steroid estrogensAn experiment was conducted with the aim of documenting the stability of the conjugated estrogens from sampling until storage on SPE-cartridges. Both, the concentration of the conjugated estrogens as well as free estrogens produced during the deconjugation of the conjugated estrogens, are monitored during this experiment. The experiment was performed with seven conjugated estrogens: E1-3G, E2-3G, E2-17G, E1-3S, E2-3S, 17-E2-3S, and E2-17S. More than 6 litres of sewage effluent (from Lynetten Sewage Treatment Plant, Copenhagen) were pH-adjusted to 3.0 using diluted H2SO4. The sewage effluent was divided into three replicate samples each of 2 litres. Each sample was spiked with conjugated estrogens (E-G 125 ng/L and E-S 12.5 ng/L). The samples were stored at 4°C. Two subsamples of 250 mL were taken after 0, 5, 24, 48 and 168 hours from each 2 litre sample. The six subsamples were dived in two subsets (E and EC) each consisting of 3 subsamples. The E subset was reserved for analysis of free estrogens, while the EC subset was prepared for analysis of the conjugated estrogens. The collected subsamples were filtered through a glass fiber filter (GF/C). Subset E was spiked with an internal standard mixture of deuterium marked estrogens (d4E1, d5E2 and d4EE2 at 20 ng/L), whereas subset EC was spiked with a conjugated estrogen Eq-3S (120 ng/L) used as internal standard. The subsamples were pre-concentrated at pre-conditioned SPE cartridges. The cartridges were dried for approximately one hour by N2 and stored at –18°C until analysis. After elution from the cartridges with acetone, the subsamples of subset E was clean-up using silica. All samples were analyzed for free estrogens using the GC-MS-MS method and for conjugated estrogens using HPLC-MS-MS. Results The results of the samples analysed for conjugated estrogens show that the conjugated estrogens are stable during a period of 7 days when the acidity of the effluent samples are adjusted to pH 3 and stored at 4°C (see Tabel 1.1). Calculation of the reduction of the conjugated estrogens in percent is shown in Table 1.2, at it gives a more clear picture of the stability of the substances and confirms their high stability. The analyses of the free estrogens confirm that degradation products of the conjugated estrogens (the free estrogens) are not formed during the storage period. The content of the free estrogens around 2- 6 ng/L is probably the natural content of the sewage effluent used in the current experiment (see Table 1.2). Conclusion Table 1.1: Mean concentration in ng/L of the different conjugated and free estrogens in the spiked effluent samples after 0, 5, 24, 48 and 168 hours of storage. Numbers in brackets represent the STD.
The results listed in the tables below leads to the conclusion that conjugated estrogens present in sewage effluent water are stable under the conditions used for sample storage in the current project. Table 1.2: The mean concentration of the different conjugated and free estrogens in the spiked effluent samples after 0, 5, 24, 48 and 168 hours of storage, expressed in percentage of the initial concentration at 0 hours. Numbers in brackets represent the relative standard deviation.
1.3 Adsorption of conjugated estrogens to glass equipmentThe binding of estrogens to glassware has previously been investigated by Fürhacker et al., who found that E2 does not absorb significantly to glass bottles [1]. As conjugated estrogens are more hydrophilic than the free compounds they may absorb more easily to glassware which has a polar surface. Therefore, in order to find the best suitable equipment for sampling and transportation of the conjugated estrogens, a study was conducted with the aim of testing the sorption of conjugated estrogens to different types of glass ware. Three different flasks were tested, Duran glass laboratory flasks (Schott) that has been washed and heated (450°C), disposable glass bottles (Identipak), and Duran glass laboratory-flasks that has been silanized with dimethyldichlorosilane (in order to reduce the number of negative charges on the glass surface). For each type of glass, duplicate sets of 1 liter of Milli-Q water which had been added a mix of cojugated estrogens (200 ng/l), were prepared. The spiked test solutions were adjusted to pH=3 with 4 M H2SO4. All flasks were stored at 4°C for two days. After storage, the content from each flask, were eluted through SPE columns and dried with N2-gas and stored at -18°C until analysis. After storage, 5 mL of acetone was used to extract the analytes from the SPE-cartridge. Samples representative of no absorption of estrogens to glassware (t=0) was prepared before adding the solutions to the flasks as described above. From these solutions, 1000 mL was eluted through dried with N2-gas and stored at -18°C until analysis. Samples were analyzed for their content of conjugated estrogens using HPLC-MS-MS. Results Recoveries of the conjugated estrogens are calculated as the amount detected in flasks stored for two days divided by the amount found in control samples (t=0). Table 1.3 below lists the recovery obtained for the three different types of flasks. Table 1.3 Recoveries obtained for steroid estrogens in three types of flasks
Conclusion As seen, the recovery was close to 100 for all substances in all types of glassware. The deviations from 100% recovery are due to the uncertainty of the HPLC-MS-MS method used. In conclusion it can be stated that among the types of glassware tested here, there is no absorption of conjugated estrogens to the glass ware. References: Fürhacker, M., Breithofer, A., Jungbauer, A. (1999). 17beta-estradiol: Behavior during waste water analyses. Chemosphere vol. 39, 1903-1909. 1.4 Solid Phase extraction (SPE) testingThis section describes the SPE pre-concentration step The SPE cartridges used was from Varian® (C18 Bond Elut®, 1 g/6 ml). Briefly, filtered samples were acidified with 3.5 M H2SO4 until pH=3, then sample volumes of two litres were spiked with the internal standards (d4E1, d5E1, d4EE2) in concentrations of 10 ng/L. The samples were eluted through the preconditioned SPE cartridge and the analytes were extracted from the cartridge using 5 ml of acetone.
Preliminary experiments The recovery of free estrogens on SPE columns has been studied by several authors and it is generally accepted that high recovery (> 60%) is achieved when using a method as the current (see e.g. [1,4,5]). In a preliminary study, five different cartridges (Varian® C18 Bond Elut® (6 ml/1 g); Isolute® C18 (6 ml/500 mg); Waters Oasis™ HLB (6 cc/200 mg);Isolute® ENV+ (6 ml/1 g); Waters Porapak™ Rdx (6 cc/ mg)) were tested using spiked tap water to 100 ng/L. The highest recovery was obtained using the Varian cartridges, which subsequently has been applied though out the project. This column material has previously been used for analysis of steroid estrogens [2]. SPE recovery (Conjugated estrogens) The recovery of the SPE cartridges (Varian® C18 Bond Elut® (6 ml/1 g) was evaluated using STP effluent samples (2 L) spiked with 20 ng/L for the glucuronidated compounds (E1-3G, E2-3G, E2-17G) and 8 ng/L for the sulphate conjugates (E1-3S, E2-3S, E2-17S, 17-E2-3S). After filtration and pH adjustment, the samples were spiked with the conjugated estrogens and an extraction standard (Equlin-3-Sulphate, Eg-3S, 12.5 ng/L) was added. The samples were then eluted through SPE cartridges as described above [3]. These samples containing conjugated estrogens were not cleaned up using silica gel. Conjugated estrogens are rather polar and will become adsorbed to the gel instead of being washed through. Therefore, the acetone extract was evaporated under a gentle stream of N2-gas. The dry extract was re-dissolved in 200 µL MeOH:MilliQ water (1:1) containing an instrument standard (deuterium labelled estrone sulphate, E1-3S-d4, 25 ng) and analysed using LC-MS-MS. Results and conclusion Figure 1.1 gives an example of absolutes recoveries obtained for E1, E2 and EE2. It should be stressed that that the recovery is dependent of the matrix samples and is generally higher when the matrix is clean (e.g. tap water). In the full method this variability is compensated be the use of the deutorated standards. In Figure 1.2, the absolute recoveries of the conjugated estrogens are presented. As seen, the recoveries range from 73 to 98%. The differences observed between the different compounds are assumed to insignificant and therefore it can be concluded that there is no correlation between the recovery and
A comparison of the data in Figure 1.1 and Figure 1.2 leads to the conclusion that there is no difference between the extraction efficiency of conjugated and free estrogens.
Figure 1.1: Absolute recoveries of E1, E2 and EE2 in SPE-columns, sewage effluent (n=5).
Figure 1.2: Absolute recoveries of the conjugated estrogens (n=3). Error-bars indicate the standard deviations and the numbers on the bars indicate the recovery-values Reference List
1.5 DeconjugationThe acetone extract from the SPE column (only half of the 5 mL is used for the 01 sample) is evaporated to dryness under N2-gas. The samples are dissolved in 2 mL 0.1 M acetic acid buffer (pH=5) containing -glucuronidase enzyme with minimum 2000 units glucuronidase activity and 150 units sulfatase activity (HP-2 from Helix pomatia (Sigma, Germany)) and incubated for 24 h at 40°C. The incubation is ended by addition of 5 mL acidified water (pH=3). The incubation mixture is then extracted on preconditioned C18-columns as described previously. For evaluation of the procedure three issues have to be addressed:
Results and conclusions Three experiments were performed to test these points:
The overall conclusion on the three experiments is that the procedure performed satisfactory for the purpose of the analytical method. All glucoronide and aryl-sulphate conjugates of estrogens appear to be hydrolysed quantitatively to the parent estrogens. Alkylsulphate estrogens (E2-17S and E2-3,17S) which are not expected to be found in human sewage are almost not cleaved with the enzyme preparation. This is consistent with the description by the manufacturer that the enzyme preparation contains â-gluconidase and arylsulfatase activity, but not alkylsulfatase activity. Alkylsulfates are easily hydrolysed with other procedures, but given that no alkylsulphates are expected to occur in sewage, this was not included in the method. Table 1.4: Recovery of steroid estrogens after treatment
Table 1.5: Recovery of conjugates after treatment
Table 1.6: Recovery of E2 after cleavage of conjugated estrogens
1.6 Silica gel clean-upIn order to remove substances with interference on the chemical analyses a cleaning procedure using silica gel was used for all samples for chemical analyses. Briefly, the procedure was as follows: the samples in the acetone eluate from the SPE cartridge were evaporated to dryness with N2-gas. The samples were then redissolved in 200 µl of hexane:acetone (65:35 vol:vol). Columns with silicagel were packed de novo for each sample in 3 mL glass SPE colums using kieselgel 60 from Merck. The kieselgel were weighted to 1.0 g and suspended in the hexane-acetone mixture and stirred to remove bubbles before pouring it into the column. The redissolved samples were then loaded onto the column and eluted with the hexane-acetone mixture until 5 ml eluate were collected. Recovery experiments The absolute recoveries of the analyte for the step were evaluated for each analyte as shown in Table 7. The results are reported on basis of experiments with six replicates. It is seen that the clean-up step is almost quantitative for each analyte. In the full method the small loss and contribution to variation from the clean-up step was fully compensated by use of the deuterated standards. Table 1.7: Recoveries of analytes for the silicagel cleanup step with 95% confidence intervals.
2 Chemical analysis2.1 Overview of analytical concept The current document gives a detailed description of how results are generated and quantified in the current project. Several advanced techniques are used through out the project. As these often are linked together into a whole analytical method, an overview of the whole process is given in the main document. More detailed information of the different processes is only given in the separate sections in Appendix 1. 2.1 Overview of analytical conceptThe overall analytical procedure is as follows. One 8-10 litre sample is collected from the sample site and instantaneously acidified to pH 3. The samples are then transported to the laboratory within 24 hours. As illustrated in Figure 2.1, the 8-10 litre samples is divided on the sampling location into four 2 litres sub-samples that are treated differently. Therefore they are marked 01, 02, 03 and 04, respectively together with a label for identifying details on sampling location and time. Each of the four sub-samples marked 01, 02, 03 and 04 is treated as follows:
An overview of all sample treatment steps is shown in Figure 2.1. The rationale underlying this scheme is; 1) that samples are analysed both chemically (on GC-MS-MS) and biologically (with YES-assay), 2) that de-conjugation of 01A- and 03-samples enables the distinction between concentration levels of both the total estrogens and the free estrogens (01B and 02), and 3) an extra sample is stored for other purposes. The purpose of each step in the sample treatment is explained by the following procedure. After collection and sub-division into four sub-samples of 2 L, the samples are filtered to remove particles. Followed by addition to 02 and 03 samples of deutorated internal standards needed for the chemical analysis. All four samples are then eluted through a solid phase extraction (SPE) column which are stored at -18°C until further treatment. After storage, the analytes are eluted from the SPE columns using a few millilitres of acetone and the samples are thereby pre-concentrated up to 5000 times. Samples analyzed with GC-MS/MS, needs an additional clean-up step using silica gel to avoid interfering signals on the mass spectrometer. Prior to detection on GC-MS-MS, the analytes are derivatized using a mixture of N-methyl-N-(trimethylsilyl)-trifluoroacetamide (MSTFA), N-trimethylsilylimidazole (TMSI), and 1,4-dithioerythritol (DTE). Figure 2.1: Overview of the sample treatment from sampling to chemical or biological analysis. In the following chapters, each sample preparation step is described in detail. Separate sections describe the GC-MS-MS method and the YES-assay as well and the data treatment used to these two methods. 2.2 Sample preparation2.2.1 Particle filtering and solid phase extractionEach sub-sample is filtered two times using glass fibre filters (type GF/C and GF/D) in a vacuum filtration system. The filtered sub-samples are thereafter weighed out and applied onto the solid phase extraction system (SPE). After particle filtering the internal standards d4E1, d5E2 and d4EE2 are added to 02 and 03 sub-samples, using a 250 µL methanol solution at concentrations of 0.080, 0.079 and 0.078 ng/µL, respectively. Furthermore the deconjugation standards MUF-G and EQ-S are also added to 02 and 03 sub-samples, with a 250 µL methanol solution at concentrations of 0.112 and 0.101 ng/µL, respectively. The C18-columns (Varian, Mega Bond Elut® 1 g/6 mL) are preconditioned before use by serial washing with 5 mL hexane, 2 mL acetone, 5 mL methanol and 7 mL water (with sulphuric acid added to pH=3), respectively. The sub-sample is then applied to the C18-column by a vacuum manifold and Teflon® tubes. After extraction, the SPE columns are dried by pressing N2-gas through the column for one hour. The SPE cartridges were stored at –18°C until analysis. After storage, 5 mL of acetone was used to elute the analytes from the SPE-cartridge. 2.2.2 DeconjugationThe acetone extract from the SPE column (only half of the 5 mL is used for the 01 sample) is evaporated to dryness under N2-gas. Then, the samples are re-dissolved in 2 mL 0.1 M acetic acid buffer (pH=5), containing -glucuronidase enzyme with minimum 2000 units glucuronidase activity and 150 units sulphatase activity (HP-2 from Helix pomatia (Sigma, Germany)) and incubated for 24 h at 40°C to deconjugate the glucuronide or sulphate moiety. The incubation is terminated by addition of 5 mL acidified water (pH=3). The incubation mixture is then extracted on preconditioned C18-columns as described previously. 2.2.3 Silica gel clean upSilica gel clean up were performed on columns prepared by suspending 1 g of silica gel 60 (Merck, Germany) in hexane/acetone mixture (65/35), thereafter transferring the slurry into a 3 mL glass column (Merck LiChrolut®, Germany) with a bottom-filter installed (MN Chromabond®, Denmark). Only sub-samples 02 and 03 are cleaned up using silica gel. The SPE extract (5 mL acetone) is evaporated to dryness under N2 gas and re-suspended in approx. 200 µL hexane/acetone mixture (65/35 by volume). The 200 µL suspension is transferred to a freshly prepared silica gel column and eluted with 5 mL of the hexane/acetone mixture (65/35 by volume). 2.2.4 DerivatisationTo the extract from silica gel clean up (200 µL), the derivatisation standard 17β-estradiole-17-acetate (AE2) dissolved in acetone were added to achieve 20 ng in the sample. Then the solution was evaporated to dryness under N2-gas. The analytes were derivatized by adding 50 µL derivatisation mixture and then incubating for 1 hour at 60 °C. The composition of this mixture is 1000 µL (N-methyl-N-(trimethylsilyl)-trifluoroacetamide (MSTFA) mixed with 2 µL of N-trimethylsilylimidazole (TMSI) in which 2 mg 1,4-dithioerythritol (DTE) was dissolved. Thereafter the liquid were evaporated to dryness using N2-gas and dissolved in 200 µL heptane solutions containing 0.02 ng/µL of 3-methyl-estrone (MeE1) and transferred to an autosampler vial. 2.2.5 GC-MS/MSSeparation and detection of the analytes were accomplished using a gaschromatographic-tandem mass spectrometry system (GC-MS/MS) consisting of a gas-chromatograph (Varian, CP-3800) and a triple quadrupole mass spectrometer (Varian, MS 1200 Quadrupole MS/MS system). A programmable temperature vaporiser injector (PTV) was installed on the GC. The MS was operated in the electron impact mode (EI). Retention times, ion masses and collision energies for all analytes are presented on Figure 2-2 on the following page. 10 µL of analytes were injected, at 1 µL/second, in the PTV at a temperature of 120 °C. After 0.3 min the split was closed and the PTV-temperature where elevated at a rate of 200 °C/minute to 300 °C. Two minutes after injection the split were opened at a ratio of 30/100. The GC where operated at a constant flow of helium (He, purity level, Alphagaz, Germany) at 1 mL/minute though a Varian FactorFour capillary column (30 m 0.25 mm i.d.). The temperature programme of the GC is described in Table 2.1. The total run-time including cooling before next run was approximately 30 minutes. Table 2.1: GC temperature programme
The temperature in the transfer line was constant at 300 °C. Argon (purity level , Alphagaz, Germany) was used as collision gas. CO2 was applied as injector coolant for a faster cooling/equilibration for returning to starting point temperature. 2.2.6 Identification of analytes and specification of MS-conditionsThe identities of the analytes were proven on basis of their chromatographic retention time and the masses of precursor and product ions. Furthermore the ratio between product ions should not vary more than 20%. Figure 2.2 lists the parameters needed for unambiguous identification of the analytes.
Figure 2.2: GC-MS-MS parameters for analytes included in the chemical analysis. 2.2.7 QuantificationWithin each series of samples analyzed on GC-MS/MS, a calibration curve with standard samples was analysed (ranging from 0.2 to 200 ng/vial). The standard samples undergo only derivatization. The deuterated internal standards are added in amounts as close to those of the samples analyzed in the project (approx. 10 ng/L in samples, corresponding to approximately 20 ng/vial). The calibration curve for the steroid estrogens E1, E2 and EE2 are generated relative to the internal standards d4E1, d5E2 and d4EE2, respectively. Deuterated E2 was not available, therefore this substances is related to the d5E2 standard. The standard curve with steroid estrogens was prepared by analyzing 8 to 10 samples evenly distributed in the range from 0.2 to 200 ng/vial. The calibration curve is fitted to a linear equation. An example of a standard curve is given in Figure 2.3. During the analyses, the sensitivity of the instrument decreased gradually. Therefore the ionisation region was cleaned after approximately 48 injections. As all vials were injected three times, the number vials analysed in an analytical batch was approximately 16. When analysing a set of samples and standards, the number of vials was typically above this number and therefore the samples and standards was distributed in several analytical batches. In order to control that the analytical signal was unchanged between batches two standards was analysed in each batch whereas the remaining standards and samples were only analysed once.
Figure 2.3: Standard curve for E1. Detailed view of the low concentrations is shown in the small curve. 3 In vitro test - YES assay standard curves3.1 Calculation of E2 equivalents in the YES-assay 3.1 Calculation of E2 equivalents in the YES-assayResults from in vitro bioassays are normally expressed in terms of relative potencies (in our case 17β-estradiol equivalents) and in the calculation of relative potencies, the response from the sample with an unknown content is compared with the response of a dilution series of the agent in question. The relative potency is then calculated from the ratio between the EC50 values of the standard curve and the sample response curve. This fairly simple calculation is only possible if standard curves and response curves show identical slope and efficacy (maximum response), which was not the case in the majority of the YES-assays conducted on environmental samples in the present project. Sample response curves in the present project showed a variety of different shapes as shown in the figure below. Besides these types of curves (that are real results from the project), some standard curves and sample response curves showed decreased absorbance for the least diluted samples; however, the latter phenomenon does not affect the calculation of E2 equivalents. Figure 3.1 Sample response curves It is convincingly argued by Villeneuve et al. (2000) that results from in vitro bioassays should only be expressed in terms of relative potencies with care if standard curves and response curves have different shapes and it should be noted in the presentation of the results which values are calculated by means of a simple EC50 ratio and which values are the result of calculations on non-identically shaped standard curves and sample response curves. Villeneuve et al.'s (2000) considerations are mainly based on interaction between dioxins and cell lines responding to Ah-receptor agonists. Most of the pure chemicals tested in the YES-assay yield response curves that are parallel with the 17β-estradiol standard curve; this is true for the estrone, estriol, diethylstilbestrone, genistein and bisphenol A (Routledge & Sumpter 1996), butyl-, pentyl-, hexyl-, heptyl-, octyl- and nonylphenol (Routledge & Sumpter 1997), methyl-, ethyl-, propyl- and butylparaben (Routledge et al. 1998). o,p-DDT, however, yield response curves with a slope and an efficacy lower than the 17β-estradiol standard curve (Routledge & Sumpter 1996). Deviation from parallelism in the environmental samples may indicate:
It is apparent from Table 3.1 that the samples with non-parallel response curves are not randomly distributed among the different types of environmental samples. WWTP effluents from categories A and especially C and D in our investigation show a majority of parallel response curves, whereas this is not the case for the B category. WWTP effluents are – according to the scientific literature (e.g. Desbrow et al. 1998; Witters et al. 2001; Kirk et al 2002; Svenson et al. 2003; Aerni et al. 2004; Rutishauser et al. 2004) - the ones most often assayed with the YES-assay and it is thus not surprising that the issue of non-parallelism has not been dealt with by previous investigators, simply because there has not necessarily been any need to consider this aspect. Table 3.1. The number of individual samples in each category of environmental samples exhibiting parallel and non-parallel response curves relative to the 17β-estradiol standard curve. Both free and deconjugated samples are treated as individual samples in this table and samples with no response are not included.
The majority of non-parallel response curves appears in samples from the general freshwater environment (especially categories L and M ). Published data on the use of the YES-assay for these types of samples are very scarce. Witters et al. (2001) determined estrogenic activity in Flemish WWTP effluents and general surface waters and they actually show the response curves in their paper. Parallel and non-parallel response curves were obtained for WWTP effluents and general surface water, respectively, and Witters et al. (2001) do not explain how 17β-estradiol equivalents were calculated for the non-parallel surface water samples (except that the linear part of the standard curve was used). In chemical analysis, matrix effects can often be overcome by use of the standard addition method. The standard addition method, however, requires a higher amount of sample and, also, the consummation of time and resources in the analysis is considerable. Furthermore, the use of the standard addition method is not validated for use in in vitro bioassays. In spite of these considerations, standard addition has been tested for a few of the environmental samples with slopes differing from the slope of the 17β-estradiol standard curve. However, standard addition does not seem to consistently be able to deal with and overcome the problems associated this type of response. 3.2 How E2 equivalents were calculatedThe 17β-estradiol standard curve and the sample response curves are S-shaped and another way of attempting to overcome the problem with lack of parallelism is to use the lower, curved part of the graphs, only. This part of the curves can be efficiently regressed by the use of second order polynomia. It was decided to use the following procedure in the evaluation of the results:
Since the shapes of the lower part of the standard curve and the curves from the environmental samples are not necessarily identical, the 17β-estradiol equivalents calculated from sample response curves of a different shape than the standard curve are associated with a higher uncertainty than the E2 equivalents calculated from sample response curves and standard curves of identical form. Therefore, in the results datasheet, the shapes of all of the individual response curves have been indicated by the marks shown in the figure in section 3.1. For sample response curves with slopes similar to the standard curve, the two ways of calculation basically gave the same results (see example 3 on the next pages) and the average of both methods has been given. 3.3 Explanation of data treatment exemplified in a spreadsheet
Absorbances are converted to concentrations by means of the equations for the straight line and the second order equation. The degree of up-concentration of the sample is included. Based on the shape and the slope of the standard curve and the sample response curve and the consistency of the calculated data, it is assessed (visually) which part of the standard curve that corresponds best with the shape and slope of the sample response curve. 3.4 Six real examplesThe calculation of E2 equivalents from 6 typical sample response curves are shown below. Spreadsheets for values calculated from both linear and polynomial regressions are shown. The values finally used in the calculations of E2 equivalents are highlighted in the spreadsheets.
Figure 3.3 Six typical sample response curves Click here to see Absorbtion tables Considerations regarding the calculation of the E2 equivalents from the individual sample response curves. Sample 001: The slope of the response curve is very different from the slope of the E2 standard curve which makes it difficult to use the straight part of the E2 standard curve for comparison; in fact, only point 3 (0.27) is situated on the linear part of the curve. Contrary to this, there is a good correspondence with the polynomial part of the curve from point 3 to point 6 (0.32; 0.29; 0.32; 0.33). In this case only the lower polynomial part of the curve is used in the calculation with the result 0.32 ng/l. Sample 002: The sample response curve is linear between point 1 and 5, but the slope is different from the slope of the E2 standard curve. Between point 4 and 6 (0.19; 0.20; 0.24) there is some similarity – although far from perfect - with the polynomial part of the E2 standard curve. Only the polynomial curve is used in the calculation and the result from the calculation for sample 2, which is 0.21 ng/l has less certainty than the result from sample 1. Sample 003: The sample response curve is largely parallel with E2 standard curve. Point 5,6 and 7 (3.77; 5,38; 4.98) correspond to the linear part of the E2 standard curve and point 7 to10 (5,48; 4.88; 4,53; 4.89) correspond with the polynomial part. An average of the results from the to curves is used to determine the concentration to 4.82 ng/l Sample 004: The slope of the sample response curve is so different from the slope of the E2 standard curve that only one point (point 6: 4,10) on the sample response curve falls on the linear part. Again, there is a nice correspondence with the polynomial part (Point 7-10: 4,11; 5,18; 4,08; 4,89) which is used in the calculation to determine the concentration to 4,57 ng/l. Sample 005: Similar to sample 1 and treated identically. Point 3 (0.31) on the linear part is not used. Point 3 to 6 (0.34; 0.38; 0.39; 0.39) on the polynomial part are used to calculate the result: 0.38 ng/l. Sample 006: The correspondence with the polynomial part is weak – too weak for a calculation of a result. Means are calculated and the amount of original water sample is included in the calculation for each sample. 3.5 ReferencesAerni, H-R, B Kobler, BV Rutishauser, FE Wettstein, R Fischer, W Giger, A Hungerbühler, MD Marazuela, A Peter, R Schönenberger, AC Vögeli, M J-F Suter, RIK Eggen. 2004. Combined biological and chemical assessment of estrogenic activities in wastewater treatment plant effluents. Anal. Bioanal. Chem. 378, 688-696. Desbrow, C, EJ Routledge, GC Brighty, JP Sumpter, M Waldock.1998. Identification of estrogenic chemicals in STW effluent. 1. Chemical fractionation and in vitro biological screeing. Environ. Sci. Technol. 32, 1549-1558. Kirk, LA, CR Tyler, CM Lye, JP Sumpter. 2002. Changes in estrogenic and androgenic activities at different stages of treatment in wastewater treatment works. Environ. Toxicol. Chem. 21, 972-979. Routledge, EJ, JP Sumpter. 1996. Estrogenic activity of surfactants and some of their degradation products assessed using a recombinant yeast screen. Environ. Toxicol. Chem. 15, 241-248. Routledge, EJ, J Parker, J Odum, J Ashby, JP Sumpter. 1998. Some alkyl hydroxy benzoate preservatives (parabens) are estrogenic. Toxicol. Appl. Pharmacol. 153, 12-19. Rutishauser, BV, M Pesonen, BI Escher, GE Ackermann, H-R Aerni, M J-F Suter, RIL Eggen. 2004. Comparative analysis of estrogenic activity in sewage treatment plant effluents involving three in vitro assays and chemical analysis of steroids. Environ. Toxicol. Chem. 23, 857-864. Svenson, A, A-S Allard, M Ek. 2003. Removal of estrogenicity in Swedish municipal sewage treatment plants. Wat. Res. 37, 4433-4443. Villeneuve, DL, AL Blankenship, JP Giesy. 2000. Derivation and application of relative potency estimates based on in vitro bioassay results. Environ. Toxicol Chem. 19, 2835-2843. Witters, HE, C Vangenechten, P Berckmans. 2001. Detection of estrogenic activity in Flemish surface waters using an in vitro recombinant assay with yeast cells. Wat. Sci. Technol. 43, 117-123. 4 Quality assurance data for YES assay and chemical analysis4.1 Quality assurance measures 4.1 Quality assurance measuresSeveral different measures have been used to ensure the quality of the results obtained during this project. The quality assurance elements consist of 1) an internal quality control scheme and 2) measures to compare results with other laboratories. 4.1.1 Internal quality controlIn connection with every series of samples a set of quality control samples is analysed along with the real samples, i.e. taken through the total analytical procedure. The set of quality control samples consists of one blank sample (tap water) and two identical control samples (tap water to which a mixture of the three estrogens estrone, β-estradiol and ethynylestradiol (E1, E2 and EE2) has been added at a level 2.5 ng/l of each analyte). The same set of quality control samples are used for the biological assay and for the chemical analytical method. Results from the control samples are collected in quality control charts. The four quality control charts are shown in Figure 4.1. The control chart displays mean values of the two control samples for each series of samples (X-chart) as well as the difference between duplicate results (R-chart). 4.1.2 Precision and Limit of DetectionFrom the control charts the precision can be calculated for each parameter measured. The control chart with results from the biological assay gave an overall precision (RSD, reproducibility)) of 29 % from measurement of estrogenic activity. Similarly, overall precision from the chemical determination of the three analytes were 30 % (E2), 17 % (E1) and 27 % (EE2), respectively. From the total number of mean values in the control chart the measured overall mean value is calculated. The overall calculated mean values for each parameter can be compared to the nominal values for the control samples to estimate accuracy of the two (biological assay and analytical chemical) methods. For the biological assay an overall mean value of 6.80 ng/l was calculated. When compared to a nominal value of 5.92, this indicates an accuracy (or recovery) of 115 %. Similarly for the analytical chemical method, overall mean values of 2.40 ng/l E2), 2.65 ng/l (E1) and 2,27 ng/l (EE2), respectively were calculated. When compared to the nominal values of 2.78 ng/l (E2), 2.78 ng/l (E1), and 2.65 ng/l (EE2) respectively, this indicates accuracies of 86 % (E2), 95 % (E1) and 86 % (EE2).
Figure 4.1 Control chart showing results from YES-assay measurements of estrogenic actvity (top) and analytical chemical determination of estrone (bottom) in quality control samples. (Upper part of each chart shows difference of duplicate measurements, lower part of each chart shows mean values).
Figure 4.2 Control chart showing results from analytical chemical determination of -estradiol (top) and ethynylestradiol (bottom) in quality control samples. (Upper part of each chart shows difference of duplicate measurements, lower part of each chart shows mean values). For the chemical parameters the Limit of Detection (LOD) was used as a measurement of the lowest amount that can be determined by the method used. The LOD is defined by the formula:
where Sw is the standard deviation determined in the same series of samples (repeatability) at concentrations near LOD and t0.995(f) is between 3 and 4 with more than 6 repetitions. The LOD was determined by an 8-fold determination of tap water spiked with 0.2 ng/L of each of the 4 components. This resulted in calculated LODs well below 0.1 ng/L and on this basis a general LOD of 0.1 was determined. 4.1.3 Interlaboratory comparison - chemical analysesThe two laboratories were performing chemical analysis using two instruments of same brand and model. In order to verify that all data produced during the project were uniform, an internal control study was performed. This involved analysis of identical samples on both laboratories. Briefly, three surface water samples and three WWTP-effluent samples were collected and divided into two four litre samples. One of these was spiked with E1, E2, EE2 and α-E2 to concentrations of 2.5 and 10 ng/L. The deuterated standards were added to both spiked and un-spiked water samples. Both were divided in two 2-litre samples that were eluted through SPE-columns. The resulting two sets of identical SPE-columns (spiked and un-spiked) were analysed on each laboratory producing data to the project. 4.1.3.1 ResultsTable 4.1 lists all results measured by the two laboratories. The measured concentrations are presented together with 95% confidence limits. Confidence limits are calculated on basis of the relative standard deviations (RSD) obtained for the control samples analysed throughout the project (see previous section). An illustration of the results are given in Figure 4.3, which shows the results obtained for E1 and as can be seen, the confidence intervals overlap in the majority of samples, indicating that the results from the two laboratories are uniform. This conclusion is supported by the fact that the high number of quality control samples that has been analyzed during the project also shows an acceptable agreement between the two laboratories. In the current study, there are however, a few results showing diverging concentration in identical samples (marked with asterix in the table). These erroneous results relate to the fact that the samples used in the current study were unusually dirty and therefore resulted in high matrix interference. Table 4.1: Results obtained in interlaboratory comparison. Samples which could not be considered as uniform within 95% confidence limits are marked with asterix.
Figure 4.3: Results obtained in inter-laboratory comparison for E1. Error bars indicate 95% confidence intervals. The abbreviations denote surface water (SW) and wastewater treatment effluent (WWTP). 4.1.4 Interlaboratory comparison - YES assayFor method calibration, seven samples were analysed in Professor John Sumpter's laboratory at Brunel University as well as in SDU's laboratory. The result of this exercise is shown in Table 4.2 below. Table 4.2: Results from the intercalibration of the YES-assay between professor John Sumpter's laboratory at Brunel University and the Institute of Biology, SDU.
It should be mentioned that in order to enable direct comparison between the two sets of data, the raw data from Brunel have been re-calculated by entering them into the SDU-spreadsheet normally used to calculate the results in this project. The two sets of results are considered to be in acceptable agreement. 4.1.5 Comparison between control sample results from biological and chemical measurementsSince the control samples used for the quality control in both the biological assay and the chemical analysis are identical, data from the control charts can be used to compare the overall agreement between the two methods. When comparing results from the two methods a conversion of contents of individual estrogens to estrogenic activity in the biological assay is necessary. Therefore conversion factors were determined by biological measurement on the individual estrogens. The estrogenic activity is expressed as E2 equivalents and the conversion factors used are 0.29 (E1) and 0.88 (EE2) respectively. The nominal content of the control samples is 2.78 ng/l E2, 2.78 ng/l E1 and 2.65 ng/l EE2. Since estrogenic activities displayed by the individual estrogens in the assay are considered additive a calculated nominal estrogenic activity of 5.92 ng/l of the control samples is calculated. The calculated mean estrogenic activity of the control samples measured by YES assay was 6.8 ng/l. whereas the calculated mean content (expressed as E2 equivalents) from the chemical analysis was 5.2 ng/l. These results indicate that the ratio (biological/chemical) between measurements performed on identical samples is 1.3. From the control chart of the biological assay a RSD of 29 % is calculated. For the chemical results converted to E2-equivalents the RSD can be calculated from the individual RSD's from the control charts, and this results in a RSD of 39% for the chemical analysis. This means that measurements of ratios between biological and chemical results are accompanied by a combined RSD (((RSDbiol)²+(RSDchem)²)½ ) of 49 %. Consequently, a ratio of 1.3 with a RSD of 49% indicates that ratios (biological/chemical measurements) lower than approximately 2.6 are not statistically significant (given a 95% level). 5 Steroid estrogens versus estrogenic activity5.1 Free versus total estrogens 5.1 Free versus total estrogensIn order to assess the amount of conjugated estrogens in wastewater influent, wastewater effluent and surface water, plots of the results obtained by measuring the free estrogens versus the free and conjugated estrogens (total estrogens) are shown in Figure 5.1 and Figure 5.2. The full drawn lines indicate where measurements of total and free estrogens are equal. Generally, a good agreement among the measured amounts of free and total estrogens was observed. In most of the cases the concentrations measured as total estrogens was above the free estrogen concentrations. The few examples of the opposite occur at low concentrations and are attributed to the variability of the analytical methods used. Samples taken from the open land sources and the aquatic environment (G-R) rarely contain more than 10-20% conjugated estrogens, and in most environmental samples almost 100% of the total estrogenic activity can be attributed to free estrogens. Therefore the concern that a major part of the potential aquatic estrogenic activity occurs in a form that is mobilised during deconjugation is not supported with the present data. By far the highest activity of a water sample from the environment will be found in the free estrogenic fraction compared to the conjugated. The samples taken directly in the WWTP effluents are somewhat higher in the concentration of conjugates, and typically display a 20% contribution from the conjugated species when concentrations exceed 5 ng/L. Because of uncertainty of the measurements, it is not clear whether this trend is also observed at lower concentrations. All values are included in Figure 1 with an expansion of the 0-12 ng/L range in Figure 5.2. At unity the total activity is completely derived from free estrogens. The samples with conjugated species reveal themselves by occurring above the line of unity. In the lower range, i.e. without the WWTP samples, most samples occur close to unity, but a few of the very low (<0.5 ng/L) show high levels of conjugated species.
Figure 5.1 Comparison of total and free estrogens determined in YES assay.
Figure 5.2 Expansion of the lower range 0-12 ng/L of the data set. 5.2 Biological assay versus chemical analysisIn the following figures and table, only paired YES and chemical analysis data are included in the presentation unless otherwise stated. First, the data set containing the samples of major direct sources of steroid estrogens is isolated. This is composed of the categories A-F comprising samples of waste water effluents shown for free estrogens in Figure 5.3 and for total estrogens in Figure 5.4. The area between the lines show the range in which biological and chemical measurements are considered statistically equal, given the uncertainties mentioned in section 4.3 of the main report.
Figure 5.3 Free estrogens. YES results vs. Chemical results converted to E2 equivalents for free estrogens in waste water samples (A-F categories). The lower Line show unity and the upper line show where the difference between measurements exceeds statistical uncertainty of 2.6.
Figure 5.4. Total estrogens. YES results vs. Chemical results converted to E2 equivalents for total estrogens in waste water samples (A-F). The lower Line show unity and the upper line show where the difference between measurements exceeds statistical uncertainty of 2.6. In the effluent samples from wastewater treatment plants several data sets show additional estrogenic activity in YES assay compared to the activity calculated from the measurement of three steroid estrogens. In the second grouping, the remaining data sets are lumped together (see Figure 5.5 and 5.6). This include samples from the main category of "Other sources" (G-K), those taken from recipients of waste water (L) and the diffusely exposed aquatic environments (M-R).
Figure 5.5 Free estrogens. YES results vs. Chemical results converted to E2 equivalents for total estrogens in surface water samples (G-R). The lower Line show unity and the upper line show where the difference between measurements exceed statistical uncertainty of 2.6.
Figure 5.6 Total estrogens. YES results vs. Chemical results converted to E2 equivalents for total estrogens in surface water samples (H-R). The lower Line show unity and the upper line show where the difference between measurements exceeds statistical uncertainty of 2.6. Thus, in samples from aquatic environments believed to be at risk of receiving estrogenic activity, up to 25 to 30 % of the samples appear to be affected by other components with estrogenic activity than the steroid estrogens measured here. In samples from anticipated "clean" environments less than a fifth of the samples may be affected. In this latter category many samples have less than 1 ng/L E2 activity and test uncertainties will increase as the detection limits are approached. The majority of results in the data presented above show that the biological assay shows a higher estrogenic activity than the chemical detection of four analytes and recalculation of E2 equivalent activity suggests, as shown in Table 5.1. Given the statistical uncertainty of the two methods, a ratio of 2.6 between YES and chemical data is suggested and below is shown a tabulation of the data set relative to this criterion (Table 5.1). These uncertainties include standard analytical issues such as dilution effects, determination of recoveries etc, but also possible matrix effects and synergism. In 104 samples that were analysed for total estrogens detections were made using both the chemical method and the YES-assay. As a measure of agreement among the two methods, we propose that the ratio between YES and chemistry data must be below 2.6 as a criterion determining whether the methods are concordant. This proposal is based on the uncertainty obtained for the control samples analysed in the project. Using this criterion, we see that 77% of all samples fulfil this criterion. We also see that this conclusion appear to be valid also if sewage influent/effluent or surface water samples are considered separately. Amongst the results with a positive detection in both YES assay and chemical analysis, 24 results exceeded a YES-to-chemical ratio of 2.6. These fall in three groups: 11 from A-F (out of 60 samples), 6 from G-K (out of 11 samples), 2 from L (out of 14) and 5 from surface water (out of 19 M-R samples). Table 5.1 Number of comparable samples, i.e. over detection limit in both tests, and Samples within uncertainty range. YES-to-Chemical ratio of 2.6 is significance criteria.
One important prerequisite for interpretation is that the data are corrected for known losses in analytical procedures by internal recovery standards, but the data set is uncorrected for recovery as measured against standards in quality control samples. This is a choice made to present the data as little manipulated as possible. 5.2.1 Samples with non-steroid estrogenic activityA consequence of the results presented in Table 8.1 is that in 24 samples a contribution from other chemical components must be considered. These samples typically come from the categories of waste water effluents. The number of samples which may be affected by non-steroid estrogens are approximately 20%. This is in agreement with the findings reported in Kjølholt 2003, showing that steroid estrogens accounted for 80-95% of the activity in treated waste water. This study did not include the simple WWTPs of categories C and D. In 32 cases (in addition to the 104 paired data set) the chemical analysis detects estrogens without a recording in the YES assay. The average value for calculated estrogen activity is 0.3 ng/L with a median of 0.1 ng/L. Five values exceed 0.5 ng/L ranging from 0.6 to 1.6 ng/L. 5.2.1.1 WWTPsOf the 11 samples from A-F categories where ratios exceed 2.6, four are from C and D categories. These two categories also have high concentrations of steroid estrogens and the data demonstrates that the efficiency in removing these substances and presumably also xenobiotics is much smaller than in A-B and E-F. Thus, there is a suggestion in the data for C and D that non-SE compounds contribute to the observed YES activity. 5.2.1.2 Open land sources and surface watersThe activities in samples from G-R exceeding a ratio of 2.6 may have several causes: Some are from L-samples taken down stream of A-F sites with high ratios and so this is hardly surprising. Two come from K-samples (fish farms) with a possible content of hormone disrupting agents from fodder. Three come from “background” sites, but with concentrations measured that are approaching the lower bound of the analysis dynamic range. Based on the available data it is therefore our preliminary conclusion that there is no indication of widespread occurrence of non-steroid estrogen related activity in the aquatic environments. In effluents from particular sources (in particular categories C, D and possibly K) the activity from steroid estrogens is rivalled by non-steroid estrogen compounds achieving perhaps similar or double the activity of the former. 6 Alternative presentation of study resultsFor the purpose of this appendix some of the results presented in the main report have been re-arranged so they can be presented in the format that is commonly used for presentation of point source data in the annual reporting of the national Danish environmental monitoring programme, NOVANA. This implies that:
In this appendix the tables have been given the same numbers and the same captions as in the main report, and they are listed in the following without further explanation. Table 5.1 Presentation of all bioassay and chemical results for measurement of the Free and total level of estrogen activity (total is measured after enzymatic deconjugation). N, the number of samples, is separated into samples <LOD ('clean' samples), samples >LOD and total number of samples.
Table 5.2. Presentation of chemical results for measurement of free estrogens. N, the number of samples, is separated into samples <LOD ('clean' samples), samples >LOD and total number of samples.
Table 5.3. Presentation of chemical results for measurement of total estrogens. N, the number of samples, is separated into samples <LOD ('clean' samples), samples >LOD and total number of samples.
Table 6.1 Free and total estrogenic activity in the influents to wastewater treatment plants in categories A-F. Measured with YES-assay and given as ng E2 equivalents/L. N, the number of samples, is separated into samples <LOD ('clean' samples), samples >LOD and total number of samples.
Table 6.2 Free and total estrogenic activity in the influents to wastewater treatment plants in categories A-F. Three individual estrogens measured chemically and recalculated as ng E2 equivalents/L. N, the number of samples, is separated into samples <LOD ('clean' samples), samples >LOD and total number of samples.
Table 6.3 Free and total estrogenic activity in the effluents from wastewater treatment plants in categories A-F. Measured with YES-assay and given as ng E2 equivalents/L.
Table 6.4 Free and total estrogenic activity in the effluents from wastewater treatment plants in categories A-F. Three Individual estrogens measured chemically and recalculated to ng E2 equivalents/L. N, the number of samples, is separated into samples <LOD ('clean' samples), samples >LOD and total number of samples.
Table 6.5 Presentation of chemical results for measurement of free and total estrogens in WWTP effluents. N, the number of samples, is separated into samples <LOD ('clean' samples), samples >LOD and total number of samples.
Table 6.8 Content of free and total estrogenic activity in the effluents from isolated houses and in drains from fields amended with manure and sludge, respectively. Measured with YES-assay and given as ng Estradiol equivalents/L. N, the number of samples, is separated into samples <LOD ('clean' samples), samples >LOD and total number of samples.
Table 6.9 Content of free and total estrogens in the effluents from isolated houses and in drains from fields amended with manure and sludge respectively. Three Individual estrogens measured chemically and recalculated to ng Estradiol equivalents/L. N, the number of samples, is separated into samples <LOD ('clean' samples), samples >LOD and total number of samples.
Table 6.xx (no corresponding table in report - relates to Section 6.2) Free and total estrogenicity in water courses receiving effluents from wastewater treatment plants. Data from both upstream and downstream samples are included in the table. N, the number of samples, is separated into samples <LOD ('clean' samples), samples >LOD and total number of samples.
Table 7.1 Free and total estrogenic activity in various sub-categories of the aquatic environment in Denmark. Measured with YES-assay and presented as ng E2 equiv./L. N, the number of samples, is separated into samples <LOD ('clean' samples), samples >LOD and total number of samples.
Table 7.2 Free and total estrogens in various sub-categories of the aquatic environment in Denmark. Three Individual estrogens measured chemically and recalculated to ng E2 equiv./L. N, the number of samples, is separated into samples <LOD ('clean' samples), samples >LOD and total number of samples.
7 Locations and sampling scheme8 Survey data8.1 Explanations and abbreviations 8.1 Explanations and abbreviationsThe table on the following pages lists all data obtained in the project. Each sample is represented by two lined sections where the two lines contain the results from measuring the concentrations estrogens with and without enzymatic deconjugation, respectively (i.e., free and total estrogens). In the first column of the table, the name of the sampling site and the sample label is listed. The sampling label contains information on the sampling location, sample category, the sample type and the season for sampling. These groups are listed in the columns named “Sample Site”, “Category”, “Sample type”, and “Season”. The explanation of the different codes used under each of these columns is given after this text. The last seven columns presents the results divided in two main groups. In the first main group the E2-equivalents are presented in three columns. The first column, “chemical”, contain E2-equivalents estimated assuming the following relative responses: E1=0.29, EE2=0.88 and E2=0.04. Measurements below the quantification level (i.e., typical below 0.1 ng/L) are not included in the chemical E2-equivalent estimation and not included in the statistical evaluation. The second column, “Biological”, contain the results using the YES-assay and the third column, “2nd biological”, contain results from samples from the sample bank. The main group, “Chemical analysis”, contain the data obtained by analysing the samples with GC-MS/MS. Results are presented for each of the four analytes E1, E2, αE2, and EE2. In the columns presenting the results, a number of abbreviations are used. These are listed and explained in the following. Five samples have been excluded: A1-08U (large difference free and total); B4-12U (large difference between chemical and biological measurement); G1-01X (sampling failure); G2-02X (effluent rather than influent sample); and L0-26O (large difference between chemical and biological measurement). In the cases where the bank sample is analysed, it is the result of this (2nd biological sample) that is used in calculations. Abbreviations and codes used in the table are presented overleaf. Category codes
Sample types
Season codes
Measurement codes
Click here to see Survey data schemes.
|
|||||||||||||||||||||||||||||||||||||||||||||||||||||||||||||||||||||||||||||||||||||||||||||||||||||||||||||||||||||||||||||||||||||||||||||||||||||||||||||||||||||||||||||||||||||||||||||||||||||||||||||||||||||||||||||||||||||||||||||||||||||||||||||||||||||||||||||||||||||||||||||||||||||||||||||||||||||||||||||||||||||||||||||||||||||||||||||||||||||||||||||||||||||||||||||||||||||||||||||||||||||||||||||||||||||||||||||||||||||||||||||||||||||||||||||||||||||||||||||||||||||||||||||||||||||||||||||||||||||||||||||||||||||||||||||||||||||||||||||||||||||||||||||||||||||||||||||||||||||||||||||||||||||||||||||||||||||||||||||||||||||||||||||||||||||||||||||||||||||||||||||||||||||||||||||||||||||||||||||||||||||||||||||||||||||||||||||||||||||||||||||||||||||||||||||||||||||||||||||||||||||||||||||||||||||||||||||||||||||||||||||||||||||||||||||||||||||||||||||||||||||||||||||||||||||||||||||||||||||||||||||||||||||||||||||||||||||||||||||||||||||||||||||||||||||||||||||||||||||||