|
Survey of Estrogenic Activity in the Danish Aquatic Environment 5 Presentation of field dataThe data to be presented in this and the subsequent two chapters are based on a total of 341 samples incl. the special investigations from 148 locations in the Danish aquatic environment including a range of possible pollution sources. All samples were analysed by the YES assay for both free estrogens and total (deconjugated) estrogens giving a total of nearly 700 data sets. In addition, approx. 150 samples were analysed chemically for free estrogens and total estrogens. Thus, the complete survey comprises almost 1000 data sets. This section presents an overview of the data as well as the statistical methods used in the presentation of the results. The overall results for the bulk of data are shown in Table 5-1, while the complete set of biological and chemical data obtained in the project are listed in Appendix 8. In the following chapters most figures will display the biological data adding and discussing the chemical data sets when relevant. The chemical analysis provides concentrations of four individual estrogens, but as a general rule only the combined activity is presented calculated by using the response factors determined for the YES assay. In Tables 5.2-5.3 the chemical concentrations of individual steroid estrogens in environmental as well as pollution source samples are included except for the data from the special investigation of variation in effluent composition at three WWTPs. It has been chosen to follow the data presentation strategy outlined in the American survey (Kolpin 2002a). This includes calculating median values (geometrical means) rather than arithmetic means due to the typical skewed distribution of data, and use the maximum values for range setting. It should be borne in mind when directly comparing the median levels between categories, that they are based only on the detected levels, which in the case of a significant number of non-detects will lead to conservative estimates of median values. Table 5.1 Presentation of all bioassay and chemical results for measurement of the Free and total level of estrogen activity (total is measured after enzymatic deconjugation). N is separated into samples below detection limit ('clean' samples), hits above detection limit and total number of samples.
Table 5.2. Presentation of chemical results for measurement of free estrogens. N is separated into samples below detection limit ('clean' samples), hits above detection limit and total number of samples. Median concentrations (ng/L) are calculated on basis of results above LOD.
Table 5.3. Presentation of chemical results for measurement of total estrogens. N is separated into samples below detection limit ('clean' samples), hits above detection limit and total number of samples. Median concentrations (ng/L) are calculated on basis of results above LOD.
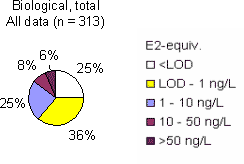
Overleaf in Figure 5.1, the entire data set is presented in four panels depending on the assay and treatment: biological (total), biological (free), chemical (total) and chemical (free). The lettering code refers to the source and environmental categories described in Section 2. For convenience the names are repeated below the figure. Two figure panels show data obtained measuring estrogenicity (E2-equivalents) with the YES-assay in samples with and without enzymatic cleavage of conjugated estrogens (Figure 5.1a and 5.1b respectively). Figure 5.1c and 5.1d present results obtained with the chemical analysis after transformation of the data obtained for each analyte to E2-equivalents. The calculation of E2-equivalents is based on equivalence factors of 0.29, 0.88, and 0.04 for E1, EE2 and a-E2 respectively. These equivalence factors were determined experimentally as a part of the project by testing each substance with the YES-assay. Click here to see Figure 5.1 A-D. Figure 5.1 A-D Presentation of all bioassay and chemical results above the limit of detection for determination of the free and total concentration of estrogens. In accordance with other similar projects (e.g. Kolpin et al., 2002a), graphical presentations of data represent only samples where estrogens were found at concentrations above the limit of detection (LOD). Similarly, the median concentrations and number of detections listed in tables are calculated on basis of only those samples where analytes were detected. The arguments for this practise is discussed by several authors (Kolpin et al. 2002a; Till, 2003) and can be summarized as follows: the reason for not including blank samples is that if their number is high, calculated medians and fractiles would be low and thus not be representative for the samples where estrogens were detected. However, samples with estrogenic activity below the detection limit represent the 'clean' environment or sources with very low release of estrogens, and this information is highly relevant in a survey of sources and levels. In the following we have therefore chosen to show diagrams with the proportion of the results occurring in selected intervals (<0.1; 0.1-1; 1-10; 10-50 and >50 ng E2 equivalents/L). In Figure 5.2 an example of such a graphical presentation is given for the total set of biological data for total estrogenicity (as E2-equivalents) i.e. the data presented in Table 5.1. In the tables and figures in the forthcoming chapters where medians and percentiles are calculated, these values are based only on data >LOD. This does lead to slightly conservative statistical estimates in the cases where non-detects are a significant part of the total number of samples in a category as in category A and F, and in environmental samples. In Appendix 6 re-calculated versions of the results presented in Chapters 6 and 7 can be found. The data have been re-calculated in accordance with the format used for presentation of point source data in the national Danish environmental monitoring programme, NOVANA. This implies that all data (including those <LOD) have been used for calculation of median and average values and 95% percentiles.
Figure 5.2 Presentation of all bioassay data for total estrogenicity as relative distribution between concentration categories ranging from levels <LOD to level >100 ng/L.
|
|||||||||||||||||||||||||||||||||||||||||||||||||||||||||||||||||||||||||||||||||||||||
