|
Assessment of Mercury Releases from the Russian Federation 4 Mobilisation of Mercury Impurities
4.1 CoalGlobally coal combustion is the major anthropogenic source of mercury emission to the atmosphere (UNEP 2003). The total extraction of coal in Russia in 2001 amounted 269 million tonnes. Of these 171 million t was bituminous coal, 98 million t was brown coal. The total consumption of coal broken down on use category is shown in Table 4.1 The total domestic consumption in 2001 was according to this source 234 million t. According to the statistics from the International Energy Agency the domestic supply should be a little higher; 251 million t. (IEA 2003). It should be noted that according to the IEA data the split between sectors is different as 32 million t should be used for heat plants, whereas the consumption for other industrial uses should be only about 8 million t. However, the data of Table 4.1 will be used for the further calculations. Table 4.1 Coal consumption in Russian Federation by use category2001 (calculated according to data from (Performance Results of Coal Sector in Russia ..., 2002))
* In this case, by all evidence, it means basically the use of coal in industry, not only for direct combustion, but also for its processing (semi-coking, gasification, hydrogenation, production of silisized carbon, calcium carbide, thermal anthracite, carbon sorbent, thermal graphite, etc.); most of these processes are based on high-temperature coal processing, which a priori determines emissions of mercury from it to atmosphere. 4.1.1 Mercury in Coal from the Russian FederationThe mercury content in coal is very variable; both among coal basins and among the individual mines in each basin (see figure 4.1, Annex 3). As an example, data for coal enterprises in Kuznetsk Basin ranked by mercury content is shown in Table 4.2. The Kuznetsk basin is the main basin in which 127 million t of coal was extracted in 2001 (Table 4.3). The basin account for about 46% of all coal extracted in Russia and account for 78 % of all coking coal in the country. The mercury content expressed as averages for each mine ranges from 0.01 mg/kg to 0.6 mg/kg. The simple average for all data from the basin is 0.09 mg/kg. Because of the large variation, in spite of the large number of measurements (data representativeness n=39), the 90% confidence range on the average for the dataset (using the averages of each mine as data input) is still quite wide: 0.05-0.13 mg/kg. Click here to see the figure.Figure 4.1 Major coal basins in Russia (Source: International Coal & Methane Research Center http://www.uglemetan.ru) The total mercury content of coal mined in Russia in 2001 was estimated by multiplying the coal mining by region by the estimated average mercury content of the coal for each region and amounted to 22 t (Table 4.4). According to the Refference Book (Valuable and toxic elements in coals commercially available in Russia, 1996 – p. 238), the average mercury content of the commercial coal from each region ranges a factor of 100 from 0.008 mg/kg in Buryatia Oblast to 0.85 mg/kg in the Amur Oblast. The weighted average content of mercury in Russian coal is estimated as 0.08 mg/kg and is very dependent on the average Hg concentration in coal from Kemerovo Oblast (Kuznetsk Basin – a major coal supplier) that account for half of the total mercury content in coal in Russia. Considering that the estimate of the total mercury content in coal is dependent on its average concentrations used for a few of the regions, the uncertainty on the average is estimated to be rather high in spite of the large number of available factual data. It is roughly estimated that the average mercury concentration in Russian coal is within the range of 0.07-0.09 mg/kg and consequently it is supposed that the actual mercury mobilisation by extraction of coal in 2001 will be within the range 20-24 t/year. The coal consumption in Russia is growing and accordingly the mercury mobilisation with coal will be increasing, the actual increase highly dependent on the coals that are mined. Table 4.2 Average content of mercury in commercial coals from Kuznetsk Basin (based on Rugusol, 1996)
Note: Kuznetsk basin is a large raw material facility for coke and chemical and fuel and energy industries; as regards balanced coal reserves it ranks first in the country; of especial importance is coking coal; this coal makes about half of the total production in the basin; energy types of coal also include the following dominant brands �, CC, T, and, to some extent, �. Table 4.3 Coal mining (in FR Ministry of Energy sector*) in 2001, million t (Performance Results of Coal Sector in Russia ..., 2002)
* The remaining small part of coal is extracted by enterprises supervised by the RF Ministry of Natural Resources, local authorities, etc. Table 4.4 Total mercury content of coal mined in Russia by regions, 2001
* Source: Russian Statistical Annual Book. 2002: Statistical Book. - Moscow: State Committee of Statistics, Russia, 2002. - 690 p. ** Calculated on the basis of Rugusol, 1996 (Annex 3). Background data for each basin is shown in Annex 3. For fields where no data is available, the so-called average background content of mercury in coal of the former USSR estimated at 0.05 mg/kg (By V.R. Kler et al. (1988) is used. Pre-combustion processing of coal A part of extracted coal is subjected to pre-processing, including operations of crushing (defragmentation), sorting, concentration, briquetting and drying (Kosinskiy et al., 1997). Crushing of coal may be organised separately or as a preparatory operation for further concentration, briquetting, coking, etc. Sorting of coal is made to divide ordinary coal into classes, containing lumps of specified size. Sorting is performed using sequential sifting of coal on screens, with the mesh sizes according to the size of commercial coal types. Sorting of coal is also widely used for dividing concentration products into class by the size. Briquetting of coal is compulsory for small classes of commercial coal and concentrates that cannot be used in their actual size. Briquetting is also required for long-distance transportation to exclude dusting and freezing of coal dust. Coal concentration is made using gravity processes (for large size coal from 0.5 to 300 mm) and flotation (for concentration of small classes, <1 mm). Foam flotation is the most widely used method. Concentration products are: a concentrate containing the highest purity coal; industrial products containing the highest quantity of coal aggregation with mineral formations; tailings (rocks) that are products with the highest content of inclusive rocks (usually, tailings include a substantial part of pyrite contained in coals, i.e. the main carrier of mercury). By-products of the concentration process include: sifted part, i.e. unconcentrated small-size coal; dust, i.e. coal particles smaller than 0.5-1 mm; slurry, i.e. dusty coal particles accumulated in washing and technological products. Depending on the ash content, by-products are added to concentrate or industrial products. In the course of preliminary conditioning and concentration of coal, most frequently a notable reduction of mercury content takes place, which is, to a substantial degree, caused by the forms of mercury present in coal and by technological specificities of their concentration process, during which pyrite (the main mercury concentrator) is basically transferred to concentration waste (tailings). Ya.E. Yudovich et al. (1985) having summarized the available data about the forms of mercury present in coal note that coal with background (normal) contents of this metal is dominated by two forms: mercury bound with pyrite (Hgpyr) and mercury bound with organic matters (Hgorg). Hgorg, probably, include two forms of mercury: physically sorbed and in compounds with organic matter like humus. In coal with higher content sulphur (with higher concentration of pyrite), the share of Hgorg in the mercury balance is more significant. Coal, abnormally concentrated with mercury, also may include metallic mercury and cinnabar. Such forms of mercury present in coal predefine its distribution in coal concentration products: depletion of commercial products and accumulation in tailings rich with pyrite (i.e. in waste). The above can be illustrated by data shown in Table 4.5, which indicate that concentrates (concentrated coal) are characterized with a far lower concentrations of mercury as compared to ordinary coal. This fact should be taken into consideration when assessing mercury emissions (especially, when using literature data about mercury content in coal). Table 4.5 Average mercury content in commercial products of the Pechora coal basin (Yudovich, Zolotova, 1994)
It shall be understood that not all 270 mill. tonnes of coal extracted in 2001 were immediately combusted. In 2001, only 234 mill tonnes of coal were supplied to the consumer industries but this includes also coal extracted during the preceding years and stored at mines and etc. It shall also benoted that pre-combustion treatment includes crushing (defragmentation), sorting, concentration, briquetting and drying - meaning that some part of coal may only be crushed, another part may only be sorted and etc and etc. Unfortunateky no coresponding statistics is available. From official statistics it is only known that in 2001 domestic concentration factories processed about 77.8 million tonnes of coal or more than 29% of the annual production (Table 4.6). Besides, mechanized installations designed for selection of rocks processed 18.75 million tonnes of coal. Thus, the coal industry totally processed 96.55 million tonnes of coal or over 36% of the total mined coal. Table 4.6 Coal processing at concentration factories of Russia in 2000-2001 in million t (Performance Results of Coal Sector in Russia ..., 2002)
4.1.2 Releases of Mercury to the Environment and Wastes by Coal MiningMercury in waste According to Table 4.6 about 77.8 million t coal was processed producing about 45 million t concentrate in 2002 in Russia. The remaining 32 million t was disposed of as waste from the process. Assuming that the coal on average contained 0.08 mg mercury per kg and that half of the mercury content ended up in the waste, a total of 3.1 t mercury was disposed of with waste of the concentartion process. Besides, some mercury may be disposed of with the rocks. Discharge with waste water The Russian coal industry annually discharges to surface water streams about 550-600 million m3 of wastewater (up to 75-80% of contaminated wastewater, of which, in turn, up to 80% are discharged without cleaning) and emit to atmosphere about 550 thousand tonnes of harmful substances (including up to 60-70 thousand tonnes of solids). It is well known that extraction of coal is accompanied by generation of significant amounts of mining water that has extremely high concentrations of suspended substances (up to 2,000-4,000 mg/l), acid reaction (pH up to 2.5-4.0), increased mineralization varying within a broad range (from first hundreds to several thousands mg/l). For example, when coal was extracted in Kuzbass in late 1990's, more than 100 million m3 polluted wastewater was discharged, containing up to 5-10 g/l of suspended matter, oil products, phenol, chlorides and heavy metals (Zhdamirov, Kuznetsov, 1990). If we assume the average turbidity of discharged wastewater as 3,000 mg/l, then every year up to 1.5 million tonnes of solids will be discharged with wastewater from coal mining enterprises in Russia. Let us assume that the average content of mercury in suspended particles in wastewater is 0.08 mg/kg, i.e. correspondent to its level in coal. (This content is quite in line with the background content of mercury in natural river suspended matter. For example, the background (natural) content of mercury in suspended matter in Moscow Oblast rivers makes 0.068 mg/kg (Yanin, 2003). The real content of mercury in suspended particles in wastewater discharged from coal mining enterprises is presumably above this value). The simple calculations provide that the above amount of suspended matter discharged to water bodies will then contain about 120 kg of mercury. Let us assume that the content of mercury (in its dissolved forms) in wastewater from coal-mining enterprises makes 0.08 μg/l (the average content of this metal in the world's rivers (Gordeyev. 1983)). It follows from the above that annually wastewater discharged to water bodies contains 48 kg of mercury. Thus, the total supply of mercury together with wastewater discharged from coal mining facilities will be about 168 kg. It should be noted that this is a minimum estimate; the real emission of mercury together with wastewater from coal-mining enterprises may be several fold higher. Emission to the air Mercury may be emitted to the atmosphere from the waste. According to data provided by S.V. Alistratov (1988), the average content of mercury in waste from Moscow region coal basin varies from 0.24 to 1.3 mg/kg, reaching in some places the value of 3.3 mg/kg. Concentration of mercury in different waste banks may differ several times, depending on the waste rock that constitute waste banks in different fields, on the time of their placement in waste banks and the intensity of hypergenic processing. The author of the quoted work noted that in case of hypergenic changes in the waste bank ground, some part of mercury evaporates to atmosphere, which conditions the formation of its atmospheric and geochemical streams. Of special importance is self-ignition of coal in mines, open casts, in natural fields and in waste piles, which can be accompanied by mercury release to atmosphere. When waste piles are burning, temperature may be as high as 800-1000°C or more (in hidden cones), which results in destruction of sulphide and clay minerals and burnout of all organic matter. Mercury contained in rocks is sublimed and evaporated to atmosphere. It cannot be ruled out that burning waste piles of coal concentration enterprises may be a significant source of mercury vapour emission to atmosphere, since they have high contents of mercury in pyrite concentrates. According to calculations made by L.A. Dobryansky et al. (1992), out of the entire amount of rocks fed to piles of the coal mines of Gorlovka (Donbass) in 1989, emission of mercury as a result of its degassing made 230 kg/year. Concentration of mercury in atmosphere from waste piles was also confirmed by direct measurements. In particular, concentration of mercury vapours in the air at the waste pile of Gorlovka mines varied, in summer of 1990, from 57 to 13,700 ng/m3; these measurements were made when the metallurgical shop of the Nikitovsky Mercury Enterprise was shut down, i.e., it could not exert any impact on the measurements. The available data indicates that the emission to air from the waste may be significant, but the information is considered to scarce for making an estimate of the emission of mercury from the coal waste. Special investigations are needed. 4.1.3 Use of Coal for Power and Heat ProductionIn Russia in 2001 coal accounted for 34.1% of the energy input for combined heat-and-power plants and 45% of the input for municipal boiler houses. Heat energy is supplied in Russia as follows (Reutov et al., 2002):
According to the statistics from the International Energy Agency (EIA 2003) 127 million t was used for combined heat plants, 34 million t for heat plants (boiler houses) whereas coal was not used for electricity plants without heat production. Behaviour and emission of mercury during coal burning At the high combustion temperatures mercury contained in coal is practically entirely transferred to the gaseous state and, finally, emitted to atmosphere with flue gas or adhered to particles captured by the emission treatment systems. Due to a high volatility of mercury, most existing emission treatment systems are not very efficient in retaining mercury. At present almost no reference data on the efficiency of the different equipment of Russian power plants in retaining mercury exists. Recently, there has been extensive testing of the mercury removable capabilities of various emission treatment systems on a wide range of coal-fired utility boilers in the USA (US EPA 2002). The average results on mercury capture efficiency ranged from a capability of removing 0 to 96 percent dependent on a variety of factors as described in detail below (see Table 4.7). In general the following have been stated:
Cyclones only are not included in the study, but the mercury capture efficiency must be expected to be lower that the result obtained with ESPs. Table 4.7 Average mercury capture in % of mercury input to reduction device (based on US EPA 2002).
(a) Estimated capture across both control devices; SCR - Selective catalytic reduction; CS-ESP - Cold-side electrostatic precipitator; HS-ESP - Hot-side electrostatic precipitator; FF - Fabric filter; PS - Particle scrubber; SDA - Spray dryer adsorber system; FGD – Flue gas desulfurization. The furnishes of Russian heat-and-power generating facilities devices can be divided into fuel-bed and chamber furnaces. In fuel-bed furnaces, the bulk of solid fuel is burned in the fuel bed; in the chamber furnaces it is burned in the suspended condition. Chamber furnaces are divided into flare and vortex (cyclone) furnaces. In turn, flare furnaces used for burning solid fuel – depending on removal of slag and ash – may be with dry (solid) slag removal and liquid slag removal. In Russia, the most widely spread are furnaces with solid slag removal, wherein some part of ash (up to 10-15%) is removed to a slag hopper, while the rest is carried with flue gas to the boiler flue ducts. In furnaces with liquid slag removal (single or two chambers) the share of fly ash is smaller than in furnaces with solid slag removal, though remaining rather significant. In single-chamber furnaces, it makes, on the average, 30-40% while in two-chamber furnaces it is 50-60%. At large (powerful) power generation plants (over 300 MW), they usually use chamber furnaces with solid slag removal, or, more rarely, open and semi-open furnaces with liquid slag removal. In middle-rate power plants (50-300 MW), in addition to the above, they may also use cyclone furnaces. At smaller power plants and in boiler houses (less than 50 MW), cyclone furnaces are mostly used. The Russian energy generation facilities make use of the following types of ash collectors: dry inertia ash collectors, wet ash collectors, electrical filters and combined ash collectors. Cyclones and cyclone units are used to clean combustion products in low-capacity steam generators; battery-type cyclones provide a better removal of collected fly ash and a high efficiency (82-90%). They are installed in boilers with the capacity from 25 to 320 t/h (tonne furnace steam per hour). In wet ash collectors, fly ash is collected by precipitating the fly ash on the liquid film inside the device. For steam generators of low and middle capacity (90-100 t/h) they use centrifugal scrubbers which are vertical straight-through cyclones whose interior system is continuously irrigated with water. For steam generators rated 120-150 t/h, the main type of wet ash collectors is an ash collector having a turbulent coagulators located inside. They also use (usually for middle capacity boilers) vertical and horizontal dry and wet electrical filters. In mid 1990's, the average ash collection factor for the Russian energy industry was estimated at 0.91. For Moscow CHPP this factor was 0.89; in communal sector and industry it was only 0.70 (Kakareka et al. 1998). Boilers of low steam output capacity (< 50 MW), usually used in communal sector, agricultural and small industrial enterprises, are often not equipped with dust collecting devices. In addition some power plants are equipped with SO2 controls including a variety of wet and dry scrubbers and NOx may be controlled by selective catalytic or selective non-catalytic reduction. The efficiency of the flue gas treatment controls of large Russian power plants for control of mercury emission is under evaluation. Considering all stated above, as well as technological features of Russian heat and power generating facilities the relative mercury emissions (as part of its total quantity fed with coal for combustion and/or processing) to the atmosphere is roughly estimated in the following way:
The remaining mercury is bound with ash and slag waste and ash collected by the cleaning installations. The mobilisation and releases of mercury by use of coal for power and heat production in Russia in 2001 is summarised in Table 4.8 (emissions of mercury during coke production are considered in a special section). Large coal-fired power plants are among the major point sources of mercury emission. The emissions from the 129 largest plants of Russia have recently been evaluated (Munthe et al. 2004). The location of the plants and the estimated mercury emission is shown on the maps below (see figure 4.2). Estimated emission from the utility plants is included in Annex 4. As part of the study mercury emissions by major Russian power plants and the mercury content in coal from different coal fields in Russia has been reviewed (Munthe et al., 2004). Averages for fields for which data have been identified are shown in Table 4.9. For other coal-fields a default value of 0.1 mg/kg is been applied in the study. Based on coal amount of 74.4 Mtce (million t coal equivalent) and a breakdown of the coal types used at the 129 major coal-fired utility plants multiplied by the specific mercury content of the coal, the total mercury content of the 74.4 Mtce coal used in the plants is estimated at 9.0 t/year as an average. Using maximum values for the mercury content, the total content is estimated at 11 t. The average value corresponds to an average mercury concentration of the coal of 0.12 mg/kgce. Table 4.8 The mobilisation and releases of mercury by use of coal for heat and power production in Russia in 2001
* The average share of the mercury fed with coal emitted to the atmosphere ** According to EIA (2003) 1.4 million t was used for non-energy applications. Table 4.9 Average mercury content of coal used in Russian power plants ( Munthe et al. 2004)*
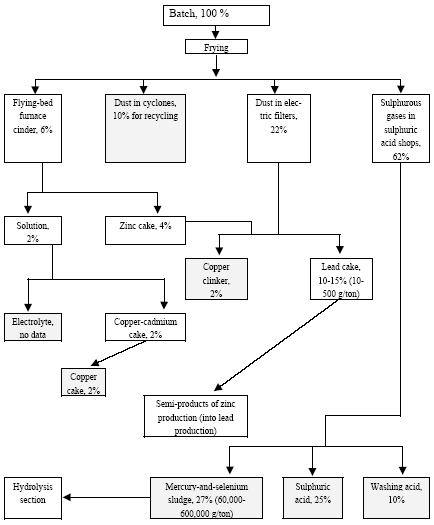
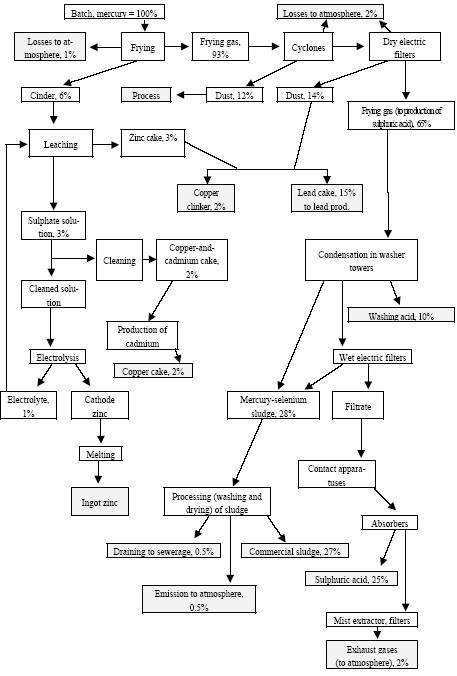
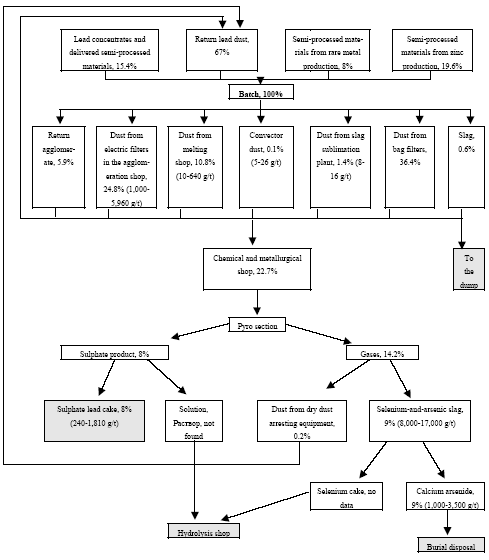
* Only fields for which data are available are included in the table. For other fields a default figure of 0.1 mg/kg have been used. Click here to see the figure.Figure 4.2. Location and mercury emission of coal-fired utility plants in the Russian Federation (Munthe et al. 2004) 4.1.4 Production of CokeIn total 29,997 t coke was produced in Russia in 2001. The production of coke by enterprises is shown in Table 4.11. By the beginning of 2002, the Russian coke production sector included 12 by-product coke enterprises, which had 62 operating coke-oven batteries (3,851 ovens) with the total rated output of 39,066 thousand tonnes of coke (6% humidity) a year (In Russian By-product Coke ..., 2002). Of them, 59 batteries with the capacity of 36.9 million tonnes were permanently used (3 batteries were out of use). A significant part of equipment used by by-product coke enterprises is outdated (in 2000, the average age of coke-oven batteries was 22 years). As a rule, practically all coke-oven batteries are insufficiently equipped with efficacious dust and gas cleaning devices. Modern by-product coke enterprises represent a production unit that produces not only coke, but also other materials. For example, the by-product coke enterprise Nosta OJSC includes a coal-conditioning shop, two coke shops, a shop for production of ammonium sulphate (used in agriculture as fertiliser), coal tar (processed to obtain commodity products) and raw coal benzene (for manufacture of benzene organic hydrocarbons), a biochemical installation for treatment of wastewater from facilities producing phenol, rodanide and planide. By-product coke enterprises remain the main suppliers of raw materials for production of plastics, chemical fibres, paints and other synthetic materials. The share of by-product coke enterprise products in the raw materials used by industries for base organic synthesis is up to 50%, and that of such important products as benzene is up to 80%, of naphthalene and creosol almost 100%. The non-ferrous metallurgy is the user of low-ash caked coke and binders produced from coal tar. Coke is used for preparation of anode mixtures used for making of aluminium. Hydrogen from coke gas and nitrogen from oxygen stations of metallurgical enterprises are used to produce nitric fertilizers. Chemical coking products are also used for production of chemicals for protection of plants and animals. Processes and technologies Coke production includes the following stages: processing and storage of coal, loading of coal to coke ovens, quenching of coke, and cleaning of coke gas. Coke is produced by dry distillation of coals in coke ovens collected in coke-oven batteries (40-70 ovens each). A coke oven represents a chamber with the width of 0.4-0.45 metres, length of 15 metres and height about 5 meters. The useful volume of the chamber is 30 m3, while the weight of fed blend is 22 tonnes. Coal blend, which frequently is a mixture of coal from different blends, is fragmented in the disintegrator before caking, and then is loaded into coke ovens where it is heated to 1000°C (without air) and is kept for 15-16 hours. During heating coal loses about 30% of its weight due to generation of gases and resin. Useful products of this process include coke and gas of an average calorific value. The capacity of a modern battery reaches 1,500 t/day. The blend is fed to the ovens from the top. After the coking process is over, a special device pushes the coke (the cake) out of the oven to the quenching car and then it is fed to the quenching tower. Here, coke is cooled with water (wet quenching) or inert gas (dry quenching). Raw materials The raw materials used for production of coke include special brands of coal. For coking processes, usually they use a mixture of coals in a predetermined ratio. Basically, they use coking coal, steam fatty coal, steam caking coal and gas coal. One ton of a dry blend gives 750-800 kg of coke and 320-330 m3 of coke gas. The main source of raw materials for the Russian coking enterprises is the Kuznetsk coal basin (85% of raw materials). For example, only in Kemerovo Oblast they extract up to 70% of all Russian coking coal, while as regards specially valuable coking coal they produce here 100%. The average content of mercury in coal from the Kuznetsk basin, calculated according to data (Annex 3), is 0.08 g/t. In coking coal from the Pechora basin the mercury content varies from 0.01 to 0.1 g/t (0.05 g/t on the average). Certain enterprises in Siberia sometime use coking coal from the Karaganda coal basin. The content of mercury in the commercial concentrate is usually lower than in regular types of coal. Sources and characteristics of dust and gas emission The main sources of dust and gas emission are processing and storage of coal, coking of coal and its quenching. Coke dust is generated when coke is fed from oven chambers, transported, sifted, fragmented and shipped; when dry quenching plants are used, such dust is generated from fore-chambers and smoke pipe bleeders. Ash can be released from flue pipes; such ash is generated in heating systems of coke-oven batteries when they are not tight resulting in raw coke present inside heating channels (Pyrikov et al., 2000). Unorganized release occurs when the coal blend is fed to oven chambers, or when coke is dispensed and quenched. Organized release occurs from exhaust pipes of the aspiration systems at transport facilities, fragmentation, separation, and drying of blend, as well as during re-loading and sifting of coke. Maximum releases of dust occur during dry quenching of coke, loading of coke to hoppers and from final combustion bleeders, as well as during unloading of hot coke into cars. Release during the process of caking occur due to leakage through the doors of the oven chamber, hole lids, etc/ during coking the bulk amount of volatiles is generated. The content of dust in inert gas after the quenching hopper is 4-10 g/m3 (Stark, 1990). When coke is removed from the ovens and as a result of leaking doors, up to 35% of coking release occur on the coke side of the battery (Bondarenko et al., 2002). Dust and gas removal Cleaning process is mandatory for coke gas if, during processing, vapours, resin and water are condensed, and ammonia and benzene hydrocarbons are trapped. Aspiration systems of the coal-conditioning and coking shops, as a rule, are equipped with cyclones and wet dust traps, whose efficiency makes 96-98%. The most efficient method to reduce release during the feeding of the blend is smoke-free loading: generated dust and gas are sucked by a steam or hydraulic injector to a feeder by which dust and gas are fed for cleaning. When dry quenching is used, dust is first entrapped in the inertia dust trap, and then in the cyclone. When coke is unloaded, as a rule, the dust is not trapped. On the average, when coke is produced, the content of coke and coal dust varies from 0.055 to 3.2 kg per tonne of products (Materials on Specific ..., 1987; Methodological Instructions for determination ..., 1987). The specific release of coke dust proper varies from 0.05 to 2.5 kg/t of coke. Some time ago, the USSR Ministry of Ferrous Metallurgy developed the average sectoral indicators for specific release of dust from by-product coke enterprises; they made 2 kg/t of coke (characterization of Specific ..., 1989). For comparison, the coke enterprise of Western Europe have dust release from quenching process that does not exceed 10 g/t of coke, while the residual content of dust per enterprise makes 5 g/t of coke (Kovalev et al., 2001). Inventory of releases at a number of coke enterprises of Russia has demonstrated that dust releases from organized sources make 30% of the total release, while at enterprises using dry quenching it is up to 70% (Pyrikov et al., 2000). Gas cleaning and aspiration systems usually use centrifugal inertia dust trapping devices, i.e. cylindrical and cone cyclones (the degree of cleaning is 93-98%). Wet dust traps are used very often; they are applied to remove dust from aspiration air and coal-drying gases (which results in the problem related to processing and disposal of slurry water). As regards wet dust traps, the most regularly used are centrifugal scrubbers with sprinkled rod lattice in the inlet pipe and regular brands. The degree of removal of coal dust in centrifugal scrubbers varies from 85 to 98% (90% on the average); this rate for coke dust removal is 30-97% (90% on the average). Also used are cyclones with a water film (the degree of coal dust removal 89-97%, of coke dust 88-90%), speedy scrubbers or straight-through wet cyclones (the degree of coal dust removal 80-98%, of coke dust 85-95%). The scatter of indicators is due to different levels of maintenance of equipment at enterprises. At some domestic enterprises they use gas scrubbers with Venturi pipes. An the whole, the efficiency of dust and gas removal installations at coke production enterprises in CIS countries is estimated at about 90% (Emissions of Heavy Metals..., 1998). Mercury in by-product coke production Some years ago Ukrainian specialists studied distribution of mercury in coking products (Karasik, Dvornikov, 1968). Ordinary coal brought up to the surface from mines and quarries is concentrated so as to remove rocks, eliminate high ash differences and pyrite concretions (usually, with a high mercury content). During concentration mercury is distributed as follows (Figure 4.3): its bulk is converted to concentrate (up to 58-62%) and to waste, i.e. discarded rock and tailing (up to 24-26%). It is noteworthy that according to data (Yudovich, Zolotova, 1994), the commercial products from the Pechora basin (Vorkuta and Vorgash deposits), the average mercury content was: in ordinary coal – 0.073 g/t, in concentrated coal – 0.04 g/t, in sifted coal – 0.039 g/t, and in industrial products – 0.05 g/t. such (in this case specific) distribution of mercury, in fact, is correlated with the above data (its content in concentrate is about 55% of its content in ordinary coal, and about 68% in industrial products). As has bee stated, temperature in coking ovens is 1000°C or more, which results in practically complete transfer of mercury from the blend to direct coke gas, and then to different products of solid, liquid or gaseous phases of by-product coking process (Karasik, Dvornikov, 1968). Mercury is accumulated in condensation products, generated during cooling of raw coke gas, in particular in coal tar. Further, during distillation of resin it is deposited in the separator and the collector of light oil. As regards the sulphate compartment, mercury was not found in ammonium sulphate; in the scrubber compartment, mercury was not found in the return gas, but it was present, in significant quantities, in the saturated solutions from sulphur cleaning, in raw benzene, and in polymers; mercury also was found, in significant quantities, in a range of rectification products like heavy benzene, xylene, toluene and in pure benzene. It was also present in some products and waste of resin distillation process (e.g. in naphthalene oil, anthracene fraction, and in pitch).
Figure 4.3 Mercury flow by coke production (according to data (Karasik, Dvornikov, 1968), with supplements and details). 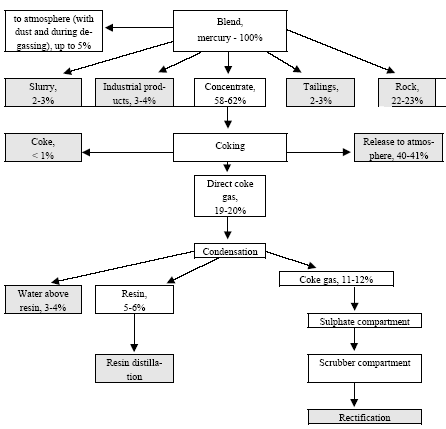
Assuming the average content of mercury in the blend at 0.076 g/t, one million tonnes of blends will contain 76 kg of mercury. It is known that 1 ton of dry blend produced up to 800 kg of coke (i.e. one million tonnes of blends will give up 850 thousand tonnes of coke). During by-product coking process the above quantity of mercury is distributed approximately as follows (see Table 4.10). Table 4.10 Approximate distribution of mercury during coking process
In total 2.8 t mercury were in 2001 mobilised with coal for coke production. The specific mercury release to atmosphere will be, in general, at 0.043 g/t of produced coke, including 0.0385 g/t during the coking process and 0.047 during blending. Thus, even at rather low mercury contents in coals, Russian coking producing enterprises receive a notable quantity of this metal. Its substantial amount, 1.3 tonnes in 2001, is emitted to atmosphere, basically with flue gases of the coking process (Table 4.11). About 0.8 t ended up in waste products, about 0.6 t followed the products, and 0.1 t was released with waste water. Table 4.11 Mercury emission to atmosphere in Russia from coke production, 2001
* Source: (Annual Report of the "MMK" enterprise...; "Metallurgist", 2002, No. 1; Novolipetsk Metallurgical Combined Enterprise. Annual Report ...; Ferrous Metallurgy Urfo ...; http://metal.interfax.ru/test_metal....; http://www.ako.ru/PRESS...; http://www.infogeo.ru;) ** In 2002. *** Estimated by the authors. 4.1.5 SummaryThe mobilisation and releases of mercury by use of coal in Russian in 2001 is summarised in Table 4.12. The total mercury mobilised in extracted coal amount to 22 t (20-24 t). The total releases to the atmosphere and to coal extraction and consumption waste products are estimated at 19.8 t. Besides, some 0.5 t ends up in chemical products from coke production. A part of mercury goes with coke and co-products and is among others included in the estimate for releases from ferrous metallurgy. Table 4.12 Mobilisation of mercury by use of coal in the Russian Federation in 2001
n.a. : not assessed * Some of the mercury ending up in waste from the concentration of the coal is included in the estimate for "Coal extraction and processing" ** calculated on the basis of the unprocessed coal. By the processing of the concentrated coal 66% of the mercury content of the concentrate is estimated to be emitted to the air. *** Do not include waste rock. 4.2 Oil, Natural Gas, Oil Shale and Biofuel4.2.1 IntroductionMercury content of crude oil and raw gas vary considerably. In order to obtain an accurate estimate of the total mobilisation of mercury by use of oil and gas in Russian it is consequently necessary to obtain a large number of measurements of samples from the main oil and gas fields. Besides the mercury content of crude oils processed at the different oil refineries may be very varying. As background for the estimates of mercury mobilisation by use of oil and gas the following introduction discuss the distribution of mercury in oil and gas from a geological view. The range of variations of the mercury content in raw gas and oil are rather considerable ( Table 4.13.) Table 4.13 Range of mercury content in oil and gas fields in the world
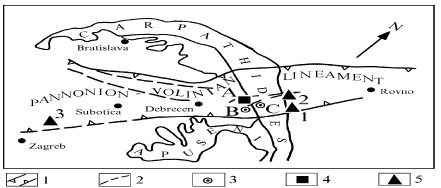
This variation is caused by geological factors – the main reason is location of mercury-containing deposits in areas of mantle regional faults, wherefrom mercury as part of fluids (mercury degassing of the Earth) is coming into areas of gas, oil and ore formation and takes part in these processes. One of such areas is the Karpinsky lineament (see figure 4.4), extending from southeast to northwest, from Amu-Darya depression to North-German depression of the Middle European platform (Ozerova, Pikovsky 1985; Ozerova 1986; Ozerova et al. 1989). This structure is related to known gas and gas-oil fields in Netherlands, Germany and Poland with a high content of mercury; within this structure the mercury-containing deposits have also been found on the territory of the former USSR, however with smaller mercury concentrations. The Karpinsky lineament includes not only deposits with high mercury concentrations, but also with rather low concentrations. This can be explained in terms of geology. What is important is the fact that identifying increased contents of mercury in any oil-gas province field, the findings cannot be adapted for other deposits in the same province. One more example of such structures similar to Karpinsky lineament is Pannonion-Volinian lineament (see Figure 4.5), controlling the disposition of mercury-bearing oil-gas, gas and ore deposits on the territory of the Eastern Europe, including Ukraine (Pre-Carpathians depression). (Ozerova 1996; Ozerova et al. 1999). Click here to see the figure.Figure 4.4 Location of mercury-bearing gas and oil-gas deposits within Karpinsky lineament Figure 4.5 Pannonion-Volinian lineament
Another geological circumstance is that it has been established that the content of mercury vary in gas and gas-oil fields both within the province and in individual fields. This is demonstrated in Table 4.14 and Table 4.15 (Ozerova 2002; Ozerova, Mashianov 1989; Ozerova, Dobryansky 2001). For us important is the latter fact which suggests that mercury contents should not be assessed in the deposits by single mercury determinations, but rather must take into account from which level and in which proportions the samples are taken from various depths. Table 4.14. Content of mercury in gases from Mirnenskoye deposit Northern Caucasus (Karpinsky lineament)
The third circumstance is that in the recent year at Mirnenskoye deposit (Russia) and Oposhnyanskoye deposit (Ukraine) a definite periodicity has been found (from several hours to several days) in the change of the mercury concentrations in gases, related to the periods of movements of the Earth's proper rotation (Ryzhov, 2000; Ryzhov et al., 2003). The interval of variations in the inspection wells changed from 10 to 80% of the average content of mercury in gases. And we do not know whether these are limit values or they may be higher. Accordingly, this can have impact on the quality of testing. Table 4.15 Content of mercury in gases from the Dnepr-Donetsk depression (Karpinsky lineament)
Long-term variations of the content of mercury in natural gases are of a higher importance. In particluar it has been detected taht concentrations of mercury may be different in different years in the same wells – 15-20 times. And there are no clear reasons for that. Analytical aspects are not less important. For instance, formerly used turbocolometric chemical methods of Hg microconcentrations detection (Saukov and co-authors, 1972 and methods of direct differential atomic-absorption analysis of mercury in a flow of gas (Ganeev et. Al., 1995, Ganeev, Slyadnev, 1996) determine only the atomic mercury, while the share of organic mercury and other mercury compounds was not known. Experiments using pyrolysis (temperature in the reactor was kept at the level of 750-800 °C) and photolysis (temperature in the reactor was stabilised at about 50-60 °C) demonstrated (Table 4.16) that organic mercury when the compounds are decomposed by photolysis and pyrolysis account for 30% of the total content (Ganeev, Maidurov et. al., 1996, Ozerova et al., 1999). These preliminary two experiments indicates that the actual content of mercury in the gas is higher than previously measured, but the research should be continued. Table 4.16 Content of atomic (HgO) and organic (HgR) mercury forms in natural gas
4.2.2 Mercury in Oil and Gas Raw MaterialsCrude oil Data on the content of mercury in oils in Russia are very scarce (Table 4.17). They do not include data about mercury concentration in oil of the main Russian oil fields. By today forty-two sites have been investigated in more or less details ; the data on the content vary from 3•10-3 to 6.9 mg/kg. The average content is 0.30 mg/kg. For the samples from Russian fields the average mercury content is estimated as 0.18 mg/kg. It should be noted that the oil samples from Russia are mostly from the southern part and includes fields with known relatively high concentrations of mercury. However, it cannot be concluded that the measured average most probably will be higher than the actual average. In order to obtain a more accurate estimate oil samples from the main Russian oil fields should be analysed. Table 4.17 Content of mercury in crude oil from CIS countries
* Data by Yu.I. Zherebtsov, V.V. Ryzhov, N.R. Mashvanov. It should be stressed that the high concentrations of mercury are detected in those deposits related to regional zones of deep faults, in their activation sections – e.g. deposits located on the territory of the former USSR and Russia, related to Karpinsky lineament and Pannonion-Volinian lineament – Dnieper-Donetsk depression, Pre-Carpathians flexure, Belarus, Baltic countries, the Northern Caucasus, Kazakhstan etc. (see figures 4.4 and 4.5). Another type of structures controlling the mercury-bearing oil deposits are global mercury belts with cinnabar deposits; the Table 4.17 presents the deposits of Sakhalin, which constitute a part of the western framing of the global Pacific mercury belt. The value of 0.3 mg/kg accepted as an average mercury concentration in oil is lower than the average content of 7.2 mg/kg proposed by V.V. Ivanov (Kakareka et al., 2000), but significantly higher than the average applied for the USA in the most recent assessments where the average Hg content in oil is estimated to be within the range 0.005-0.05 mg/kg (Wilhelm 2001). The difference may reflect real differences in mercury content of the crude oils. Mercury content in hydrocarbon gases and condensate The content of mercury in natural hydrocarbon gases of Russian gas fields is shown in Table 4.18, respectively for free gases (from gas wells) and casinghead gas (from oil wells). The range of content of mercury in free gases are: 5•10-8 – 7•10-5 g/m3 (the average content 2.4•10-6) and in casinghead gases: 7•10-8 – 1.4•10-5 g/m3 (the average 3.4•10-6). The highest content of mercury – up to 20•10-6, 40•10-6 and 70•10-6 g/m3 is observed in some deposits of Stavropol arch (the metallic mercury was detected at one of the technological units of PPP in Blagodarny town). This structure is a fragment of the Karpinsky liniament mentioned above. In addition to values stated in the table 4.18, there are two more publications mentioning mercury in Russian gases: first, the article by L.M. Zorkin et al. (1974) in which only two figures can be considered as authentic – for Stepnoye and Ravninnoye fields. The second mentioning was in the article by A.I. Gritsenko et al. (1993), which includes data on mercury content in natural borehole gas in the Astrakhan field: (0.3-2.5 •10-6 g/m3). As regards other figures in this work, they are mistakenly overestimated. Table 4.18 shows the contents of mercury in condensate from three large gas fields of Russia - Orenburg, Astrakhan and Karachaganakskoye fields, as well as from Ukrainian fields, so as to present possible variation. The highest mercury concentrations were recorded for Oposhnya field - up to 1.95 mg/kg. As was shown above this field is characterised by rather high content of mercury in gas. There are two types of condensate: raw (unstable) released from gas during field extraction and stable obtained at the gas processing plants GPP. A smaller amount of condensate which is sent to GPP is also obtained in oil-gas-condensate fields. Table 4.18 Content of mercury in free gas (without condensate) and casinghead gas in Russian fields *
* By the data of N.A. Ozerova 1986; Ryzhov, Mashvanov; **Stepanov (Zorkin and co-authors, 1974) Table 4.19 Content of mercury in condensate from gas fields*
* data of N.A. Ozerova, V.V. Ryzhov, N.R. Mashvanov ** Unstable condensate Summary The available data on mercury in hydrocarbon raw materials from Russia is summarised in Table 4.20. Comparison with data on crude oil and condensate from some other countries (Table 4.21) shows that mercury content in the crude oils and condensate from Russian fields is within the range of concentrations found other countries and also that there is a high variation in the content of mercury in the hydrocarbon raw materials from different parts of the world. The variation of the data may beside the geographical variation be due to differences in sampling methods, handling techniques, analytical techniques, etc. Table 4.20. Mercury content in hydrocarbon raw materials of Russia
Table 4.21 Mercury content distribution in some countries (summarized references) (based on Wilhelm 2001)
4.2.3 Mercury Mobilisation with OilFor a first highly tentative estimate of the total amount of mercury mobilized in oil produced in Russia in 2001, its average concentration of 0.18 mg/kg will be used It should be noted that a significant part of the data presented in Table 4.17 relates to the fields containing oil with relatively high concentrations of mercury. The total production of crude oil in Russia in 2001 amounted 336 million t. Assuming an average mercury content of 0.18 the total mercury content of the crude oil can be estimated at 61 t (Table 4.22). It should be noted that this is a very tentative estimate. The average mercury content in the crude oils is used, i.e. before water and salts are removed from it during primary treatment. Primary phase separation A significant amount of mercury may be removed from the crude oils before the oil is transported to oil refineries, however a very limited information exist on the fate of mercury by the primary phase separation (Wilhelm 2001). A significant share of oil produced in Russia is extracted from wells as a water emulsion. Such wells with high water content include more than 80% of the wells in operation in 2001. (The press release for the 8th International Exhibition of equipment for the oil and gas industry "Neftegaz-2000, 2000). When oil is produced, it always includes formation of water (from less than 1% to 80-90% by weight) that is dispersed in oil, thereby forming a water-in-oil emulsion. The formation water, as a rule, contains high concentrations of sodium, magnesium and calcium (up to 2500 mg/l of salts, even when oil contains only 1% of water), as well as sulphates and hydrocarbonates and also contains mechanical admixtures. The typical content of water in crude oil is 200-300 kg/t, of mineral salt up to 10-15 kg/t; besides, crude oil contains associated gas (50-100 m3/t) (Bogomolov et al., 1995). Probably, a part of mercury is present in the formation water and in mechanical admixtures. Before oil is transported to the refineries, it is required to remove gas, mechanical admixtures, and the bulk of water and salt (Bogomolov et al., 1995; Levchenko et al., 1967). Some processes of the initial oil processing are carried out at high temperatures. Using first stage separators, oil gas is separated from crude oil; then practically degassed oil is fed to oil conditioning units where the second and the third stages of separation of gas from oil take place, as well as dewatering and removal of salt from oil. Dewatering of oil is performed in oil fields, usually by thermal and chemical; methods of destruction (separation) of the water-oil emulsion using also de-emulsifying agents (i.e. carious surfactants) at the temperature of 50-80°C. During salt removal, salts and water left after dewatering process are also removed from oil. Salt removal includes mixing of oil with fresh water, destruction of the formed emulsion and followed by separation from oil of wash water together with salts and mechanical admixtures that were transferred to it. Dewatered and de-salted oil is fed to sealed tanks, and then to the plant designed to estimate oil quantity and quality, after which it is fed to commercial tanks wherefrom oil is pumped to the main oil pipelines. Oil refineries and petroleum products Almost a half of all Russian oil is exported to CIS and other countries, but its greater part is transported to Russian oil refineries (OR) for primary refining. According to data given in Table 4.22 the total mercury content of oil delivered to the oil refineries can be estimated at 32 t. This amount will be used as representing the total mobilisation of mercury in the xtracted oil in Russia in 2001. Based on a very rough estimate and considering the uncertainties on the average Hg concentration in Russian oil, the amount of the mercury mobilised shall vary at 5-50 t/year. The mass of mercury actually transported to the oil refineries may, however, be less than this, as a part of the mercury most probably is released by the first stage oil treatment. Table 4.22 Mercury in oils of the Russian Federation, 2001
*The State Balance... Oil, 2002 **Social and Economic Situation ... 2001 ***Ratex ****The average have been applied based on the summarized dataset on former Soviet republics The oil is refined at refineries, petroleum-chemical plants, Gazprom enterprises and some small oil. Refinery is a basic oil processing process. This is a physical process based on difference of temperatures. It takes place in rectification columns wherein oil is fed under atmospheric pressure, heated to 300-350 °C. Obviously the bulk of mercury is released from this oil and ends up in the refined products and waste or is released to the environment. It has been possible to analyze Hg content in only single samples of petrol, diesel fuel and heavy oil. The samples was obtained in the Astrakhan gas and oil refinery (see section "Mercury in gases"). The detected mercury concentrations were used for a first tentative estimate of the total content of mercury in oil refinery products. According to the estimates in Table 4.23 the petrol, diesel fuel and heavy fuel oil (mazut) used in Russia (domestic supply) contained a total of 3.4 t mercury. It is assumed that almost all this amount will be released to the atmosphere by the combustion of the products. Unfortunately, no data has been available on mercury in other refinery products like bitumen, petcoke, sulfur, etc. These products may contain significant amounts of mercury. Available estimates are very uncertain and more analyses and call for further special studies of mercury content of crude oils and refined products, the fate of mercury by oil refining and mercury in oil refinery products. Comparing the mercury content of the refinery products with the content of mercury in the crude oils indicate that a major part of the mercury could released by the initial treatment, be emitted from the refineries or end up in some waste products from the refineries. The uncertainty on the estimates, however, does not allow drawing any precise conclusions. A study of the fate of mercury by oil refining in the USA indicates that about 3 % of mercury is released to the atmosphere and wastewater, 11 % goes to solid wastes, 67 % - to the products burned as fuels, and 17 % - to the feedstock for chemical industry (Wilhelm 2001). According to the information obtained by the author of the present work, investigations in Canada indicate that more than 90 % of mercury passed all feedstock processing stages is released to the atmosphere. The mercury releases to air and wastewater significantly depend on the specific oil refinery technology e.g., mercury content in flue gases in Astrakhan Gas Processing Plant was dependent on the performance of the installation with sulfrine (see section 4.2.4) - if it was not operated, Hg content in flue gases is 10 times increased which is consequently followed by Hg air emissions increase. Use of zeolites for the flue gases treatment allows to dry the gas and remove mercury with the moisture. Table 4.23 Mercury in basic oil refinery product in the Russian Federation, 2001
* EIA 2003. The difference between production and domestic supply is exported. 4.2.4 Fate of Mercury by Natural Gas ProcessingIn order to discuss the mobilisation of mercury with natural gas and the fate of the mercury in the gases, investigations of the fate of gas in gas processing plants is discussed in this section. In the recent time gases from Astrakhan, Orenburg and Karachaganarskoye fields, being large fields in Russia, have been studied. Not only natural gas from these fields has been studied, but also products of gas processing at Astrakhan and Orenburg gas-processing plants (GPP). They have been examined in details and we consider them as standard reference, therefore, we provide complete factual data on these fields and plants (Table 4.24 and Table 4.25). The feedstock for the gas processing plants is natural gas, unstable condensate (released from gas during field extraction) and condensate obtained in oil-gas fields. By the processing stable condensate is produced. The stable condensate is used as feedstock for further processing and is widely used as motor oil. Based on the tables (Table 4.24 and Table 4.25). the following aspects should be emphasised here. At Astrakhan GPP condensate generated during decomposition of the mercury-containing gas-condensate mixture has a noticeable content of mercury (see Table 4.24). Gas is then processed to remove sulphur (de-sulphurised) and is noticeably depleted in mercury while sulphur-containing gas is the raw material for production of sulphur. a similar picture can be seen at the Orenburg GPP (see Table 4.25). Finally, sulphur contains mercury 1.5-2.0 times higher than the average of the earth's crust – 0.05 mg/kg. Hg concentration values vary from 0.01 up to 0.1 mg/kg; the average value is respectively equal to 0.06 and 0.09 mg/kg for Astrakhan and Orenburg GPP. The mercury concentration is rather low in heavy fuel oil, diesel fuel and petrol. However, these are only single determinations (sample number = 1) and may not be representative. Table 4.24 Mercury content at the Astrakhan gas-processing plant
* This is the calculated figure, since we analyse separately mercury in gas and in condensate and then, knowing the amount of condensate in m3 of gas, we estimate the total content of mercury in the gas-condensate mixture. ** Limits of detection of equipment. *** Content of mercury is increased when the plant with sulphrine is not operated. ****When there is a plant with sulphrine, the content of mercury is gradually decreasing. Table 4.25 Mercury distribution at Orenburg gas-processing plant
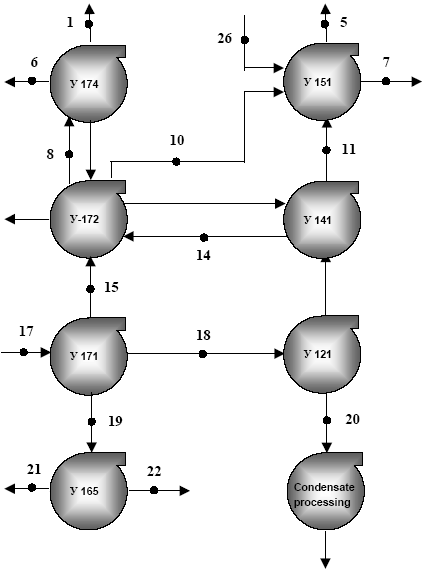
* Limits of detection of equipment The commercial gas at Astrakhan GPP contains not more than 0.1•10-6 g/m3 of mercury; at Orenburg plant the average in commercial gas is 0.48 •10-6 g/m3. At Astrakhan GPP, flue gas contains less mercury (close to MAC) than at Orenburg GPP, where on the average it is approximately 10 times higher than MAC (the reasons have not been investigated). It should be specially noted that the plant with sulphrine in Astrakhan GPP, is very effective for purification of flue gas from mercury (see Table 2.24 and the notes). Technological water contains little mercury. Atmospheric air in the area of this field and at the area of the GPP is not polluted with mercury. Balances for basic feedstock and basic products of Astrakhan GPP are set up in Table 4.26. Gazprom JSC is the largest joint-stock company in Russia. In 2001 Gazprom developed 87 % of total Russian gas production volumes, supplied 90 % of gas to the United Gas Supply System and exported 96 % of total Russia export to Europe. As it was mentioned above, investigations of mercury content have been done in three large fields – Orenburg, Astrakhan and Karachaganakskoye, which are operated by Gazprom JSC; the main focus was given to Astrakhangazprom Production Complex as a typical model of Gazprom branches in respect of structure of extraction and processing of the hydrocarbon feedstock (see table 4.25). The total amount of mercury in the feedstock supplied to Astrakhangazprom in 2001 had totalled 2.4 t and 1.1 t in the output if we assume that the concentration in the feedstock resemble the average. The total volumes for Gazprom GPP amounted to 5.8 t and 2.1 t respectively (see table 4.27). It is notable, that the main amount of mercury (0, 741 t – for Astrakhangazprom and 1,693 t – for all Gazprom GPP) is connected with the condensates. Figure 4.6 Scheme of processing of the gas and condensate mixture at the Astrakhan gas-processing plant
� 121-� 174 are the units for processing raw gas and condensate Nos. 1-26 in the scheme are bays for sample taking for mercury analysis: gas stratum mixture – 17; gas separation – 15; middle pressure gas – 14; gas with sculpture removed – 8; commercial gas – 1; unstable condensate – 18; stable condensate – 20; acid gas – 10 & 11; flue gas – 5 & 21; condensed water – 21; formation water - 19; zeolite – 6; spent catalyst – 7. Table 4.26 Amounts of mercury contained in gases, condensates and products of their processing at Astrakhan GPP, 2001. (Annual Report........., 2002)**
Mercury in main pipelines The content of mercury in main pipeline gas is compared to the mercury content of the gas feedstock very low (see Table 4.28). In 1990 the content was <0.03 – 0.1 μg/m3 and in 1991 it was <0.03-0.05 μg/m3. But these are not necessarely factual values of Hg content in gases from Urengoy and Yamburg from where they are delivered. According to experience of Groningen (Holland) the gas is depleted in mercury by passing by pipelines through W. European countries; probably due to amalgamation of gas pipeline walls. Probably, this takes place also in Russian gas pipelines, moreover as their length is much higher that the W. European, and the almost Hg-free gas is exported to other contries. Table 4.28 Content of mercury in natural traded gas from main pipelines
4.2.5 Mercury Mobilisation with Natural Gas and Gas CondensateBased on the above, a rough estimate of mobilisation of mercury by the extraction and use of natural gas in Russia is summarised in Table 4.29. The estimate indicates that the main source of mercury for the gas processing industry is mercury in gas condensates. As a best estimate some 8.2 t may be mobilised with natural gas and gas condensate. Considering the high uncertainty, the range is estimate at 2-10 t mercury per year. It is very certain that only a small amount, 0.03 t mercury, ends up in the gas for export and domestic consumption. Consuderable amount of mercury ends up in other products, in particular stable gas condensate. The total mercury in products does not fully balance the estimated total in feedstock illustrating that all estimates on mercury in feedstocks and products are very uncertain. The obtained estimates indicate that a significant amount of mercury may be mobilised by production of natural gas and gas condensate and call for further studies of the fate of mercury by processing and use of products. There have been no estimates on the flared gas volumes obtained for all Russian fields, but for Western Siberia it was in 2001 about 19 billion m3. By using the average content of mercury in casinghead gas, the flared gas would contain 65 kg of mercury. The mercury emission from flaring is most probably higher than from combustion of the processed gas. Table 4.29 Mercury balance in RF gas industry in 2001
* Source: EIA 2003, Conversion factor: 38 TJ/million m3. ** Estrapolated from data in 4.26 ***includes losses in the pipelines 4.2.6 Oil shaleIn 2001, about 1.5 million of oil shale was produced; the overwhelming part in the Leningrad Oblast. This product mainly is sent to the oil shale processing plant (town of Slantsy, Leningrad Oblast). Much smaller amounts are produced in the Kashpir deposit (Volga region) and some other places. Oil shale from the Kashpir deposit is dent for processing to the Syzran shale processing plant. Oil shale is also used in Slantsy and Syzran as fuel for local CHPP; the main part is used in the town of Slantsy. Content of mercury in oil shale of the Leningrad Oblast is estimated at 0.4 mg/kg on the average, similar to oil shale from Estonia (Table 4.30), since these two facilities belong to the same Baltic basin of oil shale; conventionally – along the administrative border between Russian and Estonia, which separates these two deposits. Similar contents of oil shale as in Estonia have been identified in the Kashpir deposit, the average being 0.44 mg/kg. Table 4.30 Content of mercury in oil shale (Ozerova, Aidinyan, 1966)
Note: in brackets the number of samples. Using the value of 0.4 mg/kg and considering the uncertainty the total mercury content of the oil shale extracted in 2001 can be estimated at 0.6 (0.4-0.8 ) tonnes. In Russia, oil shale is mainly used for energy production and is connected with its high temperature processing conditioning a greater part of the contained mercury to emit to the atmosphere and the least part to be concentrated in the residues. As a first estimate it will roughly be assumed that 80% of the mercury is emitted to the atmosphere (0.5 t); 20% is deposited with residues (0.1 t). 4.2.7 WoodIn 2001, about 5.7 million tonnes of conventional fuel units of wood were used for generating energy in Russia. If we take the factor for conversion of convention fuel units (by coal equivalent) to tonnes wood that equal 0.266 (according to Methodological Regulations ..." of the State Committee of Statistics, 1999), we get 21.4 million tonnes wood. It has not been possible to identify data on mercury in wood in Russia. According to Danish research (Skårup et al. 2003) the mercury content in burned wood and straw is within the range 0.007-0.03 mg/kg of dry weight. According to American data (Friedly et al. 2001), mercury content in waste and green vegetation is 0.01-0.07 mg/kg of dry weight – by results of surveys performed in 7 regions. For inventory of mercury emissions in the USA, the magnitude of the average factor of release for the burned wood was taken at 0.026 mg/kg – the typical release factor for combustion of wood waste in boiler houses (US EPA 1997). To calculate relevant figures for combustion of wood in houses, they also used the factor 0.026 mg/kg. Swedish researchers ((Kindbom & Munthe 1998) established the concentration of mercury in firewood at 0.01-0.02 mg/kg of dry weight, willow wood – 0.03-0.07 mg/kg of dry weight, in wood bark - 0.04 mg/kg of dry weight, and somewhat higher concentration in fir-tree needles at 0.3-0.5 mg/kg of dry weight. On the basis of these data we used the value 0.01-0.03 mg/kg. To calculate the Hg emission with wood combustion we took the magnitude 0.02 mg/kg. In such case, the total amount of mercury released to the atmosphere during burning of wood can be estimated for 2001 for Russia at 0.4 (0.2-0.4) tonnes. Mercury released during wood fires, which may be very significant, is not included in this study. 4.2.8 PeatIn 2001, about 4.6 million tonnes of peat was extracted in Russia; of this amount, about 10% is used as fuel (i.e. 0.46 million tonnes), and the remaining part in agriculture. In Tomsk Oblast (Yu.A. Golovatskiy, oral communication) the mercury content usually constitutes 0.02-0.5 mg/kg, however at deeper grounds there is a layer with a higher concentration, i.e. 0.2-0.3 mg/kg. In Tyumen Oblast, in the area of intensively used oil and gas fields, the background mercury content in peat soils is within 0.01-0.3 mg/kg, the average values being 0.2-0.25 mg/kg (Dorozhukova et al. 2000). These data correspond to similar data for the above-mentioned Tomsk Oblast and for other regions. the USA – the average figures for peat soil are at 0.28 mg/kg. the summary report of D.S. Adriano indicates that Hg concentrations in peat soils of the world vary within 0.06-0.3 mg/kg (cited from the work of Dorozhukova et al. 2000). There are registered processes of mercury binding by organic substance from soils that are typical of peat bogs; the latter have a higher capacity to accumulate mercury even in natural conditions. By taking the average Hg content in peat soil as 0.2 mg/kg, the total amount of mercury released during use of peat as fuel in Russia can be estimated at 92 kg in 2001. 4.3 Cement and limeThe mercury content in clay rocks (beyond the border of deep faults and ore fields, where litho-chemical areoles of mercury are visible) that are used as raw material for production of cement and lime is rather constant. Thus, for Russian platform (age - D2-K2), they are estimated on the average as follows: for limestone at 0.031 mg/kg (by 131 samples), for clay rocks at 0.035 mg/kg (58 samples), for sand and siltstone at 0.039 mg/kg (45 samples); Hg content in all these samples are close, irrespective of the conditions of the sedimentary rocks formation. Special survey conducted in quarries in Russian platform (age - D3-K2), where limestone is extracted, showed that the average mercury content in 19 combined samples including 3,117 individual samples, made 0.037 mg/kg (Ozerova, Adinyan, 1966). This figure is below the average mercury concentration of the earth crust, i.e 0.045 mg/kg. V.Z. Fursov (1977) gives a higher figure of the average mercury content in limestone, about 0.052 mg/kg, with the variation from 0.024 to 0.102 mg/kg (106 samples); this is due to the fact that testing was organized in different USSR regions, including ore provinces and deep fault areas. We take for calculations the average mercury concentration in the blends at 0.035 mg/kg with the following comments. Sometimes sand, siltstone and clay rocks with an admixture of volcanic materials (effusion-deposition type of lithogenesis) are added to the initial raw material blend. In this case the mercury content in the blend is somewhat higher, since the mercury concentration in the mentioned rocks is higher, on the average, than in rocks of deposition lithogenesis, making about 0.085 mg/kg in clay rocks and 0.097 mg/kg sand and siltstone. In this case we take the mercury content in the blend at 0.05 mg/kg and then we should include certain comments in the final figures. The main process that results in release of mercury during production of cement and lime is thermal – mercury is sublimed and released (emitted) with outgoing gases. In the work (Fursov, 1977) it was shown that in conditions of experiment – during continuous heating of sample of limestone and clay rocks from the room temperature to 800° C – practically all mercury is released at temperatures about 300 C. The process of roasting of raw cement mass, i.e. limestone and clay rocks goes on at high temperatures in the caking area: 1,450°C (in the blend) and about 2000 °C (in the gas stream). Therefore, we can assume that in such processes practically all mercury is emitted with flue gases. It should be noted that during production of cement, when it is necessary to get a mixture with the required chemical composition, they use adjusting additives, usually not exceeding 0.09 tonnes per tonne of clinker (semi-finished cement). They include gypsum, iron ore, bauxite, quartz sand, tuf, diatomite, gaize, nepheline with rather low mercury content, i.e. close to or higher than the percentage abundance (Saukov et al., 1971; Ozerova 1986) as well as fuel ash and pyrite cinders. According to the publications (Kakareka et al., 2000; Yanin 2003), the mercury content in pyrite cinders used for production of cement at enterprises in Belarus and in the town of Novorossiysk are increased and equal to 0.116-0.121 mg/kg and 0.19-4.0 mg/kg, respectively. This allowed the authors of the research to assume that adding of pyrite cinders substantially increases the mercury concentration in dust and gas emissions. We can presume that some small amount of mercury is supplied to the area of the roasting oven together with fuel and then is released to atmosphere. This oven has a form of a tilted cylinder; blend charge is loaded into its top end, while from the bottom a counter flow of hot gases is fed, which is generated as a result of combustion of fuel in the oven bottom end. There are two methods for production of cement: humid and dry, differing in the humidity of the initial blend from 32-45 % to 1-2 % respectively. the humid method requires a higher fuel use, i.e. coal or gas, to produce clinker, and, hence, a higher amount of mercury is fed from the fuel (as compared to the dry method) to the oven. The use of coal is connected with a much higher input of mercury to the oven and, therefore, in the releases as compared to gas (Table 4.31). Table 4.31 Calculations of the mercury amount fed to the oven with fuel
* See the section "Mercury in Gases"; ** (Saukov et al. 1972); in the mercury provinces the concentration of mercury in coals may increase to hundreds of a percent at the expense of development of mercury areoles; the example is the province of Greater Donbass (Ozerova, 1962; Karasik, Dvornikov, 1968). Taking all the above, we assume that all mercury, during roasting of limestone and clay rocks, is released with the gaseous phase. Respective figures for cement production and the estimation of the mobilised mercury are given in Table 4.32. Emission of mercury are calculated on the basis of the average mercury content in the initial raw materials at 0.035 mg/kg and the volumes of the initial mixture with due account that 1.6 tonnes of the mixture is required per tonne of cement. The total cement production in 2001 in Russia was 35 million t. Table 4.32 Amounts of mercury released from the blend during production of cement in 2001
The total mercury amount, assumably released with gases and dust from the cement production facilities in 2001, is very optimally estimated at 2 tonnes and assuming volcanic-sedimentary materials are introduced into the blend - 2.8 tonnes. The total released amount is consequently estimated at 2.0-2.8 t of which 1.3-2.1 t originates from non-fuel raw materials. The main sources of dust in cement production are clinker roasting ovens and mills; the share of the roasting ovens includes up to 85% of all emissions from the cement enterprises (Kolbasov et al., 1987; Varum, Izyumskaya, 1990). Dust from roasting ovens usually is polydispersion, with a high content of particles over 10 μm; therefore, it is a good absorbent of heavy metals. When cleaning systems are available, a part of the mercury is deposited on filters. In Russia, the cement enterprises use cyclones, hose filters, electrostatic filters (ESP) with the dust catching efficacy of 80-99%; in most cases the factor of use of oven electrical filters at cement enterprises makes 80-84% (Chelnokov, Plyshevskiy, 1998, 2000). For cleaning of off-gases from the rotary ovens, electrostatic filters are most commonly used (about 74% of the entire cleaning equipment), although only about one-third of this amount is related to high efficacy equipment. At present, there is a need to modernize dust and gas cleaning equipment practically at all cement manufacturing enterprises of Russia (Paionke, Mersmann, 2002).Dust and gas emissions contain up to 90-95% of the mercury engaged in the technological processes. No data on the actual mercury catching efficiency of the filters applied in Russian have been identified. Contrary to other heavy metals, mercury is in general only partly captured by the filters. It is in general very difficult to obtain an overview of the typical efficacy of different dust control measures for cement plants. A recent review of mercury speciation in cement plants refers only scattered information of mass balances of mercury in cement kilns (Johansen, Hawkins 2003). The amount of mercury deposited on filters will among other factors depend on the speciation of the mercury and the temperature above the filter. For a first estimate data from coal power plants can be applied. The degree to which gaseous mercury adsorbs on the filter cake typically depends on the speciation of gaseous mercury in the flue gas; in general, gaseous Hg2+ is easier to adsorb than gaseous Hg0 (US EPA 2001). Units that burn subbituminous coal or lignite typically have relatively low concentrations of Hg2+ and high concentrations of Hg0 at the inlet to the control device compared to units that burn bituminous coal. Consequently the average mercury capture by ESP or bag filters in plants burning sub-bituminous coal is lower. The average percentage that is captured by cold-side ESP is only 3%, whereas hot-side ESP and fabric filter capture 6% and 72%, respectively. No data on speciation of mercury in gas from cement kilns have been identified. Considering the low efficiency of ESP when concentration of Hg0 is high and the fact that only about one-third of the ESPs is related to high efficacy equipment the mercury capture efficiency may quite well only be 10-30%. Assuming that 80% of the mercury in the raw materials are emitted to the air, the total air emission form cement kilns is estimated at 1.6 t/year corresponding to an emission factor of 0.045 g/t cement produced. For comparison, average emission factors for cement kilns in the USA and Germany are 0.065 and 0.025 g/t cement, respectively (US EPA, 1997; European Communities. 2001.) The calculated average mercury content of the commercial cement calculated based on data (Emissions..1998; Plyshevsky and Chelnokov 2000; Chesnokov, Plyshevsky, 1998) is estimated at 0.043 mg/kg. The value is slightly lower than the average value of 0.07 mg/kg in 416 samples reported from German cement plants (VDC 2000). Mercury content of the final cement product will to some extent depend of the mercury content of other raw materials that are mixed with the clinker after the burning process. Further improvement of the environmental situation in Russia, in regions where cement manufacturers are located, first of all is connected with modernizing the dust catching systems, including heavy metals and mercury, and update of the respective equipment. The international association of cement and cement-based products producers (MGA cement) has developed, together with the CJSC "Concern Cement" a programme for development of the Russian cement sector for 2001-2005. Special attention is paid to reconstruction of electrical filters to reduce dust release to maximum allowed levels. As regards lime, no estimates have been carried out in lack of information about relevant enterprises and lime production volumes. Based on the inventory experience of other countries, it could be assumed that Hg emission at lime production would be considerably lower compared to cement production. 4.4 Non-ferrous MetallurgyMercury present as natural trace element of non-ferrous ores is mobilised by the extraction of the ores and may be released to the environment of by the processing of raw materials and concentrates at metal production enterprises. The location of the nonferrous metal production enterprises in the Russian Federation is indicated in Figure 4.7. Production of zinc, copper, nickel and lead is the most important (Table 4.33) and the most important besides gold from the point of view of potential mercury emission in 2001 in Russia. Figure 4.7 Location of nonferrous metal production enterprises in the Russian Federation A – antimony, C – copper, L – lead, M - molybdenum, N -nickel, Z – zinc, T – tungsten Click here to see the figure.Table 4.33 Production of non-ferrous metals in Russia in 2001*
* Production of bismuth, tungsten (wolfram) and other rare metals was few dozen t in most cases or few hundred t in rare cases. Source: Analysis of financial ... BIKI, 2002; BIKI 2003; Gerasimchuk and others; Annual Report of Mining and Metallurgical Company (MMC) Norilsk Nickel ...; Kovalishina; Global Mineral Resources as of 01.01.2001 ..., 2002; Polkin, Ponomariova ...; Cherniakova ... The largest non-ferrous industry enterprises belong to the organization of MMC Norilsk Nickel OJSC. MMC Norilsk Nickel generates about 65-70 % of all atmospheric emissions and up to 30-33 % of wastewater discharge from all Russian non-ferrous industry enterprises (including aluminium sector). The trans-polar Subdivision of MMC Norilsk Nickel generates a major part of the said emissions and discharges. For example, in 1998 entire Russian industry generated 18,661,000 t of atmospheric emissions of hazardous substances; within this amount, non-ferrous industry enterprises generated 3,292,000 t; within this, MMC Norilsk Nickel generated 2,436,000 t (within this amount, Zapolyarny Subdivision of MMC Norilsk Nickel generated 2,140,000 t). Typical atmospheric emission of hazardous substances from any other Russian non-ferrous metallurgical works was about few dozen thousand t. 4.4.1 Mercury in Non-Ferrous Metal Ores and ConcentratesMercury is characterised by wide metallogenic connections. In the ore formation process, mercury is an element that accompanies mineral formation process in a wide range of temperatures and physical and chemical conditions. (Ozerova, 1962, 1986; Rogovoi, 1989; Fedorchuk, 1983; Fedorchuk, Mintser, 1990). A large complex of deposits is known, where mercury is represented in the proper mineral form (for example, copper and silver deposits), or is a part of complex minerals (platinoid type deposits), or exists in the interspersed condition (copper pyrite, copper nickel, iron pyrite, complex ore deposits, etc.). Very high content of mercury is characteristic for ores from some stratimorphic deposits. Minor scale aggregations of mercury in cupriferous sandstone are known (from a few tenths to a few mg/kg). Higher concentrations of mercury are characteristic for some iron, manganese and aluminium (alunite and bauxite) ores. Sulphide deposits are distinct with considerable scale of mercury yield, where sulphide zinc ores are most rich mercury (up to 10 - 100 mg/kg) (Fedorchuk, 1983). According to N.A.Ozerova (1986), the overall quantity of mercury contained in pyrite deposits in Ural corresponds to a medium to large size commercial mercury deposit by its scale. Estimated average content of mercury in pyrite deposit ores is 1 mg/kg (Ozerova, 1962); estimated average content of mercury in complex ores is 1.1 mg/kg (Korolev, Bobrova, 1963). However, its level in commercial ore types has high variations (Table 4.34 and Table 4.35). As a rule, the maximum concentration of mercury is characteristic for copper-and-zinc varieties, while the minimum concentration is characteristic for iron pyrite ores. Sphalerite-chalcopyrite-pyrite ores from volcanogenic objects are characterised by especially high concentration of mercury. All copper pyrite deposits in South Ural (Uchalinskoe deposit, Uzelginskoe deposit, Sibaiskoe deposit, Buribaiskoe deposit, Ubileinoe deposit, Gaiskoe deposit etc.) belong to this group. For example, mercury concentration varies from some hundredth mg/kg to 800 mg/kg in ore from Uzelginskoe field, from 2 to 560 mg/kg in ore from Uchalinskoe field, and from 1 to 88 mg/kg in ore from Novouchalinskoe deposit; all these ores being processed at Uchalinsky Mining and Concentration Combined enterprise (MCC). (Mineral Resources of Uchalinskoe ..., 1994). Table 4.34 Mercury in ores and minerals in lead-zinc and copper deposits, mg/kg (Bobrova et al., 1990)
* Here and hereinafter the mercury was not detected. Table 4.35 Mercury in ores of sulfur deposits (Ozerova, 1962, 1986)
Average content of mercury in sulphide copper-and-nickel ores is 1 mg/kg (Fedorchuk, 1983), though, for example, its concentration is as high as 9 mg/kg in ore from Monchegorskoe copper-and-nickel deposit (Ozerova, 1962). Content of mercury in ores form copper pyrite complex deposits is 5 to 10 mg/kg; content of mercury in barite and fluorite ores is 1 to 10 mg/kg (Fedorchuk, 1983). Exceeding concentration of mercury are also present in ore from other deposits (Table 4.36). Table 4.36 Mercury content in ores from various deposits (Fursov, 1983)
The main mass of mercury exists in the ore in the sulphide form as finely dispersed admixture in ore-forming minerals. Sphalerite is the main concentrator and media for mercury (Ozerova, 1986). Fahlore, galenite, bornite, chalcopyrite, and pyrite are concentrators of mercury too. For example, 80-90 % of mercury is connected with sphalerite, 10 % of mercury is connected with chalcopyrite, 5 % is connected with galenite, 3 % is connected with pyrite in ores from pyrite and complex ore deposits; about 70% of mercury is connected with pyrite and up to 7 % of mercury is connected with chalcopyrite in ores from copper pyrite deposits in South Ural. (Bobrova et al., 1990). Accumulation of mercury is observed in the areas of oxidizing of pyrite deposits (up to 80 mg/kg), sometimes mercury is found in metallic form in such areas (Kutliakhmetov, 2002). Behaviour of mercury in the course of concentration of non-ferrous metal ore Breaking and milling of ore and subsequent collective-and-selective or selective flotation and obtaining of various concentrates are the main techniques used in the concentration works. In general, content of mercury in concentrate is very uneven, and it generally increases by one order of magnitude as compared to ore in zinc concentrate and (somewhat less) in lead concentrate, making several dozen mg/kg on average. Concentration of mercury in the copper concentrate (for copper pyrite ores) increases by 2- 2.5 times, however this is not observed in a number of cases (Table 4.37). Table 4.37 Mercury content of industrial concentrates, g/t (Bobrova et al., 1990; Ozerova, 1986)
* Iron concentrate; ** Platinum concentrate; *** Antimony concentrate; In the process of concentration of lead-zinc and pyrite-complex ore, main quantity of mercury (up to 70 - 80 %) in extracted into zinc concentrate. To large extent, this is explained by connection of mercury with sphalerite and other minerals containing zinc (Table 4.38). Table 4.38 Distribution of mercury (in percent of overall content in ore) to products of concentration of ore from lead-zinc and copper deposits, average value (range of individual samples) (Bobrova et al., 1990)
* Into iron concentrate. In the course of concentration of copper pyrite ore, pyrite concentrate makes the main mass of product. Its output is measured in the range of 25 - 70 % (and up to 80 % for solid ore). Therefore, it is pyrite concentrate where a considerable part of mercury (up to 40-60% of content in the ore) is lumped despite low content of mercury (usually a few mg/kg, most often within 0.75 to 3 mg/kg). Pyrite concentrates produced in the course of concentration of non-ferrous metal ore are used as feed for production of sulphuric acid in chemical sector plants; in so doing, only selenium is produced from sulphuric acid sludge as by-product. Besides, some part of pyrite waste is processed it copper and lead-and-zinc combined works. Considerable quantities of pyrite concentrates containing mercury have been accumulated by now in vicinity of many Russian ore concentration works. For example, 1 million t of pyrite concentrates are piled in the area of Uchalinsky MCC, and 1.5 million t are piled in the vicinity of Bashkirsky Copper and Sulphur Combined enterprise (Magadeev et al., 1997). Usually temperature in the cycle of ore processing in the ore concentration plant is not high (below 100 °C), that is why mercury virtually never goes to the atmosphere. For instance, this is confirmed by results of gas and mercury observation at the industrial site of Uchalinsky MCC (Kutliakhmetov, 2002). Major part of mercury that is extracted along with pyrite ore, goes into concentrate and moves to processing together with it; only small quantity (less that 2 -7 % of overall mass in ore) goes to concentration waste which is piled in the reject material storage areas (see Table 4.39). As it is mentioned above, mercury is more intentsively joins pyrite concentrate (prevails by mass) and zinc concentrate (has higher metal content). Mercury content in tails may also be rather high (up to 1-9 g/t). In the area of Uchalinsky MCC, weight of piled reject material from the concentration works reaches 28 million t; weight of reject material piled in the vicinity of the concentration works of Bashkirsky Copper and Sulphur Combined enterprise is 480 million t; (Magadeev et al., 1997); weight of piled reject material in the area of the concentration works belonging to Buribaiskoe Mining Administration is 6 million t; and, obviously, it contains several hundred t of mercury. Table 4.39 Distribution of mercury in ore concentration products at Uchalinsky MCC (Kutliakhmetov, 2002)
* The concentration works of Uchalinsky MCC processes over 2 million t of copper pyrite ore per year. Foreign data (Klimenko, Kiazimov, 1987) also show that mercury gets concentrated and accumulates chiefly in zinc concentrate (Table 4.40). Versus the concentration plant of Gaisky MCC, the considerable rate of going into waste (up to 27 % of total quantity in ore) is noticeable; which is probably specific to the employed technology. Table 4.40 Content of mercury in concentration products of Brunswik Works (Canada) (Klimenko, Kiazimov, 1987)
According to available overall estimates (Bobrova et al., 1990), distribution of potential total mercury resources in main industrial concentrates from lead-and-zinc and copper deposits (percent) is as follows: zinc concentrate –42; pyrite concentrate 26; copper concentrate – 19; lead concentrate 13. In turn, considerable quantities of mercury are supplied to national zinc (lead-and-zinc) and copper works together with concentrates of main metals; of which 65 % are connected with zinc concentrates, 20 % are connected with copper concentrates and rich ores, 15 % are connected with lead concentrates. Presence of considerable quantities of waste material containing some quantities of mercury in the area of concentration works predetermines potential engagement of mercury in migration chains in the course of deterioration of waste piles due to hypergenic processes. In addition to that, mercury is released to the environment directly in the course of ore mining. For instance, mercury concentrations were 20 and 13 microgram/l in mine water of Sibaiskoe and Oktyabrskoe fields, accordingly (Mustafin et al., 1998); and mercury concentration in Buribaisky quarry water was 28.3 microgram/l, while the water was used for circulating water supply and discharged periodically into river Tanalyk (Zainullin, Galimova, 1998), this was many times higher than the typical background level of this metal in natural water. Influx of pollutants to surface water streams is also connected with wastewater leaking through dams and leaching products leaking from reject material storage areas. Degasification of mercury from waste piles generated by non-ferrous metal ore mining and concentration during warm season is also possible. 4.4.2 Primary Production of ZincPrimary production of zinc includes the following processes: concentration of zinc ore, oxidization (blend roasting) of zinc concentrate, production of zinc (by means of electrochemical or thermal process), refining of zinc. Production of primary zinc is usually accompanied by production of sulphuric acid using standard processes. Russian producers of zinc In 2001 mainly two enterprises produced zinc in Russia: Chelyabinsk Zinc Works (town Chelyabinsk) and Electrozinc JSC (town Vladikavkaz). The third producer, Belovsky Zinc Works, produces mainly zinc powder (Table 4.41). Several works belonging to Uralskaya Mining and Metallurgical Company and MMC Dalpolymetall JSC also produced some small quantities of zinc (Kovalishina...). However in 2001 their total production was few dozen tonne of zinc. For example, in the 1st quarter of 2002 MMC Dalpolymetall JSC produced 8.2 t of zinc (http://www.aviaport.ru/news/Markets/a1020229200.ht...). Thus, works in Chelyabinsk and Vladikavkaz were main sources of mercury emission to the environment in 2001. Table 4.41 Production of zinc by Russian works, th.. t
* Operates under a tolling scheme (up to 85 - 90 % of produced metal; for example, it supplied just over 2 ,000 t of zinc to the internal market); ** zinc powder. Source: Gerasimchuk et al.; Metallurgist, 2002, # 4; Polkin...; Polkin, Anisimov, 2002; Polkin, Ponomareva...; Russian zinc market...; http://www.aviaport.ru/news/...; http:www.metalinform.com/...; http://www.zinc.ru/news.php3 Chelyabinsk Zinc Works (CZW) was established in 1935. It is located within town Chelyabinsk (dimension of the sanitary control area is about 1000 m). Besides metallic zinc it produces zinc-aluminium alloys, foundry zinc alloy ingots, cadmium, metallic indium, technical grade zinc sulphate, zinc oxide, technical grade sulphuric acid. A process for production of indium powder with particle size from 1 to 5 micrometer was implemented in the works in 2001 (http://metal.klimenko.ru/catalog/Detailed/21.html). There is some information that Chelyabinsk Zinc Works have managed to `completely resolve the issue of mercury-and-selenium sludge' that is reportedly brought to Kyrgyzstan for processing, and recently `the enterprise got close to resolving the issue of utilisation of mercury from gases' (Stepanov...). In particular, in order to reduce content of mercury in acid, the enterprise planned to purchase a plant for utilisation of mercury from gases from Boliden Company. This would permit complete elimination of mercury emissions and considerable decrease of sulphur oxide emission. In 2001 wastewater from the works were discharged to Miass River; and fresh water was taken from the same river. Besides zinc, Electrozinc JSC (Vladikavkaz) produces lead, cadmium, sulphuric acid, copper sulphate, steel structures. Its share in total emission from stationary sources in the Republic of Severnaya Osetia - Alania is about 70 %. Over 3.2 million t of solid waste was placed in the territory of the works by 1999; it contained several dozens t of mercury (Satsaev, 2002). In 2001 Belovsky Zinc Works JSC completed reconstruction of a zinc powder plant and commenced production of commercial products. Raw materials and mercury content in zinc concentrates Zinc is mainly produced from polymetallic sulphide ores containing also compounds of lead, copper, cadmium and other metals. Polymetallic sulphide zinc ores could be divided into lead-and-zinc, copper-and-zinc and lead-copper-zinc ore. Deposits in the Caucasus, Salairskoe and Sikhote-Alin deposits belong to the lead-and-zinc type. Copper-and-zinc ores mainly come from Ural deposits. Major part of Altai ore is of lead-copper-zinc type. Lead-zinc and copper-lead-zinc ores are also raw materials for commercial production of lead. Cadmium is extracted mainly as by-product along with zinc. In addition to that, copper-zinc pyrite ores and zinc pyrite ores are important for production of zinc. These are available in varieties in zinc-and-copper pyrite deposits, and they are quite common in lead-and-copper deposits. There are pyrite polymetallic ores consisting predominantly of pyrite and pirrhotine, and polymetallic ores, in which content of pyrite and pirrhotine does not exceed 2- 4 % (Gorzhevsky et al., 1997). Typical content of zinc in the ores being processed is 1-3 % on average. As mentioned above, due to low content of metals, first sulphide ore undergoes concentration process in order to extract concentrate. The concentration process (the enterprises use fragmentation, initial concentration and floatation) produces zinc and other concentrates depending on composition of raw ore. For example, in the course of concentration of pyrite-and-polymetallic ore the enterprises produce four concentrates: lead, zinc, copper and pyrite concentrate. Domestic zinc concentrates usually contain the following (percent): zinc 45-51; lead 0.2-2.5; cadmium 0.1-0.25; iron 3-12; sulphur 30-38, gangue up to 10 (Gudima, Shein, 1975; Denisov, 1991; Basics of metallurgy..., 1962; Utkin, 1990). In 2001 Chelyabinsk Zinc Works was oriented mainly to supplies of raw material from deposits in Ural region, which give more than 75% of total output of Russian zinc concentrates. These supplies, from Uchalinsky, Gaisky and Sibaisky mining and concentration combines, provide about 95% of the works' demand of zinc concentrate. In 2001 MCC Uchaslinsky JSC was a main supplier of zinc concentrate for Chelyabinsk Zinc Works (providing up to one half of the overall quantity). Recently Chelyabinsk Zinc Works purchased up to 20,000 t of concentrate (having zinc content 55-60 %) abroad every year. In 2001 Chelyabinsk Zinc Works processed about 330,000 t of zinc concentrate. Electrozinc Works in Vladikavkaz was processing zinc concentrates coming, as one can guess, mainly from Kazakhstan, China and Poland. Insignificant quantity of concentrate was supplied from Sadonsky lead-and-zinc works. In 2001 the works processed about 190,000 t of zinc concentrate. Belovsky zinc works, presumably, received zinc concentrate from Ural and Sibertian (Altai) deposits. In 2001 weight of processed concentrate was 6,300 t. Zinc concentrates, especially those produced by Ural concentration works that process ore from local copper-and-pyrite deposits, are characterised by high content of mercury (Table 4.42, Table 4.43, Table 4.44). According to A.N. Kutliakhmetov (2002), mercury content in zinc concentrate produced by Uchalinsky MCC is 76 to 123 mg/kg. Table 4.42 Composition of zinc concentrates (data of institute Gintsvetmet)
Table 4.43 Mercury in zinc concentrates from pyrite and pyrite-and-polymetallic deposits (Ozerova, 1986)
It seems that average content of mercury shown in Table 4.44 sufficiently correctly reflects mercury level in concentrates processed by Chelyabinsk Zinc Works in 2001. Similar content may be assumed for Belovsky works. There is no direct information on content of mercury in concentrates supplied for processing to Electrozinc JSC. However it is known that lead-and-zinc ores of Kazakhstan and zinc concentrates made of Kazakh ore usually have very high content of mercury (Bobrova et al., 1990). Table 4.44 Mercury in zinc concentrates from Ural concentration works (Mustafin, 1998)
* Main suppliers of zinc concentrates to Chelyabinsk Zinc Works. Thus, in 2001 about 20 t of mercury was supplied with concentrates to Chelyabinsk Zinc Works for zinc production, 11 t of mercury was supplied to Electrozinc JSC, and 0.3 t of mercury was supplied to Belovsky Zinc Works. Processes and technologies Hydrometallurgical (electrolytic) and pyrometallurgical (distillation) process systems are used for processing of zinc concentrates. The hydrometallurgical process is the main one (works in Chelyabinsk and Vladikavkaz); the thermal process is used in Belovsky works. Roasting of sulphide concentrates in order to convert sulphide compounds into oxidized compounds is the first operation in any process of zinc production from sulphide concentrates. In the pyrometallurgical process, first the enterprises usually subject the initially dried concentrates (drying of the concentrates is done in drum-type kilns at the temperature of incoming furnace gases, 700 - 800 °C) to incomplete oxidizing roasting process in multiple-bedded furnaces. This process produces powder. Then the powder is sintered in agglomeration machines (at temperature 1,200°C). In the course of roasting, the purpose is to receive frying gases with high content of SO2 usable for production of sulphuric acid and to catch evaporated useful metals. Ready agglomerate contains 0.5 - 0.8 % of sulphur. Physically it is roughly coked mass of porous material. It is subjected to fragmentation and screening prior to going into distillation process. Then zinc oxide is deoxidised in retorts at temperatures above the boiling point of metallic zinc (above 906 °C). This results in zinc sublimation as vapours which go into a condenser, where zinc is collected in liquid form. The zinc vapour is condensed, then the received crude zinc goes into refining process. Frying of zinc concentrate prior to hydrometallurgical processing is done in fluid-bed furnaces (the temperature of the flying bed is maintained at 900-950 °C, the temperature of gas under the furnace roof is 800-850 °C). The fried product (cinder) contains about 55-65 % of zinc. Compounds of copper, lead, iron, cadmium, arsenic, antimony, cobalt, noble and rate metals are also present in the cinder; content of sulphide sulphur is less than 1 %. The cinder is unloaded over the sill block by gravity flow and is transported to the classification section. Dust is collected in cyclones; periodically they unload it and add to the cinder. Along with cinder and dust from cyclones they use dust from gas ducts of electric filters. All these products are processed together. According to data from works Electrozinc, which may be regarded as typical data, output of frying products (percent) is as follows: cinder – 65, dust from cyclones – 30, dust from gas ducts – 1.1, dust from electric filters – 3.3, ventilation dust 0.6 (Gudima, Shein, 1975). In Chelyabinsk Zinc Works they sometimes add materials containing calcium oxide (sludge from treatment facilities) to the batch of concentrates being fried. This allows for processing of off-grade concentrates with high content of silicon (Tarasov, 2001). Then zinc is leached from cinder using water solution of sulphuric acid. The enterprise carry out leaching in order to completely transfer zinc and some components accompanying zinc into solution. Usually the enterprise manage to transfer about 90% of zinc into the solution (assuming that zinc in cinder is 100%). Prior to electrolysis the enterprise remove admixtures from the solution. Then the solution is fed into electrolysis baths. In the course of electrolysis zinc is plated on the cathode, while oxygen is released on the anode. In so doing, sulphuric acid is generated in the solution, which is necessary for leaching of fresh portions of cinder. Cathode zinc deposits (cathode zinc) are melted in induction furnaces, and obtained zinc is cast into ingots using special machines. Sources and characteristic of dust and gas generation Flying-bed frying furnaces are main sources of dust and gas emissions at zinc works; flying bed furnace gases are characterised by high temperatures (up to 950 °C), considerable dust content (up to 300 g/m3) and domination of small dust fractions (2.5 - 4.5 micrometer). Quantity of flue (frying) gases varies within the range of 1.3 to 3.1 thousand m3 per tonne of concentrate. After cleaning flue gas goes into sulphuric acid production process. The flue gas cleaning system is comprised of cyclones (rough cleaning) and dry electric filters (fine cleaning). In addition to that, the gas is treated in washer towers and wet electric filters immediately in the sulphuric acid production section. According to (Emission of heavy metals..., 1998), in mid 1990-ties there were the following specific rates of dust emission in the course of production of zinc in CIS works: with cleaning efficiency 95 % – 57.2 kg kg/t of crude zinc; with cleaning efficiency 98 % – 17.2 kg/t; with cleaning efficiency 98 % – 2.29 kg/t of crude zinc. According to (Denisov, 1991), cleaning efficiency of frying gas cleaning in enterprises if former USSR varied from 81.6 to 99.6 %. Average efficiency of the cleaning equipment was estimated as 98.5 % (Savrayev, 1990). There are all grounds to assume that the latter figure corresponds to the level of 2001. Emission and distribution of mercury in the course of zinc production Behaviour of mercury in the primary production of zinc has been studies very little, therefore there are no reliable actual data regarding specifics of mercury distribution in main products, waste and regarding emission to the environment. It is known that about 35-40 t per year were supplied to Chelyabinsk Zinc Works together with zinc concentrates in 1988-1990 (Report on Research under title `Analysis of Condition of Mercury ...', 1999). According to (Kamenev, Fadeeva, 1983), levels of mercury in zinc concentrates processed during 1970 - beginning of 80-ies reached 200 mg/kg. Authors of the cited publications believed that mercury was sublimated and went into sulphuric acid production process during frying of concentrates. As the technology of flue gas cleaning used in the gas washing section of sulphuric acid production section of Chelyabinsk Zinc Works did not ensure complete entrapment of mercury, a considerable quantity of mercury was going into produced sulphuric acid. According to (Report on research work under title `Analysis of condition of mercury ...', 1999), about 10-12 t per year of mercury precipitated in the form of mercury-selenium sludge in the gas washing section, while other 25-30 t of mercury went into sulphuric acid. Annual sludge generation reached 30-35 t at the time. Table 4.45 shows data of Ginstvetmet Institute that characterise quantities of mercury containing sludge generation in Russian zinc enterprises in 1985 - 2000. Table 4.45 Quantities of mercury-selenetic sludge at non-ferrous metal works of Russia , tonnes
* Until 1985, mercury and selenium sludge was supplied from Chelyabinsk Zinc Works to Ust-Kamenogorsk lead-and-zinc combined enterprise for processing; also there was a production of by-product mercury from the said sludge in Chelyabinsk Zinc Works during an insignificant period. The research conducted at the time in Chelyabinsk Zinc Works (Kamenev, Fadeeva, 1983), have shown that mercury transferred to the sulphuric acid production process distributed as follows (it was assumed that content of mercury in frying gas equalled 100%): washing acid – 16.7%; sludge – 43.3%; product sulphuric acid – 36.6%; flue gases – 0.4%. Thus, 60% of mercury brought in together with gases was arrested in the washing section of the sulphuric acid production section and was removed with washing acid and sludge. The remaining mercury went into drying and absorption section and contaminated product sulphuric acid. The authors of the cited publication had studied the balance of distribution of forms of existence (conditions) of mercury in various products (Table 4.46). Table 4.46 Balance of distribution of forms of existence (conditions) of mercury in various products of sulphuric acid production at Chelyabinsk Zinc Works, % (Kamenev, Fadeeva, 1983)
* Mercury halides. In publication (Bobrova et al., 1990) there is a diagram of distribution of mercury in process products generated in the course zinc production (Figure 4.8). The diagram is based on data of (Kamenev, Fadeeva, 1983) and on authors' own estimates. In the course of frying of zinc concentrates, 94 % of mercury contained in the concentrate sublimates and goes into frying gases in the form of metal vapours. The gases (having content of SO2 > 3.5 %) pass the dust arresting system (where up to 32 % of mercury is removed with dust) and then go into sulphuric acid shops in order to produce sulphuric acid using the standard contact technique processes. Sulphuric gases get condensed in special washer towers in the washing section of the sulphuric acid shop. The condensate goes to electric filters, from there the filtered condensate goes into the sulphuric acid production process, while sludge enriched with selenium and mercury is transferred to a special plant. There sludge is processed to the commercial condition using floatation technique. Content of mercury in lean sludge in settling tanks of the washer towers is 5-18%. Content of mercury in rich sludge of wet filters is 10-40%. An average Hg extraction from concentrates to sludge is usually 27% (from mercury content in concentrates). A considerable quantity of mercury goes into commercial sulphuric acid and is arrested by washing acid. It is necessary to note that the level of utilization of both mercury and mercury-selenium sludge was extremely low in Russian zinc works (Bobrova et al., 1990). For example, rate of mercury extraction from zinc concentrates up to 99.5 % was achieved in Finland in late 1990-ties by three-stage cleaning of frying gases using the technology developed by Oytocumpu Oy Company. This yielded over 70 t of commercial metal per year (Butov et al., 1997). Firstly, all above estimates and diagrams of mercury distribution are relative to large extent (usually there are no data on absolute mercury distribution in products of zinc production) and are characterised by some mismatch of mercury balance; secondly, all above estimates and diagrams of mercury distribution are based on the assumption that atmospheric emission of mercury in the course of production of zinc and sulphuric acid either doesn't exist or, at least, is minimal (maximum 0.2% of the quantity of mercury contained in concentrates), which certainly does not match the actual condition. In particular, mercury is capable of going into the environment when unloading the glowing cinder from the furnace, during the periodical removal of dust from the cleaning system, or due to presence of various leakages (non-tight places) in the furnace, gas ducts and treatment facilities, or together with ventilation emission, with aerosols and vapours generated in electrolysis processes, in the course of leaching, or mercury can emit directly in the rooms of sulphuric acid production section (with steam and flue gases). Certain amount of mercury is lost in the course of washing (goes into sewerage) and drying (goes to atmosphere) of mercury-and-selenium sludge. For example, content of mercury in bottom sediments in river Kambileevka, that receives wastewater from Electrozinc Work in Vladikavkaz, is higher than the background values by several hundred times. Intensive technogenic anomalies in river deposits are observed at distance 70 km below the works and are also registered in river Terek, where the River Kambileevka flows in (Yanin, 2002). Concentration of mercury in atmospheric air in the vicinity of Electrozinc Works was higher by several hundred times than the background values (Volokh, 1998). According to (Bobkov et al., 1997), specific emission of mercury to atmosphere in the primary zinc and cadmium production is 42 g of mercury per tonne of the product; the authors of the cited publication estimate emission factor of zinc for the said production as 15,720 g/t. According to (Emission of heavy metals..., 1998), specific emission of zinc for zinc works in CIS, depending on dust arresting efficiency , was 24,596 g/t with dust arresting efficiency 95 %; 7,396 g/t with dust arresting efficiency 98.5 % (this emission treatment level is typical for works in CIS); and 984.7 g/t with dust arresting efficiency 99.8 %. If we assume emission treatment level of 98.5 %, then we can more or less reasonably assume that specific mercury emission for such conditions was approximately 20 g/t. In 1996 Chelyabinsk Zinc Works emitted 2.51 t of mercury to the air (Atmospheric air, waste, radiation ...). With annual production of zinc in the order of 115,000 t, specific emission was 21.8 g/t (which is close to the above value). It is evident that these figures reflect the situation existing in the country's zinc industry at the time rather adequately. For example, it is known that the quantities of zinc concentrate processing were considerably increased due to decrease of quality of supplied zinc concentrates, in the end of 1980-ties. The flying-bed furnaces and the dust arresting systems were operated in boosted mode at the time. Emission cleaning efficiency was low because of use of cleaning equipment beyond the normative service life and increased failure rate of the equipment. The capacity of electric filters was used by 50% on average, because their operation was frequently interrupted by running repairs and overhauls. It was exactly in the mid 1990-ties that stable concentrations of mercury vapours 1.5 to 2 times higher than the maximum allowed concentration (MAC) were observed in some areas of town Chelyabinsk (http://www.chrab.chel.su/archive/17-10-97/1/RE12.D...). Concentration of mercury in the air was 5 times higher than MPC within the industrial zone of Chelyabinsk Zinc Works, and concentration of mercury in the soil around the works was 100 times higher than the background values. It is also known that mercury-and-selenium sludge was dumped in the territory of the works. According to official information (Consolidated report on protection of ...), mercury emission from the non-ferrous metallurgy sector (that means from the zinc works) was as high as 1,229 kg in Chelyabinsk in 2001. With annual zinc production at Chelyabinsk Zinc Works of 1,555,500 ton, specific mercury emission was 7.9 g of mercury per tonne of produced zinc. It seems that the considerable decrease of specific mercury emission in 2001 compared to 1996 was a result of some improvements of technological processed in Chelyabinsk Zinc Works in 2000-2001, and there are some references to this in press (Stepanov...; Tarasov, 2001, 2002). Figure 4.8 Diagram of mercury distribution in processing products of zinc production (Bobrova et al., 1990)
Thus we will assume that specific emission of mercury in the course of primary zinc production in Russian works was 7.9 g for 1 t of metal. The data discussed above allow us to draw up a diagram of relative distribution of mercury in the course of zinc production using electrolysis process and in the accompanying production of sulphuric acid (Figure 4.9). Figure 4.9 Distribution of mercury in the course of zinc production using hydroelectric metallurgy technique
When drawing up this diagram, we took into account specific features of selenium behaviour in technological processes of sulphuric acid production in the course of pyrometallurgical melting of cupreous pyrite. This process is based on frying of pyrite, processing of removed frying gas and production of sulphuric acid using the contact technique. In practice this process is similar to production of sulphuric acid in the zinc works (Amelin, 1983; Sokolov, 2003). Summary Table 4.4 shows the estimated data characterising emission and distribution of mercury in the course of primary zinc production in Russia in 2001. Losses of mercury in the course of technological processed mainly get to washing acid and product acid, mercury-and-selenium sludge, dust from flying-bed frying furnaces and atmospheric emissions. Some part of mercury in latent form in transferred to the lead production section together with lead cake from the oxide leaching shop. (At all appearences, the lead cake is presently stored at the enterprises' territories). Table 4.47 Emission and losses of mercury in the course of primary zinc production in Russian works in 2001
* Was in 2001 deposited, in recent years the attempts to arrange the lead cakes processing have been being made in Chelyabinsk 4.4.3 Production of Primary NickelThis section contains a characteristic of Russian producers of primary nickel and describes raw materials used for production of primary nickel, levels of mercury content in the raw materials, a technological process of nickel production from silica (oxidised) ore, as well as emission of mercury in the course of processing of the ore in Russian works. Specialties of production of nickel (and copper) from sulphide copper-and-nickel ores in works belonging to Mining and Metallurgical Company Norilsk Nickel and corresponding estimate of mercury emission will be described in a special section. We adopted this approach because of a uniform technology used for processing of sulphide copper-and-nickel ore, existing technological links between works belonging to MMC Norilsk Nickel OJSC and its dominating role in production of copper and nickel in Russia. Russian producers of nickel 250,000 t of nickel was produced in Russia in 2001 (see Table 4.48). MMC Norilsk Nickel OJSC (hereinafter Norilsk Nickel) occupies a monopoly-like position in nickel production sector in Russia for many years. Norilsk Nickel is one of leading producers of primary nickel in the world. Main commercial products (related to nickel) of Norilsk Nickel are: metallic nickel (electrolytic), nickel carbonyl powder, and nickel carbonyl pellet. Other Russian producers of nickel, which are concentrated in Ural region, play an insignificant role in the domestic market of this metal. Their products are: primary nickel, ferronickel, nickel hydroxide. In 2001 few other works produced nickel and products containing nickel in small quantities, something like few hundreds t per year; for example, Uralelectromed OJSE (which produced about 900 t of nickel sulphate in 2001), Kyshtymsky Medelectrolitny Zavod CJSE (copper electrolysis works) and other works. Table 4.48 Production of primary nickel by Russian enterprises in 2000 and 2001, th. tonnes
Source: BIKI, 2003, # 41; Gerasimchuk et al. Chernyakova...; http://www.aktex.ru/rus.news...; http://minamp.rbc.ru/ru/cp_on_commodity_marcet/ana...; with addenda It is necessary to note that a part of technological basis of Ural exist since the first half of XX century. Works of MMC Norilsk Nickel in general have more advanced technology and equipment. Mercury content of raw materials Magmatic sulphide copper-and-nickel deposits (Taimir, Kola Peninsula) and hypergenic silicate cobalt-and-nickel deposits in Middle and South Ural (Table 4.49) are main sources of nickel in Russia. Processing of sulphide copper-and-nickel ore produces major part of nickel. Pentlandite, phyrrotine and magnetite are main minerals in copper-and-nickel ores. The ores also contain pyrite, cubanite, talnakhite, platinum group minerals, gold, silver, galenite, sphalerite etc. A considerable part of nickel is related to silicate minerals in the form of isomorphic mixes or fine grain sulphides, which are not extracted in the course of concentration. Major part of cobalt is related to silicates too. Almost all copper in the ore exists in the form of sulphides. Sulphide ores can be divided into disseminated ore, breccia ore, massive ore, aggregated ore, and vein-and-disseminated ore. From the angle of mineral composition, there are phyrrotine ore, cubanite ore, chalcopyrite ore, talnakhite ore, and other types of ore. From the angle of nickel content, there are rich ore and lean ore; lean ore requires primary concentration. The primary concentration produces either combined copper and nickel concentrate or separate nickel concentrate and copper concentrate. Rich ore with nickel content over 1 % and nickel to copper ration at least 161 and low content of iron (less than 25%) goes straight to melting. Ores containing 8 - 20 % of iron, 6 - 12 % of sulphur, 18 -30 % of silica belong to self-melting type; they are processed without adding flux. Average content of nickel in ore is 1.6% (Chernyakova...). Major part of nickel (about 80%) is extracted from rich ore that have average content of metal 2.6-2.9%. Table 4.49 Main industrial types of Russian deposits of nickel (Krivtsov, Klimenko, 1997)
* Estimated average content of nickel 0.9 % (Chernyakova...). Silicate cobalt-and-nickel ores (in metallurgy they call them oxidized ores) related to weathering crusts of ultrabasic massive have very complex mineral composition and fine disperse and amorphic and crystalline distribution of metal, which usually participates in various mineral phases. Residual weathering crusts are formed of hypergenic serpentine, ferrosapolyte, nontronite, hetite-hydrohetite, cobalt-nickel asbolanes, hypergenic magnetite etc. Nickel serpentine and nickel manganese serpentine, cerolite, pimelite and other minerals containing nickel are typical for filtration zones. Nickel berthierite, hypergenic magnetite maghemite, millerite, etc. are well developed in converted weathering crusts. Major part of silicate ore belongs to the lean oxidized ore category. Content of nickel in the ore 0.4-1.7%, content of cobalt in the ore is 0.01-0.2%. Ores where cobalt content is more than 0.085-0.1% belong to cobalt ores by definition. At least 85 % of confirmed nickel resources in the country reside in sulphide copper-and-nickel deposits of Norilsk region (Norilsk-1, Talnakhsk, Oktyabrsk and other deposits). 10 % of Russian nickel resources reside in sulphide deposits in Murmansk Oblast (Zhdanovsk, Zapolyarnoe, Kotselvaara, Semiletka and other deposits). Remaining 5 % are connected with silicate nickel ores in deposits of Middle and Southern Ural, where Buruktalsk, Sakharinsk and Serovsk deposits are largest ones (Table 4.50). Table 4.51 shows data available from literature on content of mercury in ores and concentrates from copper-and-nickel deposits. According to V. P. Fedorchuk's data (Fedorchuk, 1983), average content of mercury in sulphide copper-and-nickel ore is 1 mg/kg. Weathering crusts of ultrabasic massive are the ore-yielding formation with which all silicate nickel deposits are connected. Average content of mercury in ultrabasic rock is estimated as 0.09 mg/kg (Reference Book on Geochemistry, 1990). Let us assume that this concentration is an average level of mercury content in silicate (oxidized) nickel ore. Let us also assume that this value accounts for the probability of mercury emission in production of nickel from fuel, limestone and sulphidizing agents (gypsum, pyrite, kies) as well as from ore, in subsequent calculations. Table 4.50 Main suppliers of raw materials to Russian nickel works in 2001
Table 4.51 Mercury in ores and concentrates from copper-and-nickel deposits (Ozerova, 1986)
* Confidence interval for reliability 0.95. ** Estimated by the author of the present report Specialties of processing of silicate (oxidized) ores Pyrometallurgic techniques are used for extraction of nickel from silica ores in practice. These are melting with sulphidizing and reducing fusion in order to receive primary ferronickel (Gudima, Shein, 1975; Basics of Metallurgy..., 1962). Two techniques are used in order to prepare ore for melting: briquetting (Rezhsky Nickel Works and Ufaleinickel) and agglomeration (Yuzhuralnickel). Often ore is subjected to drying at temperature 700-800 °C in drying drums prior to briquetting. Black oil (mazoot) is used as fuel for drying. Black oil consumption is 1-1.5 % of initial ore mass. The dried ore is mixed into batch with sulphidizing agent, and then the batch is briquetted in roll presses. Agglomeration of oxidized ore is carried out in agglomerating machines. Necessary preparation of ore is carried out prior to agglomeration. This includes screening, milling (reduction) and mixing with recycled agglomerate in order to increase gas permeability of batch. They do not dry out milled (reduced) ore prior to agglomeration. Essence of caking in agglomerating machines is chemical and physical transformations of batch at high temperature (about 1,150 - 1,200 °C) achieved by burning breeze coke. Battery cyclones (having design efficiency 99 %) are used for cleaning of flue gases. Output of good agglomerate is approximately 65-68 % of initial ore quantity. Prepared oxidized nickel ore is mixed with additive containing sulphur (pyrite, gypsum, kies), flux (limestone) and fuel (coke). The mix is melted in pit-type furnaces to produce matte. Walls of the furnaces usually have evaporation-type cooling system. (Generally, there are 5 such furnaces at each soviet works). In recent years the enterprise sometimes added secondary raw materials containing nickel into ore batch. Consumption of sulphidizing agent is 7-9% of the part of batch that contains metal; consumption of limestone is 16-24%, consumption of natural coke is 21-33%. Temperature in the area of tuyeres of the pit-type furnace in focus reaches 1,450 - 1,500 °C, temperature at the throat is 400 - 500 °C. Output of dust carried away with gases is 6 - 18 % of mass of melted batch. It depends on velocity of gases, particle size distribution of batch and other factors. Scrubbers and multiple cyclones having design efficiency 98-99 % are used for cleaning of flue gases. Slag is released continuously from the pit-type furnaces through external crucibles and settlers where matte shots are installed. Slag output is 110-120 % of mass of melted agglomerate or briquettes. Nickel matte is released from the crucible approximately every 2-3 hours. Composition of matte varies within the following ranges: nickel 12-20 %; iron 56-60 %; sulphur 17-23 %; slag impurities up to 4 %; copper and cobalt 0.4-0.6 %. Extraction of nickel to matte is 67-85%, extraction of cobalt to matte is 42-61% (the maximum values are observed when ore is prepared by briquetting). Then nickel matte is processed in order to obtain metal. The process includes conversion of matte (at temperature about 1,300 °C) that produces nickel converter matte, and burning of nickel converter matte, that is carried out in two stages (first in flying bed furnaces at temperature 1,000 - 1,150 °C, then in the tube furnace at temperature 750 - 800 °C). In order to reduce nickel protoxide, produced as a result of double burning, into metal, the enterprises carry out reducing melting in electric furnaces. The enterprises use petroleum coke or pitch coke as reducing agent, and also they use small quantities of limestone. In this case they produce ingot nickel or pellet nickel, or they produce nickel cathodes if further refining of metal is required. Sometimes they use alkali hydrometallurgic process in order to extract nickel and cobalt from ore that passed reducing burning at temperature 580 - 780 °C (Krivtsov, Klimenko, 1997). Then they carry out calcination of carbonate solution cake in tube furnaces to produce nickel protoxide. Figure 4.10 Simplified diagram of processing of silicate (oxidized) nickel ore
Table 4.52 Production of nickel and emission of mercury into the environment when processing silicate (oxidized) ore
4.4.4 Production of CopperProduction of crude copper from ore concentrate is of primary importance from the angle of supplying mercury to the environment; emission of mercury is considerably less when processing waste and secondary materials and when refining crude copper. Usually processing of copper ore and concentrates is accompanied by producing of sulphur (sulphuric acid) from frying (flue) gases. Mercury intensively concentrates in sludge of sulphuric acid production processes in the course of this. A characteristic of Russian manufacturers of primary copper, of raw materials used for its production and of copper production process and mercury emission in works located in Ural region is given below. Evaluation of mercury emission in the course of production of copper from copper-and-nickel ores in MMC Norilsk Nickel OJSE is given in a special section. Russian producers of copper Russian enterprises producing copper are located in Taimir (Kransnoyarsk Krai), in Murmansk Oblast (MMC Norilsk Nickel OJSC) and in Ural region, where major part of them belongs to Holding Uralsk Mining and Metallurgical Company. The exceptions are: Kishtimsky copper electrolysis works (Kishtimsky Medeelectrolitny Zavod CJSE) and Karabashmed CJSE forming the 3rd group of Russian producers of copper (Table 4.53.) Table 4.53 Production of copper in Russia in 2000-2001, th. tonnes *
* Including secondary copper; according to data of Ministry of Economy and Development of RF (http://www.inves.ru/rus_china/4/pril_1.htm), 96.7 % of copper was produced from domestic raw materials, including 23.1% from secondary raw materials (copper scrap, rock refuse and anode recrement of copper smelting production) in 2001. Sources: (Metallurg, 2001, # 1; Mineral Resources of the World ..., 2002 ; Non-ferrous Metallurgy, 2002, # 6; http://www.aviaport.ru/news/Markets/21440.html; http://metal-trade.ru/news/business/2002/12/index...; http://eurocopper.ru/stat%20ussr%20russ.htm; http://metall.klimenko.ru/arc.15-09-2002.html; http://www.aktex.ru/rus/news/?year=2003&month...; http://www.kmez.ru; www.mineral.ru/Chapters/News/6016.html) Mercury in raw materials Currently in Russia major quantity of copper is produced from ores of copper-and-nickel deposits (content of copper in ore 0.2 - 0.5%) copper pyrite deposits (0.5 - 3 % of copper) and copper-zinc-pyrite deposits (1-6 % of copper). (Krivtsov, Klimenko, 1997b). Copper-and-iron deposits containing vanadium and titanium are of secondary importance (0.5% of copper). A characteristic of sulphide copper-and-nickel ores mined in Taimir and Kola Peninsula has been given above. The enterprises produce up to 70% of primary copper from them in Russia. The remaining part comes from copper pyrite and copper-and-zinc-and-pyrite deposits located in Ural region. Ores from copper deposits can be divided into three groups by degree of oxidization: sulphide ore (virtually all Russian primary copper is produced from it), oxidized ore and mixed ore. Main minerals in Ural sulphide ores are chalcopyrite, bornite and chalcocite. Sulphide ores usually contain 1-6% of copper, 8-40% of iron, 9-46% of sulphur, 1-6% zinc, 5-55% silica, 2-12% alumina, 0.3-4% calcium oxide (Voskoboinikov et al., 1979). Generally copper ores are complex and contain a large number of chemical elements, which are extracted in the course of their processing as much as possible. In 2001 in Urals MCC Gaisky produced over 4.2 million copper ore and Safianovskaya Med OJSE produced 960,000 t (average content of copper 2.71 %). (Results of production by Safianovskaya Med OJSE...). Main producers of copper concentrate were Gaisky MCC (440,000 t, average content of copper about 15 %), Uchalinsky OJSE, Karabashmed CJSE (over 134,000 t), Kyshtymski Medeelectrolitny Zavod CJSE (Kyshtymski copper electrolyte works) (over 124,000 t), Sviatogor OJSE (about 180,000 t). Baskirsky Mednoserny Kombinat OJSE (Baskirsky copper and sulphur combined works (21,000 t), Buribaevskoe mining administration (26,000 t), Turinsky mine and Sredneuralsky Medeplavilny Kombinat OJSE (Sredneuralsky copper smelting combined works) (9- 12,000 t each) also produced copper concentrate. (According to some estimates, Baskirsky copper-and-sulphur combined works produced 110,000 t of concentrate (http://www.mediatext.ru/docs/2417).) Structure of raw materials basis of Ural copper works is rather complex; one works usually processes copper concentrates (both domestic and foreign ones), various copper scrape and waste (refuse and anode recrement). An analysis of available information sources allowed us to systematize the structure of raw materials containing copper processed by Ural works as follows (Table 4.54). An estimate of the structure of crude copper production by Ural copper smelting works in 2001 in presented in Table 4.55. Table 4.54 Characteristic of raw materials containing copper processed by Ural works in 2001
Table 4.55 Structure of crude copper production in Ural,1000 t
There is little statistics in domestic literature on content of mercury in Ural copper ores and copper concentrates produced from them. Thus, ranges of determined mercury concentrations are from 0.N to N x 100 mg/kg for ores from copper-and-pyrite deposits. Some authors estimate average content of mercury at few dozens mg/kg (Bobrova et al., 1990). Content of mercury varies from less than 0.5 to 20 mg/kg in ores from III International deposit; content of mercury is 10-900 mg/kg in ores from Sibaiskoe deposit, 1-90 mg/kg in ores from Gaiskoe deposit; 1 - 9 mg/kg in ores from Uchalinskoe deposit, Degtyarskoe deposit and a number of other deposits (Ozerova, 1986). According to (Mineral Resources of Uchalinskoe ..., 1994), concentration of mercury varies in wide range in all industrial sorts of ore and mineral types of ore processed by Uchalinsky MCC: concentration of mercury is from some hundredth mg/kg to 800 gpt in ore from Uzelginskoe deposit, from 2 to 560 mg/kg in ore from Uchalinskoe deposit, from 1 to 88 mg/kg in ore from Novouchalinskoe deposit. Average content of mercury in ores from Uzelginskoe, Uchalinskoe and Novouchalinskoe deposits are usually few dozens mg/kg. According to authors of the cited work, in general all sorts of ore from Uzelginskoe, Uchalinskoe and Novouchalinskoe deposits are high mercury types. In this respect they are second only to ores from Safianovskoe deposit (Middle Ural). High content of mercury in ores from Safianovskoe deposit is confirmed in report 'State Balance of Mineral Resources of the Russian Federation' (Mineral Resources of the World at early 1999 ..., 2000). Actually, known data on mercury content in copper concentrates produced in various concentration works are rather inconsistent (Table 4.56). However it is accepted that content of mercury in copper concentrate usually is higher by 2- 2.5 times (as compared to, for example, mercury content in ores), though such increase of mercury content is not observed in a number of cases (Bobrova et al., 1990). According to (Bobrova et al., 1990), for example, from 19.1 to 24.9 % of all mercury present in ore goes into copper concentrate in the course of concentration of ore from copper-and-pyrite deposits. According to other source (Kutliakhmetov, 2002), from 10 to 14 % of all mercury present in ore goes into copper concentrate in the course of concentration of ore at Uchalinsky MCC, and resulting content of mercury in concentrate is within 28 to 41 mg/kg. In the course of ore concentration at Gaisky MCC in 2001, average output of copper concentrate was 9 %, average output of zinc concentrate was 1.47 %, average output of pyrite concentrate was 45% (Krivtsov, Klimenko, 1997b). In 2001 Gaisky MCC have processed over 4,222,000 t of copper ore and produced 440,000 t of copper concentrate; i.e. output of copper concentrate was approximately 10.5 %. Hence, at least there is no depletion of mercury content in ore concentrate as compared to mercury content in initial ore. It is noteworthy that Ural copper concentrates usually have high content of zinc. This is an indirect indication that these ores have high content of mercury in them. Table 4.56 Content of mercury in copper concentrates (Bobrova et al., 1990; Ozerova, 1986)
At the same time there are some data showing that, on one hand, mercury virtually does not concentrate in copper concentrate nor even in zinc concentrate produced by concentrating ores from many pyrite and copper-and-pyrite deposits (Table 4.57). This is especially visible from data for Sibaiskoe deposit. When concentrating ore from Sibaiskoe deposit, content of mercury in copper concentrate and zinc concentrate is actually lower than mercury content in the ore being concentrated by one or two orders of magnitude. It follows from the above that mercury does not go into ore concentrates when processing the main commercial zinc and copper minerals, which are also main mercury yielding minerals. On the other hand, for example, level of mercury content in zinc concentrate from Uchalinskoe deposit is higher than mercury concentration in sphalerite, and copper concentrate from XIX Party Congress deposit contains more mercury than zinc concentrate by several times (Table 4.57) Inconsistency of the discussed data on content of mercury in ores and concentrates to large extent is connected with that usually these data were obtained through analytical research of one or two (less often three or four) samples of ore and concentrate and, therefore, can't be regarded as representative data. Table 4.57 Mercury in ores, concentrates and minerals from Ural deposits, g/t (Ozerova, 1986)
From this angle, interesting are results of research of mercury distribution in ores from a wide group of copper deposits obtained by V.Z. Fursov (1983). Generally, the research was based on relatively representative sample and was carried out using rather reliable analytical method (Table 4.58). One can assume with high degree of probability that data shown in Table 4.58 do adequately represent average content of mercury in copper ores processed from South Ural. The data vary within limits of 9.8 - 13 mg/kg on average (total average value is 11.5 mg/kg). According to document 'State Balance of Mineral Resources of the Russian Federation. Mercury.' (1998), there is 10-12 t of mercury in copper ores produced at Safianovsk deposit in Sverdlovsk Oblast (Mineral Resources of the World at early 1999 ..., 2000). This results in average content of mercury in ore within 10.4 - 12.5 mg/kg (with ore production 960,000 t in 2001), which corresponds to the above values. Table 4.58 Average content of mercury in ores from copper deposits (confidence intervals for reliability 0.95) (Fursov, 1983)
Thus, one can calculate average content of mercury in copper concentrate, which is processed by Ural copper smelting works. Let's assume that concentration works receive ore with average content of mercury 11.5 mg/kg, output of copper concentrate is 10 % and 12 % of mercury contained in ore goes to concentrate. Simple calculations show that, with the above assumptions, average content of mercury in copper concentrate will be 13.8 mg/kg. This is the value that we will use in subsequent calculations. Processes and technologies When concentrating copper ore, copper concentrates most often containing 10-30 % of copper, with rare exceptions, are usually the main product of copper ore concentration. For example, average content of copper in concentrate from Gaisky combined works is 15.8 % (Krivtsov, Klimenko, 1997b). It is floatation process that is mainly used when concentrating sulphide ore. The main quantity of ore is produced by pyrometallurgical process which includes the following process operations: drying of copper concentrates, frying of concentrates, agglomeration of concentrates, melting of prepared batch in melting furnaces, conversion of copper matte and fire refining of crude copper (Voskoboinikov et al., 1979; Gudima, Shein, 1975; Basics of Metallurgy..., 1962; Utkin, 1990). Some operations can be excluded or substituted with other operations in specific cases. For example, oxidizing frying is used generally when processing hugh-sulphur ore or concentrates lean of copper. Various options of pyrometallurgical processing of ore raw materials can be used at one works simultaneously (Table 4.59, Figure 4.11). Table 4.59 Specialties of technological processes for copper production in Ural
The following are purposes or oxidizing frying in the pyrometallurgy of copper: partial removal of sulphur, transfer of a part of iron to oxides from sulphides, production of 25- 30 % matte and gases usable for production of sulphuric acid. Most often the enterprise carries out oxidizing frying of copper concentrates (or prepared batch) in the frying furnace. Sulfur is partly removed, the concentrate gets well mixed with fluxes and returns that are usually added to frying batch, when carrying out frying (at 580- 850 °C) in multiple hearth furnaces. Frying produces dust. Carry over of dust with flue gases in 10-12 % (sometimes more) of weight of batch. When there is high content of dust in flue gas, the cleaning system is usually comprised of cyclones (rough cleaning) and electric filters (fine cleaning). Arrested rough dust is returned to frying batch. Fine dust is usually sent for special treatment in order to extract zinc, lead, cadmium and some rare metals. Content of SO2 in frying gases before the electric filter varies within 12-13 %. A major part of copper is smelted in reflection furnaces where three types of batch is processed: raw, dried or fried. In addition to solid batch, they pour converter slag to the reflection furnace. Converter slag participates in final formation of converter matte and recrement. (The process generates 6.5-9.5 t of recrement with typical copper content 0.3 - 0.35 % per 1 tonne of crude copper.) Main purposes or smelting are: melting of batch, sulphidizing of copper and transfer of sulphidized copper to matte, and simultaneous slagging of major part of iron. This is achieved by melting of fried concentrate together with flux in lean oxidizing atmosphere at temperature 1200 - 1550 °C. They use two types of burners in reflection furnaces: external mixing turbulence gas-and-mazoot (fuel oil) burners and internal mixing gas burners. Consumption of coal equivalent is 120 - 180 kg/tonne of batch. Depending on composition or processed raw materials and used melting technology, content of copper matte is the following: copper 15-60 %, zinc 1-6 %, nickel up to 0.5 %, lead up to 1 %. Pit melting of copper ore is the oldest technique of melting to matte. The melt materials with particle size 20 - 100 mm in pit-type furnaces, so small-particle batch (of ore and concentrates) is subjected to agglomeration or briquetting prior to melting. Everywhere copper matte is processed by conversion (blowing with compressed air) in horizontal converters. Main purposes of conversion process are: oxidizing of sulphides with extraction of sulphur in the form of sulphur angidride, slagging of iron and production of crude copper. Matte is poured to the converter in liquid condition at temperature 1100 - 1200 °C. The temperature quickly increases to 1200- 1300 °C after start of blowing. Gases are removed from converters through gas ducts. Depending on the place of subsequent refining, product crude copper is either poured down from the converter to the mixer (accumulator) and then, as much as needed, to refining furnace in liquid condition, it is cast to to ingots weighing 2 t or more to be sent to special refining works. Converter slag having copper content 1.5 - 2 % is returned to matte melting process in order to deplete it. Extraction of copper to crude copper from matte (taking into account processing of converter slag) is usually 98 - 99 % (extraction of copper from concentrate to crude copper is approximately 93 %). Refining of crude oil is carried out in two stages. First copper is refined using a fire (oxidization) refining technique, after that copper is refined using an electrolysis technique. Removal of a number of admixtures and production of dense anodes for electrolysis copper refining process is the purpose of fire refining process. They use two types of furnaces fire refining of copper: stationary reflection furnaces and tilting furnaces. Anode mix contains 99.4 - 99.6 % of copper; other parts are admixtures remaining after fire refining, including gold, silver, selenium and tellurium. They pour copper to ingots (anodes) having a flat form and lugs after fire refining. Then anodes are sent to electrolysis shop. There anode copper undergoes electrolytic refining in order to produce high purity metal and extract gold, silver, selenium and tellurium, and sometimes nickel and cobalt. The process is carried out in electrolysis baths where anodes are electrically and chemically dissolved in sulphuric acid electrolyte. Pure copper plate on the cathode, admixtures precipitate. Figure 4.11 General diagram of pyrometallurgical processing of copper raw materials
Sources and characteristics of dust and gas emission Frying furnaces (multiple hearth and flying bed), pit-type furnaces and reflector furnaces, converters and concentrate dryers are main sources of dust and gas emission at copper smelting works using primary raw materials. Major part of dust and heavy metals is carried away together with gases from reflection furnaces and converters (Table 4.60). According to (Paper on Lead ..., 1997), 90-95 % of dust and 57 % of lead were released to atmosphere along with emission from reflection furnaces and 5-8 % of dust and 37 % of lead were emitted from converters at Ural copper smelting works. Average quantity of generated process gases is estimated as 50,000 m3 per tonne of non-ferrous metals (Perederij, Mishkevich, 1991). Flue gases generated by a major part of copper production operations have high temperature. Flue gas from frying furnaces has temperature 500-800 °C, flue gas from reflection furnaces has temperature 300-400 °C, flue gas from pit-type furnaces has temperature 350-550 °C, flue gas from converters has temperature 900-1000 °C (Cleaning of Industrial Gases ..., 1992). Table 4.60 Main parameters of emission at copper smelting works in Urals (Paper on Lead ..., 1997)
Cyclones are most often used for rough cleaning of escaping gases (frying gas and converter gas); dry electric filters are main equipment for fine cleaning. Design efficiency of arresting dust by dry electric filters is 98.9 - 99.9 %. However, it is not possible to estimate even average efficiency of flue gas cleaning at copper smelting works in Russia at this stage, because many works use outdated technology, and some technological processed are not fitted with cleaning equipment. For example, until recent time flue gases from reflection furnaces at Sredneuralsky copper smelting works, Krasnouralsky copper smelting works (Sviatogor OJSE) and Kirovogradsky copper smelting combined works had been released to the atmosphere without cleaning (Paper on Lead ..., 1997). This caused sufficient emission of sulphurous anhydride, which is predominant in works' emissions, and dust. High emission of dust causes considerable emission of heavy metals, especially lead. Thus, all enterprises belonging to Uralskaya Mining and Metallurgical Company emitted to atmosphere over 575 t of lead in recent years (2000-2002). This included: Sredneuralsk copper smelting works emitted 170 t (total emission of hazardous substances 79,000 t); Kirovograd copper smelting combined works emitted 114 t (total emission of hazardous substances over 110,000 t); OJSE Sviatogor emitted 291 t (total emission of hazardous substances over 87,000 t); CJSE Karabashmed emitted 79 t of lead to atmosphere in 2002 (total emission of hazardous substances over 97,000 t) (http://metal-trade.ru/news/business/2003/03/1337.s...; http://uralnep.ru/news/view_article.php?newsid=422...). Summary data on specific emission of dust to the atmosphere by some works are shown in Table 4.61. The data shows that there is a substantial variation in specific emission. According to (Emission of Heavy Metals ..., 1998), average value of specific emission of dust in the course of primary production of copper is 46.4 kg/tonne of crude copper. Table 4.61 Specific emission of dust, kg/tonne of products* (Emission of Heavy Metals ..., 1998),
* Specific emission of hazardous substances was over 2 t per 1 t of crude copper at Karabashmed CJSE in 2002. ** Specific emission of hazardous substances to atmosphere was about 600 kg per 1 t of crude copper at Sredneuralsky Medeplavilny Zavod OJSE (Sredneuralsky copper smelting works) (http://metal-trade.ru/news/business/2003/03/1337.s...); Mercury emission and specialties of behaviour of mercury Behaviour of mercury in copper smelting production is little researched. Analytical research of content of mercury in raw materials and in products of processing is not generally carried out in laboratories of copper smelting combined works. Mercury sublimates by 80-90 % in the course of of frying of copper concentrates (Bobrova et al., 1990). In the course of cleaning of sulphurous flue gases mercury is partly arrested together with dust (content of mercury in dust reaches 15-560 g/t) and partly goes to the sulphuric acid production shop together with gas. There mercury is concentrated in slurry in the washing section. The slurry is not used anywhere and, most probably, is simply dumped. Rough dust is circulated (they add it to batch). If fine dust is processed, the it is collected in lead cake (up to 1,100 kg/ton), which then goes to lead works for further processing. Otherwise fine dust is collected in dump arsenate cake (and it usually goes to burial ground disposal) (Bobrova et al., 1990). There are all grounds to believe that behaviour of mercury in the course of production of copper at copper smelting works is similar in many aspects to distribution of mercury in the course of production of zinc. It just has to be mentioned that, on one hand, somewhat more quantity of mercury concentrates in dust arrested by cleaning equipment (due to higher carrying out of dust from furnaces and converters). On the other hand, relative emission of mercury to the atmosphere by copper smelting works is somewhat higher because of less sophisticated technology and outdated equipment. Based on the above information (and taking into account specialties of technological processes, functioning of dust arresting and gas cleaning equipment and behaviour of mercury in the zinc production), one can estimate distribution of mercury in the course of processing of raw materials containing copper as follows (with some conditions and for some material flows) (Figure 4.12). In order to estimate emission and determine specific losses of mercury in the course of production of crude copper from domestic (Ural) copper concentrates, let's consider a fictional enterprise with production capacity 100,000 t of crude copper per year. Above we have demonstrated that content of mercury in copper concentrate coming for metallurgical processing is 13.8 mg/kg, content of copper is 15%, and rate of extraction of copper from concentrate is 93 %. Thus, mass of concentrate processed at the works will be 716,667 t. Total mass of mercury in the concentrate coming for processing is 9.89 t, that means that 98.9 g of mercury is involved per each tonne of produced crude copper. Figure 4.12 Estimated distribution of mercury in the course of processing of raw materials containing copper
When producing 100,000 t of crude copper, about 840 kg of mercury will be emitted to the atmosphere (specific emission 8.4 g of mercury per tonne of copper), 2,670 kg of mercury will be accumulated in sulphuric acid production sludge (26.7 g of mercury per tonne of copper), 198 kg of mercury will go to dump slag (approximately 2 kg of mercury per tonne of copper) and 148.4 kg of mercury will go to sewerage (1.48 g of mercury per tonne of copper). Let's also assume that all these indicators include emission of mercury from other materials used in the course of production of crude copper (such as fuel, flux, etc.). Determined average content of mercury in ore from copper-and-porphyry deposits is 0.87 mg/kg (ref. Table 4.58). Let's assume that the same concentration is characteristic for ore (of similar type) from Erdenetiyn-Obo in Mongolia (developed by concern Erdenet). Content of mercury in concentrate produced by concentration of ore from this deposit will be approximately 1.2 mg/kg. It is easy to calculate that specific emission of mercury to the atmosphere from pyrometallurgic processing of such concentrate will be as follows 0.73 g of mercury per tonne of produced crude copper; quantity of mercury going into sludge will be 2.3 g/t, quantity of mercury going to dump slag will be 0.17 g/t, and 0.13 g of mercury per tonne of produced copper will be discharged to sewerage. In 2001 Sredneuralsky copper smelting works processed about 1 million t of scrap containing about 200 kg of mercury. From this quantity, 17 kg were emitted to the atmosphere, 54 kg went to sulphuric acid production sludge, 3 kg were discharged to sewerage and 4 kg went to solid waste; remaining mercury was redistributed in return products. Based on relation of dust emission in the course of production of crude copper and in the course of production of refined copper (see Table 4.61), one can state that specific emission of mercury in the course of copper refining will be less than similar indicator for crude copper production by 100 times minimum. This statement is rather conditional, however, (taking into account that part of mercury is arrested by gas cleaning facilities, where it mainly concentrates in dust) let's assume that specific emission of mercury to the atmosphere in the course of refining of crude copper is be 0.06 g of mercury per tonne of product. Estimated figures for emission of mercury to the atmosphere and mercury distribution in main waste materials from Ural copper smelting works producing crude copper are shown in Table 4.62. Besides some 10%, 2.3 t , goes to sulphuric acid. Table 4.62. Production of crude copper at Ural works from ore concentrates and estimated mercury emission in 2001
4.4.5 Copper and Nickel Production at MMC Norilsk Nickel OJSCMMC Norilsk Nickel OJSC (hereinafter – MMC Norilsk Nickel) is the largest Russian and world manufacturer of copper, nickel, cobalt, some rare and precious metals. The enterprise includes Trans-polar Branch of MMC Norilsk NickelOJSC (Krasnoyarsk Region, Taimyr Peninsula), Kolsk GMK, including Pechenganickel Combine Joint-Stock Company (JSC) and Severonickel Combine OJSC (Murmansk Region, Kola Peninsula) and a number of other enterprises. Volumes of production of copper and nickel The share of MMC Norilsk Nickelin the total Russian output of nickel is stably making 95-96 %, of refined copper – 55-57 % (Table 4.63, Table 4.64); up to 18.5-19.8 million t of sulphide copper-nickel ores have been per year mined and then refined during the recent years from deposits of Taimyr and Kola Peninsula (Table 4.65). The enterprises of MMC Norilsk Nickelare per year involving into processing all the so-called "circulating" materials and "stale" raw materials (ores, concentrates, dump slag, etc.), produced during the current year or stored earlier, from which 10,000 t of copper and up to 10-15,000 t of nickel are extracted. They are also processing non-ferrous scrap and other raw materials, including those arriving from abroad. Table 4.63 Production of primary nickel by the enterprises of MMC Norilsk Nickel OJSC in 2000 and 2002
Source: (BIKI, 2003, No. 41; Gerasimchuk et al.; Chernyakova ...; http://metal-trade.ru/news/business/2002/12/index...; http://www.infoline.spb.ru/metall.html) Table 4.64 Production of copper by the enterprises of MMC Norilsk Nickel OJSC in 2000 and 2002 *
* Including secondary copper. Source: (http://metal-trade.ru/news/business/2002/12/index...; http://metall.klimenko.ru/arc.15-09-2002.html; http://www.infoline.spb.ru/metall.html; http://www.mineral.ru/Chapters/News/6016.html) Table 4.65 Mining volumes of sulphide copper-nickel ores by MMC Norilsk Nickel, million t (Annual Report of MMC Norilsk Nickel-2001) *
* Calculated from the schedule, which is given in the quoted document. The basis of manufacturing operation of MMC Norilsk Nickelis essentially made up by a unified processing technology of sulphide copper-nickel ores and technological links between the enterprises, which the company includes. Thus, Pechenganickel Combine JSC delivers copper-nickel converter matte by railway to Severonickel Combine OJSC; Trans-polar Branch of MMC Norilsk NickelOJSC delivers rich ore, converter matte, sometimes secondary raw materials to the enterprises situated in Kola Peninsula. The affinage of precious metals produced by Trans-polar Branch, Kolsk GMK and Polyus Closed Joint-Stock Company (CJSC) is made at the Krasnoyarsk, Prioksky and Yekaterinburg plants of non-ferrous metals (Annual Report of MMC Norilsk Nickel2001; Annual Report of MMC Norilsk Nickel-2002). Ore mining The ores of the deposits developed by MMC Norilsk Nickelare divided into rich (compact), ingrained and cupriferous ones. The rich ores are characterized by increased contents of non-ferrous and precious metals and cupriferous ores are notable for higher concentrations of copper. As it was marked above, the rich ores with the contents of nickel of more than 1 % at nickel to copper ratio of at least 1:1 and with a decreased contents of iron (below 25 %) go directly into melting. The ores, which are poorer in nickel contents, require a preliminary enrichment with obtaining of a collective copper-nickel concentrate or separate nickel, copper and pyrrhotine concentrates (Krivtsov, Klimenko, 1997). Ore Dressing At MMC Norilsk Nickelthe ore dressing (by the method of collective-selective flotation) was made at two concentrating mills (CM) (Annual Report of MMC Norilsk Nickel-2001). Talnakh CM refined a part of the rich and cupriferous ores of Talnakh-Oktiabrskoye deposit with obtaining nickel, copper and pyrrhotine concentrates; Norilsk CM – the whole volume of ingrained ores of Norilsk-1 and Talnakh-Oktiabrskoye deposits, a part of the rich and cupriferous ores of Talnakh-Oktiabrskoye deposit, and also the so-called stale pyrrhotine concentrate with obtaining of nickel and copper concentrates. The nickel concentrate contains 5.67 % Ni and 2.9 % Cu, the copper one – 23.6 % Cu and 1.7 % Ni, the pyrrhotine one – 3.7 % Ni and 3.4 % Cu. Extraction of nickel into concentrate makes 88-97 %, of copper – 89-98 %, of cobalt – 66 % (Krivtsov, Klimenko, 1997). At ore dressing they use crushing, grinding, floatation, thickening and pumping equipment. Then, via the hydraulic transportation system the obtained concentrates arrive to the plants; the dressing wastes – the tailings – are placed into special storehouses. Since 1995, they started to involve the mineral raw materials, which were warehoused earlier, into the dressing process, including the ingrained and cupriferous ores, pyrrhotine concentrate, materials from sumps, etc. In 1997, Norilsk and Talnakh CMs implemented the technology of rich ore dressing with extracting the greater part of the pyrrhotines (60-80 %) into the tailings and obtaining of a rich nickel concentrate (9-14 % of Ni contents), and since 1999 the technology of obtaining rich copper concentrates with the 27-29 % contents of copper has been used (Economy and Life-Siberia, 2000). In 1997 Norilsk CM implemented the gravitation-floatation technology of dressing ingrained and cupriferous ores, which allows extracting the concentrate, enriched by platinum metals. The concentrating mill in Kola Peninsula (in Zapolyarny), which is a part of Pechenganickel Combine, was processing local ingrained ores (the average contents of Ni 0.75 %, Cu 0.42 %) with obtaining of a collective copper-nickel concentrate containing 5-6 % of nickel and 2-3 % of copper (Krivtsov, Klimenko, 1997). Extraction of nickel into concentrate was 78-81 %, of copper – 73-76 %. Main diagram of processing sulphide copper-nickel raw materials The preparation of sulphide copper-nickel raw materials to melting envisages agglomeration or pelletization (or combination of these processes) with simultaneous roasting (Goudima, Shein, 1975; Fundamentals of Metallurgy ..., 1962). The concentrate is nodulized in cup granulating machines, and then the obtained pellets undergo hardening roasting in sintering machines with desulphurization down to 30-40 %; the machines have three zones – drying, partial roasting and cooling of pellets, the yield thereof making 90 %. As a rule, the agglomeration charge comprises the concentrate and the returns (recurrent products of the plant) in 1:1 ratio. Apart from it, some burnt chalkstone is added into the charge volume in the quantity of weight 3-4 %. The fuel (charge coke) is usually added to the finished agglomerate before its electric melting in ore heat-treating furnaces (Fig. 4.13). The charge is loaded into electric furnaces through the openings in the dome; the matte and slag are drained through blast-holes. The matte contains 9-12 % of nickel, 5-10 % of copper; the dump slag – 0.078-0.098 % of nickel, 0.063-0.01 % of copper; extraction into the matte – nickel 96-97 %, copper 96 %, cobalt 75-82 %. Converting (purging) of copper-nickel mattes (with the aim to obtain copper-nickel converter matte) is similar by its process and hardware to purging of nickel mattes. For a more complete extraction of cobalt the converters work in the looped cycle with depletion electric furnaces. With this aim the converter slag undergoes depletion in special electric furnaces for recovery of non-ferrous metals by poor sulphide ore or low-grade matte. In this way they obtain the dump slag and the matte enriched with cobalt, which is also directed to converting. The composition of the converter matte obtained at domestic plants is approximately as follows: 37-42 % Ni and 35-37 % Cu. In the converter matte the platinum group metals are concentrating. The limit extraction of non-ferrous metals into the converter matte makes 96-97 %. For division of the converter matte into nickel and copper concentrates they use the flotation (mechanical dressing) method. Cooling of the converter matte is carried out by means of pouring it into chamotte or graphitic moulds dug into ground for slow cooling. In each mould an ingot of about 25 t of weight compactifies. The method of floatation separation of converter matte yields no dump products, as all the metals are distributed among the concentrates, directed to further processing. The losses of metals at this operation are minimal and make at most 0.1-0.2 %. The nickel concentrate is directed, after division of the converter matte, to the nickel line, where it is burnt in fluidized bed furnaces at the temperature of about 1,150 °C, which ensures some amalgamation of the burnt material and reduces the removal of the small-sized fraction. At anodic melting the chalkstone is used in the quantity of up to 20 kg/t of anode; as a reducing agent they apply small fractions of hard coal or coking dust. Extraction of nickel into monoxide makes at roasting 97-99 %, the nickel monoxide then arrives for the reduction melting in electric furnaces such as steel-melting ones, during which they obtain anodic nickel. It has the following approximate composition: Ni 88.4-89 %, Cu 4.5-6.5 %, Co 1.2-2.2 %, Fe 2.5-2.6 %, S 0.4-0.5 %, As 0.001 %. At electrolysis (electrolytic refinement), apart from nickel, also the concomitant impurities pass over from the anodic nickel into the solution. The electrolysis is carried out with disconnected anode and cathode compartments. The yield from loaded anodes makes: scrap 16-18 %, sludge – 4-5 %. The cathode nickel should contain at least 99.99 % of the sum of nickel and cobalt (including cobalt at most 0.005 %). In the sludge, which is generated during electrolytic dissolution of nickel anodes, the metals of platinum group concentrate, which do not pass into the electrolyte, namely, gold, silver, selenium, and tellurium? Sludge processing with the aim to enrich it with the said elements is made in a separate cycle, as a result of which we obtain enriched concentrate of precious metals and nickel, which is returned back into the basic production. The concentrate of precious metals undergoes a complicated processing cycle to obtain each of metals separately in the marketable form. To extract nickel from raw materials (for example, from pentlandite-pyrrhotine concentrate) the also apply melting in suspended condition. The melting charge comprises the concentrate, residues after leaching at nickel extraction, and also quartz flux. After preliminary drying in a rotated furnace, the charge arrives into the furnace, where the sulphides get oxidized forming matte and slag. The matte is directed to converting, while the slag containing 0.8 % Ni and 0.6 % Cu – to a special electric furnace for depletion. The dump slag of the electric furnace contains 0.10 % Ni and 0.25 % Cu. Figure 4.13. Functional block chart of processing sulphide copper-nickel raw materials
The copper concentrate from converter matte separation arrives to the copper production line, where it is annealed in liquid bath furnaces (Vanyukov furnaces). The resulting matte is subject to converting, and the blister copper arrives to igneous concentration, then the anodic copper arrives to the shop of electrolytic refinement for obtaining of cathode copper. The sludge generated at electrolysis is sent to recycling. In 2001, MMC Norilsk Nickel (Taimyr Peninsula) processed the concentrates, obtained after ore dressing (by pyro- and hydrometallurgical methods), at three metallurgical plants: Nadezhdinsky, Nickel and Copper; a shop for production of precious metals concentrates was also operated (Annual Report of MMC Norilsk Nickel-2001). Nadezhdinsky Metallurgical Plant of MMC Norilsk Nickelrefined the whole volume of nickel and pyrrhotine concentrates of Talnakh CM, the whole volume of copper concentrate of the shop of converter matte refinement of Nickel Plant with the yield of converter matte and copper anodes. The Agglomeration Factory and the Nickel Plant refined the whole volume of nickel concentrate of Norilsk CM, the whole volume of enriched stale pyrrhotine concentrate, a part of converter matte of Nadezhdinsky Metallurgical Plant with obtaining of marketable nickel and cobalt. The Copper Plant refined the whole volume of copper concentrate of Norilsk and Talnakh CM and the copper anodes of Nadezhdinsky Metallurgical Plant with obtaining of marketable copper. The metallurgical shop of the production facility of precious metals concentrate was processing the sludge from the nickel and copper electrolysis shops with subsequent production of concentrates of precious metals and metal silver. Mercury in sulphide copper-nickel ores, minerals and concentrates In literature little data may be found on mercury contents in sulphide copper-nickel ores and minerals of the deposits of Taimyr and Kola Peninsula, and also in products of their dressing (Table 4.66). In most cases the presented data is based on occasional single chemical and analytical measurements, which does not allow considering them to be representative. Nevertheless, it is considered (Smirnov et al., 1968) that at formation of copper-nickel deposits, an essential role was played by post-abyssal processes and sulphurization, and sulphur, as it is well-known (Ozerova, 1986), is the basic precipitant of mercury in the earth's crust, which a priori should have promoted accumulation of mercury in sulphide copper-nickel ores (Fursov, 1983). By an estimation of V. P. Fyodorchuk (1983), the average mercury contents in sulphide copper-nickel ores makes 1 mg/kg. The close results have been obtained by V. Z. Fursov (1983), who studied the distribution of mercury in ores of some copper-nickel deposits of Taimyr and Kola Peninsula in quite detail (Table 4.67). Table 4.66 Mercury in ores and concentrates of sulphide copper-nickel deposits (Obolensky et al., 1995; Ozerova, 1986)
* As far as it is known (Annual Report of MMC Norilsk Nickel-2001; Krivtsov, Klimenko, 1997), at the concentrating mills of MMC Norilsk Nickelthey do not obtain the pyrite concentrate; it is possible that in this case the pyrrhotine concentrate is meant. ** The quoted work does not state at what stage of processing of ores the said concentrate was obtained; as a matter of fact, the platinum concentrate at the Norilsk Combine has always been a finished product of a composite and multistage metallurgical processing (including, multiple high-temperature steps) of copper-nickel ores, after which it is difficult to expect such high mercury contents in the finished product; if this concentrate is a product semi-industrial tests at the stage of ore dressing, then the said high concentrations of mercury in it may quite be realistic (including, for example, because of the presence of amalgams). ** An interval estimation of mercury contents in concentrates processed by MMC Norilsk Nickel (Yagolnitser et al., 1995). *** According to (Ozerova, 1962), the mercury contents in the ores of Monchegorsk deposit (under single analyses) makes 9 mg/kg, in pentlandite – 46 mg/kg, in pyrrhotine – 1.8 mg/kg, in magnetite – 3 mg/kg. Based on the data of Table 4.67, let us accept for the sulphide copper-nickel ores of Taimyr the average mercury contents of 1.18 mg/kg; for the ores of Kola Peninsula – 1.41 mg/kg. Table 4.67 The average mercury contents in ores of copper deposits (0.95 confidence reliability interval) (Fursov, 1983)
Emission of Mercury The information on distribution of mercury at production of non-ferrous metals by the enterprises of MMC Norilsk Nickel OJSC is missing in the accessible literature sources. Only one work is known in fact only, in which an expert estimation is made of mercury emissions into the atmosphere by the enterprises of Norilsk Combine (Taimyr Peninsula) in the first half of the 1990s; the value varied within the limits of 0.75-2.5 t Hg/year (the average value – 1.63 t/year) (Yagolnitser et al., 1995). The said estimation of mercury emission was later repeated by the authors of the quoted work in a number of their subsequent publications. The absence of the necessary information does not allow us to evaluate, with a high degree of veracity, the current mercury emission by the enterprises of MMC Norilsk Nickel. In view of the peculiarities of mercury behaviour during the pyro-metallurgical processing of raw materials, which were reviewed in the previous sections, it is possible, apparently, only to establish the order of mercury emission by the said enterprises (mainly into the atmosphere). The data for Pechenganickel Combine demonstrate that in 2001 they processed approximately 7.5 million t of ore (including up to 500,000 t of the received ore concentrate). Under the average concentration of mercury in ores being 1.41 mg/kg, its total amount in the raw materials, processed in 2001, would make ~10.5 t. Let us consider (basing on the peculiarities of mercury behaviour at ore dressing) that 15 % of the metal weight, contained in the ores, passed over at the dressing into the bulk concentrate (~1575 kg of mercury). The concentrate, which contained the said quantity of mercury, arrived to the roasting shop, where up to 95 % of mercury, present in it (1496 kg), got sublimated and passed over into the roast gases, which after dust removal were emitted into the atmosphere. It was shown above that customary some 25-37 % of mercury (in this case 374-554 kg) is ejected out of roast gases with rough and fine dust, stopped by purification facilities. Thus, the remaining amount of mercury (942-1122 kg) was emitted into the atmosphere. A minor part of the metal (~ 50-60 kg) inside the pellets arrived to the melting shop (to the ore electric melting). Besides, about 300,000 t of ore extracted by Pechenganickel Combine fell into the category of rich ore and arrived directly to the melting shop for further processing. This ore contained ~0.42 t of mercury. The said shop also received 300,000 t of rich Norilsk ore (~0.35 t of mercury). In minor amounts mercury is also present in a non-ferrous scrap and other raw materials. Let us consider that in general some 0.8 t of mercury arrived to the pyro-metallurgical process step (to the ore electric melting), of which a minor amount passed over into the dumped slag, still less – into the matte, and the greatest portion of mercury (up to 95-97 %) got sublimated and was removed together with end gases, most probably, into the sulphuric acid production, where it was redistributed among different products (sulphuric acid, sludge, cake of neutralization of the flush hydrochloric acid). Approximately 2-4 % of the arriving mercury was emitted with the end gases of the sulphuric acid shop (~16-32 kg). Thus, in 2001 Pechenganickel Combine emitted some 0.95-1.15 t of mercury (39-47 % of its total weight, which arrived with raw materials) into the atmosphere, 0.37-0.55 t (15-23 %) was accumulated in entrapped dust (which is, as far as we know, a recycled product), ~0.75 t (31-32 %) joined the wastes and the end product of sulphuric acid facility. The amount of mercury arriving in converter matte (from Pechenganickel Combine and Norilsk Combine) to Severonickel Combine is insignificant (it appears to be a couple of kilograms). The melting shop of Severonickel Combine is annually processing up to 100-150,000 t of ore received from Norilsk Combine, and also (about the same quantity) of scrap and other raw materials. The total amount of mercury, which arrived in 2001 into the melting shop of the said Combine may be estimated approximately as 300 kg, from which, in view of the production flow chart, a minor portion (some 4-6 kg) left with the slag into the dump, even a lesser amount – into the matte, some 75-111 kg got captured together with dust in the purification facilities, and some 180-220 kg was emitted into the atmosphere. The sulphuric acid production of the Combine is based on the converter waste gases, the mercury contents in then is obviously insignificant; therefore, it is hardly ever accumulating in significant amounts in the sludge and other products of the sulphuric acid shop. In 2001, Norilsk Combine engaged into its production not only the ore (nickel, copper and pyrrhotine) concentrates, but also the products of dressing (nickel and copper concentrates) of the so-called stale pyrrhotine concentrate (during the previous years it was stored in dumps). The information on the volumes of processed stale pyrrhotine concentrate by the concentrating mill is missing. Besides, Norilsk Combine also involved into production some earlier stored recycling materials, the amount of which is also unknown. At the same time, for example, in 2002 as a whole, MMC Norilsk Nickel produced, from earlier stored recycling materials and stale raw materials, about 6 % of nickel and more than 8 % of copper (of the total output thereof) (Annual Report of MMC Norilsk Nickel-2002). From here it follows that the said stock and raw materials usually made a minor part of the extracted and processed sulphide copper-nickel ores. The total amount of mercury, contained in ores, extracted in 2001, reached 14.3 t (at the average concentration of mercury in ores of 1.18 mg/kg). Let us consider that ~30 % of this amount (~4.3 t) has passed over into the ore concentrates (nickel, copper and pyrrhotine), which then was processed at the metallurgical plants of Norilsk Combine. The above process flow charts of raw materials at these plants allow us to conclude the following. Thus, at Nickel Plant (at agglomeration and electric melting) the overwhelming part of mercury should leave with the end gases, which after dust removal (the mercury partially concentrating in the dust) is emitted into the atmosphere; a minor amount of mercury will go into the dumped slag. At Copper Plant (at drying and especially at melting of raw materials), mercury should also fly away with the end gases into the atmosphere (while partially concentrating at purification in the trapped dust). At Nadezhdinsky Plant mercury would leave into floatation tailings (most probably, in essential amounts); it should also arrive partially into the sulphuric concentrate, which goes to sulphur melting in autoclaves (in this event mercury is partially emitted into the atmosphere with the effluents of this production facility), and also should be rejected with the end gases of the pyro-metallurgical operation step of the sulphide and nickel concentrates (with a definite accumulation in the dust deposited in purification refining equipment). Basing on the structure of mercury losses, calculated above for Pechenganickel Combine, we may estimate, with a certain degree of conventionality, the mercury emission of Norilsk Combine. Thus, the mercury emission into the atmosphere with the end gases of the pyro-metallurgical processing step of raw materials will make 1.7-2.02 t, about 0.65-0.99 t of mercury will be deposited with the dust in the air-treating equipment. The remaining amount of mercury, arriving into production together with raw materials, will be distributed, to this or that extent, among other products (dumped slag, floatation tailings, recycling drains, etc.), and also, apparently, partially lost in the environment with unorganized emissions and unaccounted sources, including the emissions of sulphuric acid production. Because of absence of the necessary information, it is not obviously possible to evaluate all these mercury flows at the given stage. In Table 4.68 the approximate-calculated estimation of mercury emission into the atmosphere by the enterprises of MMC Norilsk Nickel is given. Table 4.68 Estimation of mercury emissions by the enterprises of MMC Norilsk Nickel OJSC in 2001, t
4.4.6 Production of TinNovosibirsky Olovianny Kombinat OJSE (Novosibirsky tin combined works) (located in Novosibirsk) was virtually the only producer of tin in Russia in 2001. It produced 99.9 % of Russian refined tin (Table 4.69), while the combined works' capacity was used to 27.5 % only (Gerasimchuk et al, ...) Table 4.69 Production of tin in Russia, 1,000 t
* Estimate. Source: (Gerasimchuk et al, ...; Mineral Resources of the World at early 1998 ..., 1999; Mineral resources of the World at early 1999 ..., 2000; Mineral Resources of the World on 01.01.2001 ..., 2002;) Technology Principal technology of processing of tin concentrates includes preparation of concentrates, magnetic separation, finishing (at finishing works), frying (at t about 700 °C in order to remove sulphur and arsenic), leaching (using strong hydrochloric acid in order to remove iron, lead, tungsten trioxide and other acid soluble admixtures from concentrates), melting (melting of low iron concentrates is carried out in electric furnaces, melting of other concentrates is carried out in reflection furnaces) in order to produce crude tin. Crude metal containing 93 - 99 % of tin is subjected to refining (fare refining, vacuum refining or electrolytic refining). High purity tin is produced by zone melting of ordinary grade metal. Slag generated by melting in reflection furnaces and electric furnaces undergoes secondary processing in fuming furnaces. Arsenic, zinc, lead and rare metals are stripped along with tin in the course of fuming. Materials skimmed in the course of melting are again melted in electric furnaces, sublimated tin chloride materials (dust containing tin) undergo granulation and in bowls and return to melting process. Lean materials containing tin (sludge from finishing works, etc.) are processed using chlorination technique. Sublimated volatile tin chloride is transferred to sulphuric acid compounds and undergoes electrolysis with an insoluble anode. At Novosibirsky tin combined works they use a complex of technological processes and equipment permitting processing of various types of raw materials containing tin and extract many incident metals (lead, bismuth, arsenic, indium and other metals). The enterprise produces tin of various degrees of purity, solder alloys based on tin, lead, antimony, bismuth, indium, lead-free solder alloys, tin powder and solder powder, low-melting-point solders and alloys; soldering paste and fluxes for soldering of steel and non-ferrous metals, babbites of various grades on the basis of tin, lead, copper and antimony; various grades of bismuth, high purity gallium and indium (People of Action ...). The works has a complex of cleaning plants that ensure 99.9 % removal of dust from flue process gases and virtually 100 % cycling of water, excluding any industrial effluents. Raw materials Novosibirsky combined works has its own raw materials basis comprised of mining and concentration combined works Khinganskoe Olovo (Evreiskaya Autonomous oblast), Dalolovo (Solnechny mining and concentration combined works, Khabarovsky Krai), Tyash-Shan-olovo. Novosibirsky combined works owns a large stock package in tin mining enterprise Deputatskolovo OJSE (Yakutia). Average content of tin in ledge ore in developed deposits is estimated as 0.47% (Mineral Resources of the World in Early 1998 ..., 1999). Average content of tin in the concentrates being processed is 52 %. They produce graded tin concentrates having tin content about 63 % from ores from Khinganskoe deposit (http://www.eao.ru/in_olovo.html). In late 1990ties a share of domestic tin concentrates processed at Novosibirsky combined works was about 60 %; the rest were concentrates imported from China, Nigeria, Peru, Portugal and UK (Mineral Resources of the World in Early 1998 ..., 1999). Seemingly, at present the main part of tin is produced from domestic concentrates; secondary raw materials is used in small quantities. Emission of mercury in the course of production of tin Average content of tin in ores from tin ore deposits is 0.1 mg/kg (Ozerova, 1962). Content of mercury in tin concentrates (deposits in Primorie region, Yakutia, Baikal region) varies within limits of 0.01 - 0.5 mg/kg. Content of mercury in tin concentrates with sulphides is within 0.7 - 0.8 mg/kg (Ozerova, 1986). According to V. Z. Fursov (1983), levels of mercury content in ores from tin deposits are higher and vary from 0.866 to 1.89 mg/kg on average (Table 4.70). Overall average value is approximately 1.3 mg/kg. Let's assume that this quantity of mercury is contained in tin concentrates. Relatively high content of mercury within boundaries of tin ore areas (including deposits in Primorie region) were also pointed out in a number of other works (ref., for example, (Korostelev, 1968)). Table 4.70 Average content of mercury in ores from tin deposits (confidence interval 0.95) (Fursov, 1983)
According to (Yagolnitser et al., 1995), in the first half of 1990-ties mercury emission in the course of production of tin at Novosibirsky combined works varied within 9-33 kg per year. Novosibirsky combined works generated 1-25 t per year directly from tin concentrates (it seems that Novosibirsky combined works was operated to its full capacity at the time). Authors of the cited work arrived at this estimate on the basis that mercury content in the tin concentrates being processed is within 0.01 - 0.5 mg per kg and annually the works used 8,000 t of sulphur ore (pyrite) delivered from Ural (1 mg/kg). If we accept the authors' approach to calculation of emission and, and take into account that production capacities of the works were employed to 27.5 % in 2001, we arrive at a conclusion that mercury emission in the course of processing of tin concentrates should have been 0.3 - 7 kg in year 2001. Let's assume that average content of tin in concentrates was approximately 50 %. Hence, in order to produce 4,500 t of tin (taking into account the rate of tin extraction to commercial product), it was necessary to process approximately 10,000 t of concentrates. Assuming average content of mercury in concentrates 1.3 mg/kg, it was 13 kg of mercury that came into processing with concentrates. A major part of mercury sublimates from concentrates as early as in the frying stage; remaining mercury (approximately 5 % of overall mass) is removed from raw materials in the course of leaching and melting. As we noted above, an efficient dust arresting system is operated at Novosibirsky combined works. This permits us to assume that at least 60 % of mercury contained in flue gases precipitates on filters of cleaning facilities together with dust. Thus, approximately 5 kg of mercury was emitted directly to atmosphere. 4.4.7 Production of LeadIn Russia they produce primary and secondary lead. Usually various information sources (including official ones) only give data on refined lead irrespectively of from what raw materials it is produced (Table 4.71). Table 4.71 Production and consumption of lead in Russia, th. t
* Analysis of available information permits to believe that production of secondary lead in Russia (from lead scrape) is approximately equal to production of lead from ore concentrates and jointly processed return products of lead production and semi-finished products of zinc, copper and rare metal production; ** no data is available. Source: (State Report 'On condition of Mineral Raw Materials ...'; Information and analytical ... Lead and Zinc, 2002; Mineral Resources of the World at 01.01.2001 ..., 2002). According to Ministry of Natural Resources of RF, in 2001 major part of lead in ore was mined at deposits in Primorsky Krai and Krasnoyarski Krai (41 % and 34 %, correspondingly). (State Report 'On Condition of Mineral Raw Materials ...'). Main producers of lead concentrates were OJSE Dalpolimetall (Primorski Krai, deposits Nikolaevskoe, Partizanskoe, Verkhnee, Yuzhnoe; over 800,000 t of complex ore was mined and 23,000 - 24,000 t of concentrate was produced in 2001, of which 70% of concentrate was exported) and JSE Gorevsky GOK (mining and concentration combined works) (Krasnoyarski Krai, develops Gorskoe, 67,500 t of ore was mined and 5,530 t of concentrate was produced in 2001). Some small quantity of lead concentrate was produced by Sadonsky lead and zinc combined works (Northern Osetia-Alania, few hundred t of lead in concentrate) and Salairsky GOK JSE (mining and concentration combined works). Lead concentrates were supplied also from Kazakhstan (Vorontsova ..., Geological Service of Primorie ..., 2000; State Report 'On condition of Mineral Raw Materials ...'; Metal Supply and Sales, 2001, #12; http://www.aktex.ru/rus/analytics/equimpent; http://www.enicey.ktk.ru/nature/13.cfm?nid=200; http://www.rambler.ru/db/news/msg.html?mid=1449831...). Processing of concentrates and production of refined lead was carried out at Svintsovy Zavod Dalpolimetall CJSE (Dalpolimetal lead works) (town Rudnaya Pristan, Primorski Krai, produces lead from concentrates, design lead production capacity 14,500 t per year, and produces some lesser quantities of secondary lead), Verkhne-Nevijsky Zavod (town Verkhne-Nevijsk, Sverdlovskaya Oblast, secondary lead, design capacity 10,700 t), Ryaztsvetmet OJSE (production of lead from secondary raw materials, capacity 11,400 t per year), Electrotsink OJSE (production of lead from lead concentrates and as a by-product in the course of of processing or zinc concentrates, capacity 38,600 t) (State Report 'On Condition of Mineral Raw Materials ...'). Novosibirski Olovyanny Kombinat OJSE (Novosibirski tin combined works) produced some small quantities of tin, seemingly, few hundred t, mainly as a by product in the course of production of tin concentrates. Svintsovy Zavod Dalpolimetall CJSE (Dalpolimetall lead works) only carries out processing of rich concentrates (containing at least 73 % of lead) produced by Dalpolimetall OJSE, by crucible melting. In 2000 Dalpolimetall lead works processed about 8,500 t of lead concentrates and produced about 6,000 t of refined lead; in addition to that, approximately 2,000 t was produced from secondary raw materials (lead scrape, spent submarine batteries, etc.). Production of lead by Svintsovy Zavod Dalpolimetall CJSE (Dalpolimetall lead works) in 2001 can be estimated as 5,000 t, production of lead from secondary raw materials can be estimated as 2,000 - 2,500 t. In 1998 Ryazttsvetmet OJSE took the first place in Russia regarding quantity of lead and lead-based alloy production from secondary raw materials. It produced about 25,000 t of lead (about 50 % of all Russian metal) in that year (Mineral Resources of the World at early 1998 ..., 2000). At Ryaztsvetmet OJSE they use a technology of processing of battery scrape using electric furnaces for lead production (Tarasov, 2001). Melting of lead raw materials is carried out in an electrothermal furnace in the melting shop using a special technology. The difference of the used technology from common processes is that soda is not used as flux agent, the process is carried out without formation of matte, and quantity of slag is reduced to the minimum, because formation of slag depends on ash content in coke and on quality of preparation of scrap. This technology provides sufficient advantages compared to melting in pit-type furnaces or melting in short drum furnaces. In particular, quantity of generated process gases is reduced, carry out of dust is reduced, quantities of return products and slag are reduced and consumption of coke is reduced. Refining of crude lead is carried out using a known technology. However, there is know-how for a number of refining techniques. Processing of products of electric melting of secondary lead raw materials (slag, dross, skimming) and ebonite fraction is carried out in a sublimation furnace. Raw materials and specialties of its processing Sulphide ores having content of metal maximum 8 - 9 % are the main raw material for lead production. Concentrates supplied to lead works for processing usually contain 30- 80 % of lead, 1 - 14% of zinc and up to 10 % of copper (Utkin, 1990). Batch for agglomeration frying is composed of sulphide concentrates, rich oxidized ores, dust, sublimation materials from sulphuric acid production plants at copper smelting and zinc works and fluxes: iron ore or pyrite cinder, limestone and quartz. Lead is produced form ore concentrates mainly using pyrometallurgy technique, by reduction melting of lead in pit-type furnaces. Sulphide concentrate produced by floatation concentration of ore is subjected to oxidizing frying (sintering) together with fluxes. Sintering of lead concentrates is carried out in agglomeration machines. Sulphides of metals are oxidized to oxides, and small particles of ore are sintered to agglomerate in the course of frying. Melting of agglomerate is carried out in a pit-type furnace in reducing atmosphere. Products of melting are: crude lead, copper-containing matte, copper sulphide and lead sulphide. Liquid products of melting are collected in the internal crucible of the furnace, where they settle down according to their density. Crude lead is released from the crucible and is transferred to the refining process. Slag and matte are released into two outside settling reservoirs. Crude lead contains 90- 97 % of pure lead and multiple admixtures. They produce pure lead, alloy of gold with silver and other products in the course of refining. Behaviour and emission of mercury In the course of oxidizing agglomeration frying and pit-type furnace melting of lead concentrates, in which content of mercury varies within limits 0.3 to 520 mg/kg, major part of mercury (over 90 %) sublimates and it is arrested together with dust in electric filters, bag filters and in the course of cleaning of ventilation gases (Bobrova et al., 1990). If sulphuric acid is produced, about 5.5 % of mercury (fed with raw materials) precipitates from gas phase in washing towers. The main mass of dust that is produced in the course of sintering and melting of raw materials (60 - 80 %) is a returned product. This causes increase of losses of metals (and mercury) because of increasing output of dust and constant circulation of considerable quantity of dust. Actually, about 20 -25 % of mercury contained in batch goes to rare metal production processes together with various types of dust. Here dust is subjected to sulphidizing frying. Such elements as mercury, selenium, arsenic, fluorine and other go into gases in the course of sulphidizing frying. Content of mercury in sludge reaches 1.17 %. Sludge undergoes cleaning in order to remove arsenic and mercury, in so doing, calcium arsenite is formed. It goes to burial disposal. Mercury transfers from sulphate product to lead cake virtually completely. Lead cake is a return product (Figure 4.14). According to (Bobkov et al., 1997), average value of mercury emission factor in the course of primary production of lead is 2 g of mercury per tonne of produced metal. Behaviour of mercury in the course of production of secondary lead at Russian works has not been studied; there are no data on mercury emission factor for this type of production. Let's assume, on a very conditional basis, that this emission factor is less than mercury emission factor for primary production of lead by at least by one of magnitude, and that it equals 0.2 g of mercury per tonne of produced metal. Available data permit to estimate mercury emission to the atmosphere in the course of lead production in general for entire country. This estimated general mercury emission to the atmosphere: 60 kg in the course of primary lead production (30,000 t); 6 kg in the course of secondary lead production (30,000 t). As it is shown above, only a relatively small part of mercury is removed from the technological process together with emissions, commercial products and materials going to burial disposal. Major part of mercury is accumulated in return semi-processed products. 4.4.8 Production of Other Non-ferrous MetalsThe production of gold has been described in section 3.3. According to the estimates the ores processed in 2001 contained 4-8 tonnes of mercury, which mainly ended up in the tailings by production of concentrates. It is assumed that about 20% of the amount of the mercury extracted as a coproduct might be emitted to the atmosphere at the different stages of extraction and processing of gold ore, as well as waste storage. No data has been available for estimating emission to the environment from the refining of the gold. Antimony, molybdenum, tungsten and some other (mainly incidental) rare metals were produced from ore raw materials (ore concentrates) in very small quantities in 2000-2001 in Russia. Annual production of concentrates of these metals was rather small, in the order of few thousand t. A considerable part of antimony concentrate, molybdenum and tungsten concentrates were exported, and only a small part was processed at domestic works. Antimony was produced from ore raw materials mainly at Ryaztsvetmet OJSE (in Ryazan), where concentrate supplied from gold and Sarylykhanskoe antimony deposit (in Yakutia) was processed (1,000 -2,000 t per year). Facilities for production of antimony, established in the works in 1995, allow for efficient processing on gold-and-antimony concentrates in order to produce antimony trioxide (metallic antimony) and gold-and-antimony alloy usable for production of gold bars (Tarasov, 2001). The same works produced secondary antimony in the form of alloys (few thousand t per year). There is information that concentrates from Yakutia was also supplied to Novosibirsky tin works in very small quantities. Production of antimony in concentrates in Russia in 2000 was estimated as 4,700 t, production of metallic antimony in Russia in 2000 was estimated as 1,000-2,000 t (Mineral Resources of the World on 01.01.2001 ..., 2002). Lermontovskaya Gornorudnaya Kompania JSE (Lermontovskaya Ore Mining Company), located in Primorski Krai, is one of main exporters on tungsten concentrate from Russia (Mineral Resources of the World in Early 1998 ..., 1999; Petrov et al. ...). Recently production of the enterprise was approximately 4,000-5,000 t per year. Figure 4.14 Diagram of mercury distribution in processing products of lead production (Bobrova et al., 1990)
Molybdenum concentrate also mainly goes to export (Petrov et al. ...). In recent years in Russia production of molybdenum concentrate was 3,000-5,000 t per year. A major part of this production belongs to Molibden OJSE (Sorsky combined works, Khakasia, up to 90 % of Russian mining production). Also Tyrnyauzski combined works (Kabardino-Balkaria) and Zhirekensky Molibden OJSE (Chitinskaya Oblast) produced molybdenum concentrate in very small quantities (Blagutin). Taking into account minor quantities of antimony concentrates, molybdenum concentrates and tungsten concentrates processed at Russian works, and taking into account content of mercury in concentrates or in ores, whish are seldom higher that 1 mg/kg, according to scarce data available from literature (Ozerova, 1986; Fursov, 1983); one can assume that mercury emission to the atmosphere in the course of production of antimony, molybdenum and tungsten is small. It can be estimated as 3-5 kg per year in the entire country. 4.4.9 SummaryThe present information on mercury emission to the air and mercury in waste and products from nonferrous metal production in the Russian Federation is summarised in Table 4.72. It has within the present inventory not been possible to investigate all parts of the mobilisation of mercury by non-ferrous metal production. The estimate on mercury on tailings from combined nickel and copper production indicates that very high amounts of mercury may also be disposed of with tailing form copper (Ural enterprises) and zinc production. For further development of the inventory it will be necessary to obtain more specific information directly from the enterprises. Table 4.72 Mercury emission and mercury in waste and products from nonferrous metal production in theRussian Federation, 2001, best estimates, tonnes
n.a. not assessed bacause data have not been available 4.5 Ferrous MetallurgyTable 4.73 shows data that characterize outputs of main ferrous metallurgy products in Russia in 1999-2002. Table 4.73 Production of main types of ferrous metallurgy products in Russia, 1999-2002, million t
Source: (Analytical Record on the Condition ...; Katunin, 2001; Kozyrev, 2002; with supplements) Largest metallurgical combined enterprises operating in Russia represent industrial complexes, as a rule, with a complete technological cycle, including mining enterprises, coke and chemistry and refractory production facilities, blast furnaces (2 to 7 blast furnaces), steel melting and rolled metal facilities, as well as construction, repair, energy, transport and other units; the number of employees at each such enterprise is up to 20-40,000 persons. Features of blast furnace production The process of pig iron melting in blast furnaces is continuous. Raw materials include sinter, flux, coke, pellets, blown materials, natural gas. Blast furnaces operate using counter-flow process. Sinter, flux, pellets and coke are loaded, from time to time into the blast furnace from the top. Air heated to 1,050-1,300°C is fed to the blast furnace from the bottom and passes through the ascending blend, that is heated, recovered and melted. Pig iron, the main product of blast furnace production, is an alloy of iron with carbon, containing certain quantities of Si, Mn, P, S. According to its purpose, pig iron is divided into three groups: 1) conversion pig iron, i.e. designed for processing into steel; 2) casting pig iron, i.e. pig iron used for castings (pig iron castings); 3) special (blast furnace ferrous alloys used as deoxidizer for steel production) (Principles of Metallurgy ..., 1962). Spent blast furnace gas is a fuel; therefore, it is removed from the blast furnace and, after pre-treatment, is sent to blast furnace (Cawper) stoves (blast furnace air heater), wherein it is incinerated together with natural gas or coke gas, thus heating blow air for the blast furnace. At the outlet of the stove, temperature of the blast furnace gas makes 300-500°C; its quantities are from 2,000-2,500 to 3,800-4,000 m3 per tonne of pig iron (depending on the type of melting and pressure); dust content in the blast furnace gas when the oven works with the normal pressure in the upper part of the blast furnace) is 50-60 g/m3 (sometime up to 100 g/m3); when increased pressure is used, it is 35-40 g/m3 (Stark, 1990). As a rule, a multi-stage cleaning process sis used to entrap dust. Gas and dust removal equipment of the 1st stage includes dry systems (cyclones with the flow turning of 180°), then wet systems are used (nozzle scrubber, Venturi pipe with a drop trap and throttle group or wet tubular electrical filters). Usually, coarse cleaning efficacy is not more than 65-70%. At some enterprises throttle groups of cleaning equipment have been replaced, in recent years, by gas utilization turbines without compressors. The average efficacy of gas and dust removal systems at CIS enterprises is estimated at 98 % (Emissions of Heavy Metals ..., 1998). Table 4.74 shows the suppliers of raw materials for the main metallurgical enterprises in Russia. Raw materials for small enterprises of the Northern and Middle Ural regions are mainly supplied from Kachkanar group of deposits and deposits of Tagil-Kuvshinskiy, Serov-Ivdelsky and Bogoslovsky regions; similar enterprises of Southern Ural receive ore mainly from deposits in the Magnitnaya Mountain and Khalilovskaya group. Table 4.74 Suppliers of unprocessed iron raw materials to main metallurgical enterprises of Russia
Source: Analytical Record on the Condition of ferrous...; Afanasyev et al., 1997; Gobal Mineral Resources at the Beginning of 1998..., 1999; bal Mineral Resources at the Beginning of 1999..., 2000; Sharov et al., 1997. Mercury emissions during blast furnace production of pig iron The content of mercury in concentrates from Kursk Magnetic Anomaly (KMA) deposits, the main source of raw materials for Russian enterprises, is within 0.01-0.1 mg/kg (Stoylensk and Korobovsk deposits); concentrates from Korshunovsk deposit (Siberia) include 0.02-0.085 mg/kg (Ozerova, 1986). We presume that the average mercury content in blast furnace iron ore and in pellets is 0.06 mg/kg, in sinter, metal additives and in coke it is 0.0004 mg/kg; in natural gas it is 0.1 μg/m3, in limestone it is 0.05 mg/kg, and in manganese ore it is 0.06 mg/kg. based on data of Table 4.75, we calculate the specific quantity of mercury fed to the blast furnace process (per tonne of produced pig iron). It will be 39.86 mg/t of pig iron (0.03986 mg/kg of pig iron). Presuming that 99% of mercury, used for blast furnace process, is sublimed and, eventually, emitted to atmosphere the specific emission of mercury makes 0.0395 mg/kg of pig iron. This indicator corresponds to the known mercury emission factor, calculated by J. Pacyna and E. Pacyna (2000), which is equal to 0.039 g of Hg/t of pig iron, which probably can be used for estimating mercury emissions during production of pig iron in Russia (Table 4.76). The total amount of mercury mobilised and emitted is estimated at 1.8 t/year. Considering the uncertainty the range of the total amount mobilised is roughly estimated at 1.2-2.4 t/year. Table 4.75 Specific consumption of main materials (kg) for production of one t of pig iron
* For 2001, minimum mercury concentrations are used; in reality, some enterprises use, for instance, limestone and iron ore with higher mercury concentrations. Table 4.76 Mercury emission during production of blast furnace iron in Russia, 2001
Mercury emission from ironworks In Russia, there are several hundreds of ironworks (production of casting) (mainly, at machine-building enterprises). The leading place among iron foundry facilities is taken by blast cupolas (about 90% of the total melt); about 10% of castings are made in arc furnaces; some enterprises use induction furnaces. The cupola is a shaft furnace designed for melting pig iron in foundries. Blend materials are loaded to the shaft from the blast furnace top in layers (charges): blast furnace iron in pellets, metal scrap, flux and coke. Melted coke is collected in a hearth and is fed to the receiver. The output efficiency of such furnaces is from 1 to 60 t/hour. On the average, about 18% of coke, 2-3% of flux, up to 20% of scrap iron, 40-45% of pellets and 15-20% of recycled materials from its own production are used per tonne of finished casting products. In foundries, dust and gas emissions occur when melting metals, pouring metals into moulds, during shaking and clearing of castings, during manufacture of cores, preparation of mounding sand, loading and unloading operations in the blend area. The main source of dust and gas emission is melting shops (foundries), which give up to 50-80% of all solid emissions. For melting one t of liquid metal, 1000 m3 of gas are emitted from the cupola; dust concentration is about 1-10 g/m3. the average efficacy of emission cleaning when pig iron is melted in open cupolas at CIS enterprises is estimated at 90% (Emissions of Heavy Metals ..., 1998). It was found (Emissions of Heavy Metals ..., 1998), that the specific emission of mercury in ironworks makes 0.001 g Hg/t of casting (at 90% dust entrapment efficacy). Annually, about 9-10 million t of castings are produced in ironworks by Russian enterprises. Thus, for the whole country the mercury emissions can be estimated at 9-10 kg/year. Mercury emission from steel production facilities Steel is produced in Russia by means of the basic oxygen furnaces (about 63% of the total production output), electrical arc melting (about 14%) and open-hearth furnaces (about 24%) (Yugov, 2002). Thus, we can presume that in 2001, in Russia, about 8 million t of steel were produced by electrical arc melting; 37 million t by basic oxygen furnaces and 14 million t by open-hearth furnaces. Data about specific mercury emission during production of steel at domestic enterprises are not available. Belarusian researchers organised experimental work at Belarusian Metallurgical Combined Enterprise; they found that mercury concentrations in dust of electrical steel-making furnaces (from the hose filters) caries within 2.241-15.333 g/t (the average figure was 8.446 g/t) (Emissions of Heavy Metals ..., 1998). Specific mercury emission, taking into account unorganized emissions during steel making in electrical arc furnaces in CIS countries, is estimated by the authors of the mentioned work at 0.012 ã Hg/t of steel, neglecting unorganised emissions, i.e. 0.007 g of Hg/t of steel. Thus, total emission of mercury during this process can be estimated for the whole of Russia (in 2001) at about 98 kg of mercury. Relatively high concentrations of mercury in dust and increased emission of mercury can be explained by a wide use of scrap iron, including mercury-containing materials, as the initial raw material for electrical steel making. To increase the content of carbon in the blend they use pig iron, coke and broken electrodes. Steel alloying and oxidizing is performed using standard ferrous alloys and alloy additives. According the data (Emissions of Heavy Metals ..., 1998), the open-hearth furnace dust (Zaporozhstal enterprise, Ukraine) had the mercury content of 0.098 mg/kg, which in fact 2 orders lower than in dust from electrical steel-making furnaces. With some degree of conventionality we can presume that specific emissions of mercury in steel making facilities using open-hearth furnaces and oxygen converters do not exceed a similar indicator for ironworks making pig iron castings, i.e. about 0.001 g Hg/t of steel. Hence, we can draw a conclusion that mercury emission in Russia during making of steel using the above processes was about 51 kg in 2001. Thus, total mercury emission to atmosphere during making of steel in Russia in 2001 can be estimated at 149 kg (0.15 t).
|
|||||||||||||||||||||||||||||||||||||||||||||||||||||||||||||||||||||||||||||||||||||||||||||||||||||||||||||||||||||||||||||||||||||||||||||||||||||||||||||||||||||||||||||||||||||||||||||||||||||||||||||||||||||||||||||||||||||||||||||||||||||||||||||||||||||||||||||||||||||||||||||||||||||||||||||||||||||||||||||||||||||||||||||||||||||||||||||||||||||||||||||||||||||||||||||||||||||||||||||||||||||||||||||||||||||||||||||||||||||||||||||||||||||||||||||||||||||||||||||||||||||||||||||||||||||||||||||||||||||||||||||||||||||||||||||||||||||||||||||||||||||||||||||||||||||||||||||||||||||||||||||||||||||||||||||||||||||||||||||||||||||||||||||||||||||||||||||||||||||||||||||||||||||||||||||||||||||||||||||||||||||||||||||||||||||||||||||||||||||||||||||||||||||||||||||||||||||||||||||||||||||||||||||||||||||||||||||||||||||||||||||||||||||||||||||||||||||||||||||||||||||||||||||||||||||||||||||||||||||||||||||||||||||||||||||||||||||||||||||||||||||||||||||||||||||||||||||||||||||||