|
Impact categories, normalisation and weighting in LCA 6. Photochemical ozone formation
Ozone is formed in the troposphere under the influence of sunlight when nitrogen oxides are present. When VOC's are also present, peroxy radicals can be produced. Peroxy radicals are highly reactive and toxic compounds, and the presence of peroxy radicals can result in an increase of the concentration of ozone through a complex reaction pattern. Ozone is a secondary pollutant, as there is practically no ozone present in source emissions derived from human activity. Tropospheric ozone, or ground level ozone, has been recognised as one of the most important environmental threats on the regional scale. At high concentrations it is hazardous to human health, but already at lower concentrations it causes damage to vegetation. Ozone is a transboundary pollutant, and it can be produced or consumed by other pollutants during transport over long ranges. The health problems caused by ozone have generally been considered to be an effect of the very high peaks of ozone concentration, known as ozone episodes. Increased background levels of ozone cause damage to vegetation, and thereby ozone also imposes an economic threat through a potential reduction of crop yield. It is assumed that anthropogenic emissions have resulted in a rise in the global background of ozone concentration from around 10 ppb in the year 1900 to around 20 ppb in 1975 (Fenger 1995). 6.1 Substances contributing to the impact categoryThe principal precursors of tropospheric ozone are
Primary reaction scheme for ozone formation Reactions (I)-(III) govern the background level of ozone in the troposphere: NO2 + hv –> NO + O (I) If VOC's are also present, they are oxidised to produce peroxy radicals. Peroxy radicals can either consume NO or convert it to NO2 and thus compete with ozone produced by reaction (II). Less ozone is thereby destroyed through reaction (III), and the ozone concentration will then increase. 6.2 Photochemical ozone creation potential (POCP)In EDIP (Hauschild & Wenzel, 1998), the photochemical ozone formation is described through POCP, the photochemical ozone creation potential, as an individual impact category. While POCP is used in Europe for the ranking of VOC's according to their ability to produce ozone a slightly different approach is used in the US: Incremental Reactivity (Carter et al. 1995). The "European approach" is being used in the guideline as well as in the technical report (Fuglsang 2005). POCP describes the production of ozone from a VOC emission through computer modelling of a complex series of chemical reactions in the atmosphere over a given scenario. A large amount of input data is required for the calculation of POCP by the model. The input data consist of the following principal components (Derwent et al. 1996):
The model describes the chemical composition of primary pollutants during the transport away from their sources and of secondary pollutants during the transport towards the sensitive receptors where environmental damage may occur. In the model, the chemical composition of parcels of air is followed as they travel across Europe. Emissions of NOx, CO, SO2 and VOC's are introduced into the air parcels in a series of trajectory studies. The trajectories are meant to be illustrative of the general situation during photochemical episodes in Europe, and they illustrate the photochemical production of ozone over 1-5 days (Derwent & Jenkins 1991). For a given VOC, POCP is calculated as the average of the results of the three scenarios. Most of the VOC's are oxidised more than 95% after 4-5 days, so that the calculated POCP represents the total ozone creation potential. 6.2.1 Definition of POCP POCP is generally presented as a relative value where the amount of ozone produced from a certain VOC is divided by the amount of ozone produced from an equally large emission of ethene. The unit of POCP is grams of ethene equivalents per gram of gas (g C2H4/g VOC). Ethene has been chosen as a reference gas as it is one of the most potent ozone precursors of all VOC's. By definition, the calculated POCP values are not absolute values. POCP will be a function of the scenarios chosen, i.e. from one geographical area to another. As data for e.g. the chemical and photochemical reactions are often not known in great detail, their representation in the model will often be a compromise. Therefore, even for the same scenario, the POCP values can be calculated with higher precision when more accurate input data and more powerful computer tools are available. POCP values reflect not only the present amount of ethene equivalents but also the concentration of the present NOx values. It may also be relevant in some cases to distinguish between high and low NOx areas, taking into consideration that the background concentration of NOx is lower in, e.g. Scandinavia. The normalisation reference is therefore calculated by taking the differences between high and low NOx areas into account. 6.3 Normalisation reference and weighting factorsThe normalisation references for photochemical ozone formation potential and the weighting factors for photochemical ozone formation are calculated according to the formula presented in chapter 1, Introduction. Table 6.1 presents the figures for normalisation references and weighting factors. Table 6.1 Normalisation references and weighting factors for photochemical ozone formation (Fuglsang 2005; Busch 2005).
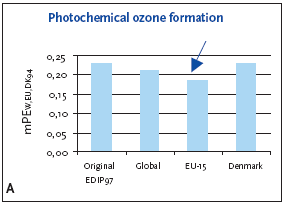
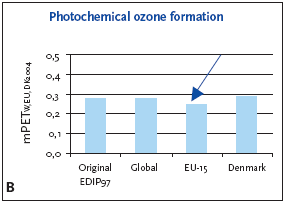
6.3.1 Recommendation of applying normalisation reference and weighting for photochemical ozone formation For photochemical ozone formation as a regional effect the EU-15 normalisation reference is recommended for impact potentials located in Denmark as well as in Europe or the global normalisation reference if the locality is outside Europe or unknown. 6.4 Example of applying normalisation reference and weighting for photochemical ozone formationFigure 6.1 illustrates the normalised photochemical ozone formation potential. For impact potentials located in Denmark the EU-15 normalisation reference combined with the EU-15 weighting factor for photochemical ozone formation are recommended. Based on an impact potential for the product in question at 0.0046 kg C2H4-eq./year the actual normalised and weighted values are 0.18 mPEEU94 and 0.25 mPETEU2004 respectively. Figure 6.1 Normalised (A) and weighted (B) photochemical ozone formation potentials for production of a refrigerator at different localities.
The chosen normalisation reference puts less attention to photochemical ozone formation than if the global or Danish reference was applied. The difference is however small, about 10-15%, and the practical consequences are probably without importance. 6.5 If you would like to know moreAltenstedt, J. & Pleijel, K. 1998, POCP for individual VOC under European conditions. IVL Report B-1305, Swedish Environmental Research Institute, Stockholm. Busch, N.J. 2005, Calculation of weighting factors. In Stranddorf, H.K., Hoffmann, L. & Schmidt, A. Update on impact categories, normalisation and weighting in LCA. Environmental Project no. 995, Danish EPA, 2005. Carter, W.P.L., Pierce, J.A., Luo, D. & Malkina, I.L. 1995, Environmental Chamber Study of maximum incremental reactivities of volatile organic compounds. Atmospheric Environment, 29 (18) pp. 2499-2511. Derwent, R.G. 1996, Photochemical ozone creation potentials for a large number of reactive hydrocarbons under European conditions. Atmospheric Environment, 30 (2) pp. 181-199. Derwent, R.G. & Jenkin, M.E. 1991, Hydrocarbons and the long-range transport of ozone and PAN across Europe. Atmospheric Environment, 25 (8) pp. 1661-1678. Fenger, J. 1995, Ozon som luftforurening. DMU Tema-rapport 1995/3. Fuglsang, K. 2005, Photochemical ozone formation. In Stranddorf, H.K., Hoffmann, L. & Schmidt, A. Update on impact categories, normalisation and weighting in LCA. Environmental Project no. 995, Danish EPA, 2005. Hauschild, M. & Wenzel, H. 1998, Photochemical ozone formation as a criterion in the environmental assessment of products in Environmental assessment of products.Volume 2 Scientific background eds. Hauschild. M. & Wenzel. H. London: Chapman & Hall. McBride, S.J., Oravetz, M.A. & Russel, A.G. 1997, Cost-benefit and uncertainty issues in using organic reactivity to regulate urban ozone. Environm. Sci.Technol. 31 (5), pp. 138A-244A. Olivier, J.G.J, Bouwman, A.F., van der Maas, C.W.M., Berdewski, J.J.M., Veldt, C., Bloos, J.P.J., Visschedijk, A.J.H., Zandveld, P.Y.J. & Haverlag, J.L. 1996, Description of EDGAR version 2.0: A set of global emission inventories of greenhouse gasses and ozone-depleting substances for all anthropogenic and most natural sources on a per country basis and on 1ox1o grid. RIVM report nr. 771060 002/TNO-MEP report nr. R96/119. Ritter, M. 1997, CORINAIR 94 - Summary Report - European Emission Inventory for Air Pollutants. Copenhagen: European Environment Agency. UN-ECE 1979, Convention on Long-range Transboundary Air Pollution. United Nations, Economic Commission for Europe. Available: http://www.unece.org. UN-ECE (1991). Protocol to the 1979 Convention on Long-range Transboundary Air Pollution concerning the control of emissions of volatile organic compounds or their transboundary fluxes. United Nations, Economic Commision for Europe. Available: http://www.unece.org. Wenzel, H., Hauschild, M. & Alting, L. 1997, Environmental Assessment of Products,Vol. 1: Methodology, tools and case studies in product development. London: Chapman & Hall.
|

