Ecolabelling of printed matter - part II
3 Impact assessment
- 3.1 Methodology
- 3.2 Characterisation factors for the chemical-related impact categories
- 3.3 Results of impact assessment: Reference scenario
- 3.4 Results of impact assessment: Average energy (scenario 1)
- 3.5 Results of impact assessment: Saturated paper market (scenario 2)
- 3.6 Results of impact assessment: Variation in paper waste (scenario 3)
- 3.7 Results of impact assessment: Variation in printing ink consumption (scenario 4)
- 3.8 Results of impact assessment: Waste water treatment included (scenario 5)
- 3.9 Results of impact assessment: Alternative biocide agent for rinse water (scenario 6)
- 3.10 Results of impact assessment: No waste water emitted (scenario 7)
3.1 Methodology
The impact assessment methodology used here is the one defined by the EDIP method (Wenzel, Hauschild and Alting 1997; Hauschild and Wenzel 1998). The impact categories included cover potential global impacts (global warming and ozone depletion), potential regional impacts (acidification, nutrient enrichment, photochemical ozone formation, chronic human toxicity via water and soil, and chronic ecotoxicity in water and soil) and potential local impacts (acute human toxicity via air, acute ecotoxicity in water, hazardous waste, nuclear waste, slag and ashes, and bulk waste. In addition, resource consumption (RC) is included. The resources are treated as the equivalent amount of pure raw material, e.g. pure copper.
The EDIP LCV tool version 3.11 Beta (Miljøstyrelsen 1999) is here used to perform the calculations in the different steps of the impact assessment described below, i.e. classification, characterisation, normalisation and weighting, but the modelling has been done in a spreadsheet model. In addition the impact assessment calculations have been controlled (spot tests and critical values) and supplemented by spreadsheet calculations especially for the chemical related impact categories
3.1.1 Classification
Emissions (or other exchanges) mapped in the inventory are assigned to the relevant impact categories, e.g. CO2 and CH4 emission are assigned to global warming potential (gwp) and the CH4 emission is also assigned to photochemical ozone formation.
3.1.2 Characterisation
For each impact category, a category indicator result (EP) is calculated by summing up the results of each assigned emission quantity (Q) multiplied by its corresponding characterisation factor (EF) within that impact category:
EPimpact category A = Q1A * EF1A + Q2A* EF2A + …………
For example for global warming:
EPgwp = QCO2 * 1 + QCH4* 25 + ……….
In this example EFCO2 has the value 1 g CO2/g CO2 and EFCH4 the value 25 g CO2/g CH4, so the resulting EPgwp is given in the unit gram of CO2. As is indicated by this example, all the characterisation factors for the emitted substances contributing to global warming are expressed in units of CO2 equivalents. This is the reason why characterisation factors in the EDIP methodology are also called Equivalency Factors (EF). Furthermore, the category indicator result or impact potential is called Effect Potential (EP) in the EDIP methodology.
The category indicator results for all the impact categories included represent the characterised Life Cycle Impact Assessment (LCIA) profile of the generic printed matter. This profile can be presented as such, but here we have chosen to represent the profile as normalized values and as weighted values to assist comparisons across impact categories.
The Characterisation factors used in this study are taken from Wenzel, Hauschild and Alting (1997), Hauschild and Wenzel (1998), Miljøstyrelsen (1999, and a soon to be issued new version including factors for textile chemicals) and Larsen et al. (1999a, 1999b) or estimated as part of this study, see Section 3.2.1.
3.1.3 Normalisation
In order to provide an impression of the relative magnitude of the potential impacts and resource consumptions, the category indicator results can be related to reference information. In the EDIP method this reference information is represented by the total impact potential or resource consumption in the world divided by the number of world citizens. For example for global warming the reference information (normalisation reference (NR), designated ER90) is 8,700 kg CO2-equivalents/person/year, meaning that in 1990, greenhouse gases equivalent to 8,700 kg CO2 was emitted to air on average for each citizen worldwide. Also for ozone depletion, and for all resource consumptions, the normalisation reference (for resources RR90) is based on global values whereas for all other impact categories, the reference region is Denmark (Sweden for nuclear waste).
The normalized category indicators (NEP) and normalized resource consumptions (NRC) are calculated by dividing the category indicator result or resource consumption (RC) by the corresponding normalisation reference (EP/ER90 or RC/RR90). The normalised results are thus expressed in units of person-equivalents (PE) or typically divided by 1000 and designated milliperson-equivalents (mPEWDK90 or mPEW90). During normalisation in the EDIP method the category indicators for chronic toxicity, i.e. chronic ecotoxicity in water (etwc), chronic ecotoxicity in soil (etsc), chronic human toxicity via water (htwc) and chronic human toxicity via soil (htsc) are gathered in one aggregated average toxicity impact category called persistent toxicity (pt). In this way, the toxicity at a regional scale is gathered in one category: NEP(pt) = (NEP(etwc) + NEP(etsc) + NEP(htwc) + NEP(htsc))/4. The category indicators for acute effects, i.e. acute ecotoxicity in water (etwa) and acute human toxicity via air (hta) are kept separate. Thus two acute toxicity related impact categories at the local scale are defined, i.e. one for acute ecotoxicity (et): NEP(et) = NEP(etwa), and one for acute human toxicity (ht): NEP(ht) = NEP(hta).
The normalisation references used in this study are taken from Wenzel, Hauschild and Alting (1997), Drivsholm et al. (1996) and Miljøstyrelsen (1999).
3.1.4 Weighting
By normalisation we arrived at the different potential impacts from the product system in question (i.e. the functional unit) related to the impacts from an average person in 1990. However, we have no indication of how serious the different normalized category indicator results are compared to one another. By introducing weighting factors (WF) we can achieve an indication of seriousness.
In the EDIP method, the weighting factors for the potential environmental impacts are based on political environmental targets and for the resource consumption they are based on the scarcity of the resource as expressed by the supply horizon. So the weighting factors for the individual impact categories are based on the Danish political targets for the reduction of impact within regional and local impact categories whereas weighting of the global impact categories is based on international conventions and plans of action for reduction. The reference year is 1990 and the target year is 2000 meaning that if the political target is to reduce the impact within a certain impact category by 50% during that period the weighting factor (WF) becomes 2 (100/50 = 2). The weighted normalized category indicator results (WEP) are calculated by multiplication: WEP = WF * EP, and expressed in targeted milliperson-equivalents (mPETWDK2000). For normalized resource consumption the supply horizon for non-renewable resources is calculated by dividing the known reserves by the annual global consumption. The weighting factor is afterwards calculated as the reciprocal of the supply horizon. The normalized resource consumption is multiplied by the corresponding weighting factor giving rise to the weighted normalized resource consumption (WR) expressed in units of milliperson-reserves (mPRW90).
By weighting we have the opportunity to aggregate the environmental impact category indicator results in one common impact score (unit: mPETWDK2000) and the entire individual weighted normalized resource consumption in another common score (unit: mPRW90).
The weighting factors used in this study are taken from Wenzel, Hauschild and Alting (1997), Drivsholm et al. (1996) and Miljøstyrelsen (1999).
3.2 Characterisation factors for the chemical-related impact categories
The impact categories on ecotoxicity and human toxicity differ from all the other impact categories because a very large number of chemical emissions may contribute to potential toxicological impact. Substances contributing to other impact categories such as global warming, nutrient enrichment and acidification (mainly energy-related impact categories) are limited in number and well defined, and characterisation factors are already available. However for the chemical-related impact categories covering ecotoxicity and human toxicity, a sufficient number of characterisation factors are not at all available to day to cover all the most important contributors. Furthermore many of the existing characterisation factors for the chemical related impact categories are based on poor data availability and/or poor data quality. In order to compensate for this application factors are used when characterisation factors are estimated. For example application factors between 10 and 1000 are used in the EDIP method when characterisation factors for chronic ecotoxicity are estimated. This estimation principle has the consequence that the value of the characterisation factor for a given substance may vary a factor of 10 or even 100 depending on the data available and used. The characterisation factors and the normalisation references for the chemical related impact categories should therefore be considered as having a higher uncertainty than those of the energy related impact categories.
In this study, we have tried to get a better coverage of the chemical-related impact categories than is typically the case in LCA studies by including characterisation factors from recent work in other industry sectors and by calculating new ones for chemical emissions expected to contribute significantly.
As is evident from the scoping and inventory (see Section 1.1.2 and 2.1- 2.3), the coverage of emissions from processes in the material stage and the disposal stage are far from as detailed as for the production stage (see Annex B), and specific chemical emissions are rarely known except for emissions of metals from electricity production, see Annex C.
In spite of the fact that the inventory of the production stage is much more detailed than that of the other stages (see Section 2 and Annex B), even the composition of the raw materials used during the production stage is based on simplifying assumptions, and some minor components have been excluded due to lack of data.
An overview of the emissions, for which characterisation factors for the chemical related impact categories are included in this study, is given in Annex C.
The total number of emissions to air included in this study is 99 (excluding emission of CO2 and water) and compiled in Annex C. Among these, 33 emissions are covered by characterisation factors for human toxicity corresponding to 33% (33/99) and 26 are covered by characterisation factors for ecotoxicity corresponding to 26%. The emissions from the material stage and the disposal stage (mainly the former) include unspecific categories like VOC, NMVOC, unspecified dust for which more specific information of actual content is not available. 48% of the total emitted quantity (kg) is covered by characterisation factors for human toxicity and 21% for ecotoxicity part. If we exclude the amount coming from some of the highest contributing emissions (SO2, NOx, unspecified dust, COD, calcium, Cl- and suspended solids), for which at least the main part typically does not contribute significantly to the potential ecotoxicity impact, the coverage becomes 64% for the ecotoxicity impact category.
The total number of emissions to water (103) included in this study is compiled in Annex C, except for 20 emissions from the production stage, covering substances for which the main part is assessed not to contribute significantly (see below) to the potential impact of the generic printed matter and therefore not included in the LCV-tool calculations, on which Annex C is based. 31 waterborne emissions are covered by characterisation factors for human toxicity corresponding to 25% (31/(103+20)) and 45 emissions are covered by characterisation factors for ecotoxicity corresponding to 37% of the total number.
The emissions from the material and disposal stage also include unspecific types like COD, TOC, VOC and suspended matter, for which information of the actual content is not available. Only 3.1% of the total emitted quantity (by weight) is covered by characterisation factors for human toxicity, and only 3.4% is covered for ecotoxicity. If we exclude the amount coming from the highest contributing emissions (SO4--, Tot-P, Na+, COD, calcium, Cl- and suspended solids), for which at least the main part typically does not contribute significantly to the toxicity impact categories, the coverage becomes 48% for human toxicity and 53% for the ecotoxicity part.
The main part of the specifically known individual emissions to water, which are not included (i.e. characterisation factors lacking), consists of inorganic salts (e.g. disodium silicate, sulphates), polymers (e.g. acrylates, modified phenol resin) and acids/bases (e.g. NaOH, HCl). In general, these substances/mixtures have a low toxicity and are not expected to contribute significantly to the toxicity impact categories, if not emitted in high quantities. In the latter case they will typically contribute only to acute ecotoxicity (e.g. reactive monomers from binders, acids or bases causing low or high pH), and only if not treated in a WWTP before emission to the water recipient. Most of them have been assessed in Larsen et al. (1995, 1998, 2000 and 2002) and Nielsen et al. (2000) for potential effects if emitted to WWTP or directly to water recipient on the basis of hazard assessments and/or generic risk assessments.
Known emissions from the production stage, which are not covered by characterisation factors, and which may contribute significantly to the toxicity impact categories, include emissions of components occurring in small quantities in the raw materials (typically well below 5%) like siccatives (organic metal compounds), softeners (phthalates), antioxidants (aromatics) and “wetteners” (surfactants). Due to lack of readily available knowledge of their exact identity and/or lack of readily available data on their inherent environmental properties it has not been possible to include them in this study.
From the material and the disposal stage, known emissions, which are not covered by characterisation factors but which may contribute significantly to the toxicity impact categories, include, for example, emissions of unspecified metals, AOX, unspecified oil and unspecified detergents.
3.2.1 New characterisation factors for ecotoxicity
Some of the substances emitted at the production stage are known to be very toxic and for others, the combination of moderate toxicity combined with a relatively large emitted amount may lead to significant contributions to potential impact. For some of these substances, characterisation factors did not exist in advance. Where relevant substance data have been available, characterisation factors have been calculated to fill this gap. As a special case, accumulated upstream characterisation factors representing the ecotoxicity of the total emissions to air, water and soil per gram produced from the production of the two pigments Pigment Yellow 14 and Pigment Blue 15, have been included (Andersen & Nikolajsen 2003). All the new characterisation factors made for this study are shown in Table 16.
Table 16. Characterisation factors estimated in this study and accumulated characterisation factors for pigments upstream.
| CAS No. | Substance name | Characterisation factors (equivalency factors) (m³/g) | ||||||
| Emissions to water | Emissions to soil | Emissions to air | ||||||
| EF(etwa)w | EF(etwc)w | EF(etsc)w | EF(etwc)s | EF(etsc)s | EF(etwc)a | EF(etsc)a | ||
| 147-14-8 | Pigment Blue 15 * | 1 | 1 | 0 | 0 | 0.000000033 | 0 | 0 |
| 2682-20-4 | 2-Methyl-4-isothiazolin-3-one (MI) * | 200 | 1000 | 0 | 0 | 2070 | 0 | 0 |
| 26172-55-4 | 5-Chloro-2-Methyl-4-isothiazolin-3-one (CMI)* | 455 | 4480 | 0 | 0 | 2560 | 0 | 0 |
| 123-31-9 | Hydroquinone* | 227 | 728 | 0 | 0 | 54.3 | 0 | 0 |
| 141-43-5 | 2-Aminoethanol* | 0.667 | 1.33 | 0 | 0 | 3.16 | 0 | 0 |
| 56-81-5 | Glycerol* | 0.000185 | 0.00037 | 0 | 0 | 0.00086 | 0 | 0 |
| 28519-02-0 | Benzenesulfonic acid, dodecyl (sulfophenoxy)-, disodium salt* | 62.5 | 1160 | 0 | 0 | 0.0203 | 0 | 0 |
| 52-51-7 | 2-Bromo-2- nitropropane -1,3-diol (Bronopol)* |
27 | 135 | 0 | 0 | 314 | 27 | 251 |
| 79-07-2 | 2-Chloro- acetamide* |
179 | 357 | 0 | 0 | 500 | 71.4 | 400 |
| 5468-75-7 | Pigment Yellow 14 (u.s.)# | 5.03 | 9.26 | 2.76 | - | - | - | - |
| 147-14-8 | Pigment Blue 15 (u.s.)# | 5.31 | 10.4 | 1.29 | - | - | - | - |
* Calculation of characterisation factors based on data from PhysProp (2004), ECOTOX (2004), ChemFate (2004), IUCLID (2000), Madsen et al. (2001), CERI (2004), Mackay et al. (2000), US-EPA (2004) and in some cases also including QSAR estimations on basis of EPIwin (2000).
# Accumulated upstream characterisation factors, i.e. summing up all potential impact from water, air and soil emission from the production process (synthesis) of the pigments (Andersen & Nikolajsen 2003).
As is evident from the characterisation factors in Table 16, the difference between the potential impacts differs widely between the substance emissions which have been included from the production stage. The relative difference between potential acute aquatic impact for substances with the least potential (represented by glycerol) and those with the highest (represented by CMI) is at the level of a factor 106. So to obtain the same potential impact for an emission of CMI and of glycerol, glycerol has to be emitted in a quantity that is more than a million times higher than the quantity of CMI.
The accumulated upstream characterisation factors for Pigment Blue 15 and Yellow 14 in Table 16 are not related directly to emissions, i.e. they are not to be multiplied by an emitted amount, as is the case for the other characterisation factors. Instead these accumulated characterisation factors are expressed per gram produced of the two pigments. The factors must therefore be multiplied by the consumption of the relevant pigments at the production stage (model printing company). The result represents the potential impact from the emissions during the production of the pigments (material stage). The emissions scenarios on which these upstream characterisation factors are based are taken from the EC Technical Guidance Document (TGD) on risk assessment (EC 2002). This kind of scenario is used for first tier risk assessment/screening and may therefore be conservative. However, Andersen & Nikolajsen (2003) have consistently used the lowest among the proposed values for emitted fraction in every case (produced amount > 2000 ton, assuming WWTP at the production facilities). The size of the characterisation factor for Pigment Yellow upstream is mainly determined by emission of 3,3-dichlorobenzidine and 2-chloroaniline during the synthesis of the pigment. For Pigment Blue 15 upstream, the main contributing emission is cuprous chloride (Andersen & Nikolajsen 2003).
3.3 Results of impact assessment: Reference scenario
The total inventory results divided into air emissions, water emissions, waste, and resources and materials are shown in Annex C. After classification and characterisation, these data can be presented as category indicator results as shown in Table 17.
Table 17. Category indicator results for the reference scenario
| Name | Amount | Unit |
| Global warming | 1,350,000 | g CO2-equiv. |
| Ozone depletion | 0.0000106 | g CFC11-equiv. |
| Acidification | 4,000 | g SO2- equiv. |
| Photochemical ozone formation | 1,560 | g C2H4- equiv. |
| Nutrient enrichment | 5,390 | g NO3- equiv. |
| Human TOX, water | 1,540 | m³ water |
| Human TOX, air | 38,800,000 | m³ air |
| Human TOX, soil | 20.4 | m³ soil |
| EcoTOX, water, chronic | 133,000 | m³ water |
| EcoTOX, water, acute | 17,700 | m³ water |
| EcoTOX, soil | 4,940 | m³ soil |
| Bulk waste | 50,800 | g |
| Hazardous waste | 1,830 | g |
| Radioactive waste | 1.99 | g |
| Slags and ashes | 7,270 | g |
| Primary energy, material | 7,360 | MJ |
| Primary energy, process | 29,600 | MJ |
| Al (aluminium) | 317 | g |
| Lignite | 4,390 | g |
| Chalk (CaCO3) | 64,600 | g |
| Cr (chromium) | 20.3 | g |
| Cu (copper) | 9.42 | g |
| Fe (iron) | 216 | g |
| Ground water | 1,470,000 | g |
| Quartz | 196 | g |
| Clay | 0.931 | g |
| Mn (manganese) | 3.74 | g |
| Sodium chloride (NaCl) | 15,600 | g |
| Natural gas | 306,000 | g |
| Ni (nickel) | 8.68 | g |
| Dammed water | 14,300,000 | g |
| Surface water | 30,100 | g |
| Crude oil | 125,000 | g |
| Anthracite | 7,240 | g |
| Wood (soft) DS | 941,000 | g |
| Wood (hard) DS | 0.183 | g |
| U (Uranium) | 1.57 | g |
| Unspec. Fuel | -1,340 | MJ |
| Unspec. water | 46,000,000 | g |
| Zn (zinc) | 0.151 | g |
| Hydrogen | 3.69 | g |
| Unspec. biomass | 425 | g |
| Kaolin | 258,000 | g |
| Bentonite | 23.4 | g |
| Ag (silver) | 56.3 | g |
The category indicator results shown in Table 17 for the energy related impact categories (global warming, acidification and nutrient enrichment) are mainly due to emission appearing during energy production, especially for production of paper, but also from energy consumption at the model printing company. For the global warming potential, 72% is thus related to the paper production whereas 26% is related to the production stage (model printing company). If energy recovery from incineration and recycling of paper is allocated to the paper production, the figures change to 57% contribution to global warming from paper production and 39% contribution from energy consumption at the model printing company.
The category indicator result for stratospheric ozone depletion is dominated by emissions from energy production but insignificant.
The two main contributors to photochemical ozone formation are emissions of IPA and hexane from the production stage contributing with 45% and 19% respectively. The rest is dominated by the contribution from energy production-related VOC emissions.
The category indicator result for acute ecotoxicity in water is dominated by contributions from emissions of tetradecane (printing and cleaning at the production stage) and contribution from emissions of synthesis chemicals (e.g. 3,3-dichlorobenzidine) at the synthesis of pigments (material stage) contributing with 52% and 29% respectively. Emission of strontium related to energy production (especially for production of paper, heavy fuel oil for production of pulp) accounts for 10% and emission of biocides at the production stage accounts for about 5% (CMI dominating).
For chronic ecotoxicity in water, the main contributors include emissions of hexane occurring at the production stage (cleaning process) and emission of strontium related to the energy production. These two substances contribute 66% and 13% respectively. Contribution from emissions during the synthesis of pigments accounts for about 7% and emissions of biocides at the production stage about 6%.
The contributors to the category indicator for chronic ecotoxicity in soil are dominated by emissions during pigment synthesis, and emission of IPA and hexane during the printing process contributing with 39%, 32% and 29% respectively.
The emissions contributing most to human toxicity via air are energy production-related emissions, i.e. nitrogen oxides, NOx (69%) and sulphur dioxide (7%). Furthermore, emission of benzene related to the use “ekstraktions benzin” for cleaning at the production stage contributes about 10%, and emission of lead related to energy production 7%.
For chronic human toxicity via water, a lot of different emissions contribute. For example emissions of metals related to energy production, e.g. emission of mercury related to combustion of fuel oil contributes 26%. Also emissions from the production stage contribute, e.g. emission of hexane used in the cleaning process contributes 13%.
The category indicator result for chronic human toxicity via soil is dominated by contributions from emissions of IPA (47%) and benzene (24%) from the production process, i.e. printing and cleaning respectively. Energy related emissions also contribute, e.g. emission of vanadium with 5%.
The resource, which is consumed in highest amounts, is water (dam water, unspecified water and ground water) accounting for more than 50 tons of water per functional unit. The main part of the water is used for paper production directly (73%) and dam water for energy production about 22%. The second highest consumption is found for the group of energy carriers comprising natural gas, oil and wood accounting for about 1.4 tons per functional unit. The resource kaolin used as filler in the production of paper accounts for the third highest consumption, i.e. about 0.35 ton per functional unit.
3.3.1 Normalized reference scenario
The normalized LCA-profiles for the reference scenario are shown below and divided into profiles on potential environmental impact and profiles on resource consumption.
3.3.1.1 Potential environmental impact
In Figure 2 the results of the impact assessment of the reference scenario are shown as normalized values divided into the steps at the model printing company. Impacts related to energy consumption at the model printing company, water consumption at the model printing company, incineration of printed matter/paper waste, recovery due to recycling/incineration of paper, and paper production are isolated and shown separately. Avoided potential impacts due to recycling and incineration of paper are shown as negative values.
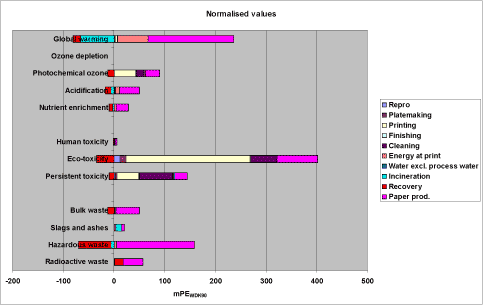
Figure 2. Normalized LCA profile for the reference scenario
As is evident from Figure 2 the dominating potential impact expressed in milliperson equivalents (mPE) is acute ecotoxicity accounting for about 400 mPE. For this category, the printing process accounts for more than half, i.e. about 240 mPE, and paper production contributes 80 mPE. In the same category cleaning contributes 51 mPE, plate making and repro 12 mPE each, whereas finishing and energy consumption at the model printing company only account for 1,4 mPE and 0.033 mPE respectively. Furthermore, recovery of paper contributes -35 mPE for the category for acute ecotoxicity due to avoided emissions from avoided paper production based on virgin fibres. For human toxicity (acute), the only contributions above 1 mPE come from paper production (3.5 mPE) and energy consumption at the model printing company (1.1 mPE). For persistent toxicity the main contributor is cleaning with about 66 mPE followed by printing (43 mPE) and paper production (24 mPE). For this impact category, plate making and repro only account for 4 mPE and 2 mPE respectively, and incineration of paper and energy consumption at the model printing company account for 2.6 mPE and 2.0 mPE respectively. Finishing only contributes 0.60 mPE and recovery of paper contributes -10 mPE.
The normalized global warming potential in Figure 2 accounts for almost 240 mPE, and paper production dominates this impact category with about 170 mPE, while energy used at the model printing company contributes 60 mPE. Printing, repro and plate making contributes 3.9 mPE, 1.5 mPE and 0.83 mPE respectively whereas finishing and cleaning only account for 0.62 mPE and 0.41 mPE. For global warming, incineration and recycling of paper save emissions equivalent to contributions of -66 mPE and -15 mPE respectively.
The normalised results for the impact category photochemical ozone formation in Figure 2 are dominated by printing, paper production and cleaning, contributing 42 mPE, 28 mPE and 15 mPE respectively. Energy consumption at the model printing company contributes 2.6 mPE whereas the contribution from repro, plate making, finishing and incineration of paper all lie below 1 mPE. Recycling of paper accounts for -12 mPE photochemical ozone formations.
Both normalized results for nutrient enrichment and acidification in Figure 2 are dominated by contributions from paper production and energy consumption at the model printing company. For nutrient enrichment, the contributions are 24 mPE (paper production) and 3.5 mPE (energy consumption), and for acidification 38 mPE (paper production) and 8.7 (energy consumption). All the other process steps at the model printing company contribute less than 1 mPE, except for printing, contributing 1.0 mPE to acidification. Contributions from incineration and recycling of paper to nutrient enrichment are -2.4 mPE and -7.9 mPE respectively and to acidification -6.0 mPE and -11 mPE respectively.
The dominating contributor to the formation of bulk waste, hazardous waste and radioactive waste is paper production, contributing 46 mPE, 154 mPE and 39 mPE respectively, see Figure 2. The only processes at the model printing company contributing more than 1 mPE are plate making and printing, and the contributions are only to the impact category for bulk waste (1.3 mPE and 1.2 mPE respectively). Incineration and recycling of paper contribute to bulk waste with -0.12 mPE and -12 mPE respectively, to hazardous waste with -6.0 mPE and -64 mPE respectively, and to radioactive waste with -0.45 mPE and 17 mPE. For the impact category for slag and ashes, only paper production (5.8 mPE), incineration (11 mPE) and energy consumption at the model printing company (2.5 mPE) contribute more than 1 mPE, see Figure 2.
The contributions from water consumption excluding process water, and ozone depletion in Figure 2 are not visible and insignificant. Water consumption excluding process water comprises the total water consumption per functional unit at the model printing company minus the water consumption in the repro, plate making, printing and cleaning process (i.e. the process water). Total water consumption is about 1200 litres per functional unit, and the process water consumption about 100 litres per functional unit. The contribution from the consumption of process water at the model printing company is thus also insignificant.
In order to illustrate the importance of paper for the normalised LCA profile of the reference scenario, a comparison of the total profile and a profile with paper excluded, i.e. paper production, recycling of paper and incineration excluded, is shown in Figure 3. For the total profile in Figure 3 (“total”) the avoided impacts (i.e. negative contributions) due to incineration and recycling of paper are allocated to paper, i.e. the paper net value is used.
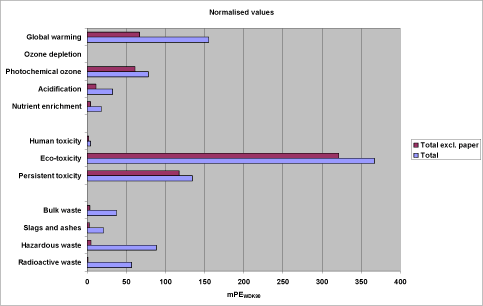
Figure 3. Normalized LCA profile of reference scenario comparing total (for paper the net value is used) with total excluding paper
Comparison of the two bar diagrams in Figure 3 reveals that about 67 mPE (43%) of the total normalized potential environmental impact for global warming is not related to the consumption of paper. Furthermore, paper plays only a minor role in the impact categories on acute ecotoxicity and persistent toxicity and contributes only moderately to photochemical ozone formation. On the other, hand paper is dominant in the categories for nutrient enrichment, acidification and the four categories for waste.
3.3.1.2 Resource consumption
The normalized profile for resource consumption is shown in Figure 4. Water and wood, which are the resources consumed in the highest amounts (see Table 17), are not included in Figure 4 because they are considered as renewable resources used at a rate which is lower than their current rate of regeneration. Chalk (CaCO3) which is used in significant amounts (see Table 17), primarily as filler during recycling of paper, is also omitted from Figure 4 due to lack of a normalisation reference and to the assumption that it is insignificant as compared to the other resource consumption when we take existing reserves into account. The same goes for sodium chloride. Also the relatively small consumption of quartz and unspecified biomass, and the very small consumption of hydrogen and clay are omitted in Figure 4 due to lack of normalisation references and assumed unimportance. When no normalisation references exist in EDIP97 (Wenzel, Hauschild and Alting 1997) for these resources, it is indeed because the reserves are enormous compared to the current rate of extraction. Their supply horizon is thus very long which results in very low weighting factors meaning that the consumption of these resources is insignificant from a resource availability point of view. Normalized consumptions of manganese, iron and zinc are not shown in Figure 4 because they are very small, i.e. 2.1 mPE, 2.2 mPE and 0.11 mPE respectively. Silver is not included here due to lack of a normalisation reference. However, silver is included in the weighting step (see Section 3.1.2.2) because a factor for the combined normalisation and weighting (1/person-reserve) exists for this resource, making normalisation and weighting possible in one step.
The normalized resource consumptions shown in Figure 4 are heavily dominated by consumption of kaolin during the production of paper, accounting for about 111000 mPE gross and 75300 mPE net (corrected for avoided consumption after recovery of paper). However, as pointed out by Drivsholm et al. (1997), kaolin may easily be substituted by chalk and talc for which the world consumption is several orders of magnitude higher than that of kaolin, e.g. world consumption of talc is a factor of 330 higher than that of kaolin (Drivsholm et al, 1996). So if the filler kaolin is substituted by talc and/or chalk the normalized value will be reduces by several orders of magnitude.
The second highest normalized resource consumption is for the energy resource natural gas, accounting for around 1570 mPE gross and 988 mPE net dominated by consumption during paper production (967 mPE gross and 390 mPE net) and consumption at the model printing company (452 mPE). Recycling of paper (recovery) and energy consumption for producing raw materials for the printing step (printing) account for smaller parts, i.e. 90 mPE and 40 mPE respectively. Finally, consumption of natural gas for producing raw materials for repro, plate making, cleaning and finishing only accounts for minor amounts, i.e. 2.25 mPE, 3.34 mPE, 2.21 mPE and 6.25 mPE respectively, and consumption for producing water excl. process water is negligible (0.07 mPE).
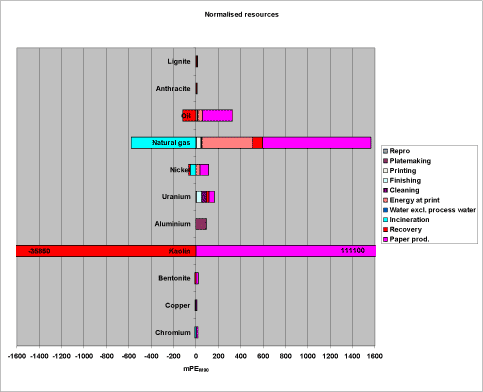
Figure 4. Normalized profile for resource consumption
The normalized consumption of oil is third in size and accounts for 327 mPE gross and 212 mPE net. The highest consumption is during paper production accounting for 270-mPE gross and 155 mPE net. Oil consumption for energy production at the model printing company accounts for 38.6 mPE and consumption for producing raw materials for repro, plate making, cleaning and finishing accounts for 1.29 mPE, 0.958 mPE, 3.36 mPE and 2.75 mPE respectively. Consumption for producing water excl. process water is negligible (0.00002 mPE).
For uranium, the normalized consumption accounts for 166 mPE gross and 165 mPE net. The main consumptions are in the paper production (48.9 mPE gross and 47.9 mPE net), finishing (44.7 mPE) and cleaning (44.0 mPE). Recycling of paper (recovery) and plate making accounts for 21.0 mPE and 4.54 mPE whereas repro, printing, energy at print and water excl. process water all account for less than 1 mPE.
The normalized consumption of the two last energy resources, i.e. anthracite and lignite, are very small compared to the results for natural gas and oil. Consumption of anthracite only accounts for 13.1 mPE gross (12.7 mPE net) and lignite only 17.6 mPE both gross and net. For both, the main consumption is for energy production during paper production and recycling of paper (recovery) accounting for 4.64 mPE and 4.64 mPE respectively for anthracite and 6.77 mPE and 7.60 mPE respectively for lignite. The process steps at the model printing company, energy consumption at the model printing company and water consumption except process water all account for less than 1 mPE except for plate making, accounting for 2.52 mPE (lignite), printing 1.18 mPE (anthracite) and finishing 1.14 mPE (anthracite).
For the consumption of the heavy metals nickel, chromium and copper, the normalised consumptions account for 114 mPE gross (48.2 mPE net), 19.7 mPE gross (8.37 mPE net) and 11.3 mPE gross (5.54 mPE net) respectively. The main consumptions of nickel are in the paper production (76.8 mPE gross, 11.4 mPE net) and the energy consumption at the model printing company (35.2 mPE). All other consumptions are below 1 mPE except for printing, consuming 1.52 mPE. For chromium, the picture is almost the same as for nickel, i.e. main consumptions are in paper production (13.3 mPE gross, 1.96 mPE net) and the energy consumption at the model printing company (6.10 mPE), but in this case all other consumptions are below 0.1 mPE except for printing consuming 0.263 mPE. Consumption of copper is slightly different than the consumption of nickel and chromium. The main consumptions are in paper production (6.83 mPE gross, 1.02 mPE net) and the energy consumption at the model printing company (3.13 mPE) but consumption in plate making is 1.25 mPE and in printing 0.135 mPE. All other consumptions of copper are below 0.01 mPE. This almost identical picture for consumption of nickel, chromium and copper illustrates that consumption of these heavy metals is highly connected to energy production.
The normalized consumption of bentonite is only significant for paper production accounting for 33.8-mPE gross and 13.1 mPE net.
In Figure 5, a normalized resource consumption profile is shown where paper (production, recycling and incineration) is excluded, making the resource consumption of the other processes more visible.
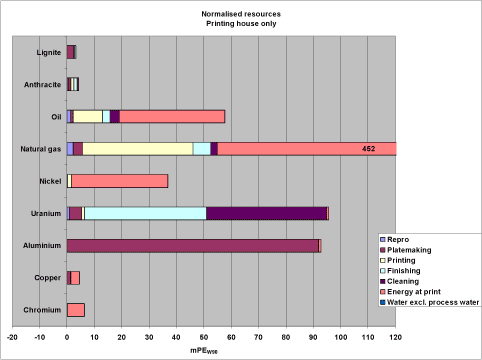
Figure 5. Normalized profile for resource consumption excluding paper
3.3.2 Weighted reference scenario
The weighted LCA-profiles for the reference scenario are shown below and divided into profiles on potential environmental impact and profiles on resource consumption.
3.3.2.1 Potential environmental impact
A profile for the weighted reference scenario is shown in Figure 6. By weighting the normalised LCA profile for the reference scenario, the dominating role of the chemical related impact categories is further strengthened. When compared to the normalized profile (see Figure 2), the main difference is that the dominant impact category for acute ecotoxicity is a factor of 2.3 higher (weighting factor, WF = 2.3) and for persistent toxicity a factor of 2.5 higher making this impact category the second highest in the weighted profile. Even though the normalized potential impact for human toxicity is multiplied by a WF of 2.8 during weighting, this impact category remains of minor importance in Figure 6. The normalized potential impact for global warming and acidification are both only multiplied by WF of 1.3 and for photochemical ozone formation and nutrient enrichment by a WF of 1.2 during the weighting process, and therefore these impact categories only undergo minor increments.
The impact categories for waste are all only multiplied by a WF of 1.1 and therefore only increase 10% when the normalized values are weighted. Even though the normalized potential impact from ozone depletion is multiplied by a WF of 23 during weighting, this impact category remains insignificant.
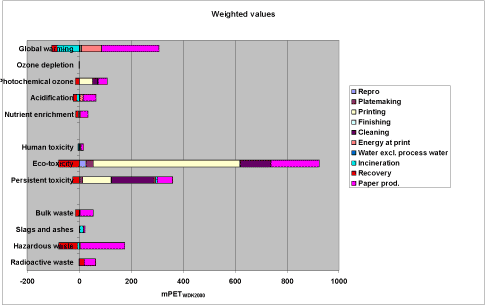
Figure 6. Weighted profile for reference scenario
By weighting we have the opportunity to aggregate all the environmental impact category indicator results in Figure 6 by summing them into one common impact score as mentioned in Section 3.1.4. By doing that we arrive at the summed profile for one functional unit expressed in units of weighted (targeted) milliperson equivalents (mPET) as shown for the individual processes in Figure 7.
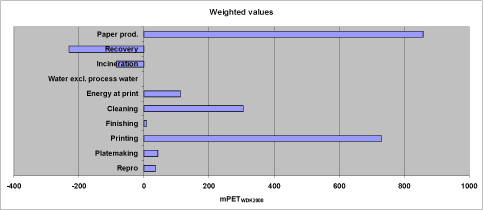
Figure 7. Aggregated weighted LCA profile for the reference scenario
Instead of showing the aggregated profile in absolute values as in Figure 7 we may use relative values as shown in Figure 8.
The results in Figures 7 and 8 show that for the aggregated weighted potential environmental impact (termed “aggregated impact” further on in this report), the production of paper is dominant with a contribution of 48% (gross) of the total whereas printing contributes 41%. Cleaning is third highest with a contribution of 17% and energy consumption at the model printing company, plate making and repro contributes 6%, 2% and 2% respectively. Finishing only contributes with 0.4% and water exclusive of process water only 0.001% (excluded in the further assessment).
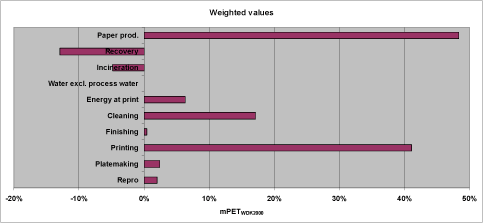
Figure 8. Aggregated weighted LCA profile for the reference scenario in relative figures.
Recycling of paper (recovery) and incineration contribute -13% and -5% respectively of the total in Figures 7 and 8. If we allocate these negative contributions to paper production (avoided emissions due to avoided paper production and avoided incineration of natural gas), we arrive at the profile shown in Figure 9. This profile shows that if paper is recycled at the rate defined by the reference scenario (53%), and the rest incinerated and the heat utilised, the paper production (total paper net value) only accounts for 31%, whereas the printing process now accounts for 41% of the aggregated impact. Cleaning and energy for print now account for 17% and 6% respectively, whereas plate making, repro and finishing account for 2%, 2% and 0.4% respectively.
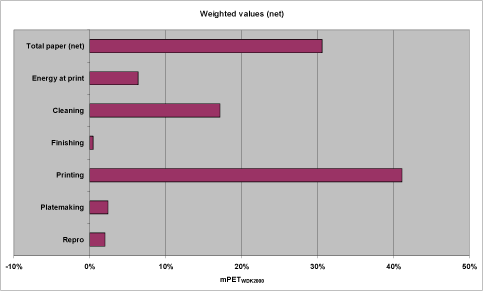
Figure 9. Aggregated weighted LCA profile for the reference scenario in relative figures and with total paper as net value.
Besides production of paper, the production of printing ink, which is another upstream production process in the life cycle of sheet fed offset printed matter, also contributes significantly to the aggregated impact. In Figure 10, ink production is isolated from the printing process and shown as a separate activity. As is evident from Figure 10 ink production contributes around 17%.
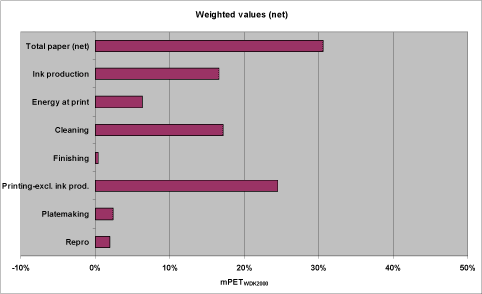
Figure 10. Aggregated weighted LCA profile for the reference scenario with ink production as separate category.
The reason for looking separately at paper here is its relatively dominant position. However it may be argued that paper is part of the printing process and should be allocated to printing as all the other raw materials are allocated to the corresponding process steps at the model printing company. If we do that, the printing process accounts for 72% of the aggregated impact. This leaves us with the total energy consumption at the model printing company (energy at print) as the only category in Figure 9 not distributed to the different process steps at the model printing company. If we assume that all energy consumption except electricity is used for heating and we use the energy data from Table 12 (Section 2.2) and the emission data on global warming (CO2-eqv. emission) from the LCV database (Miljøstyrelsen 1999) it may be estimated that about 20% of the potential global warming from the energy consumption at the model printing company is related to heating. For the consumption of electricity it may be assumed on the basis of general data for the printing industry, i.e. not only offset (GA/DDF 2002), that illumination accounts for 15%, ventilation 20%, electronic equipment (computers etc.) 15% and other electric motors 35%. The rest is distributed among refrigeration (5%), compressed air (5%), heating (4%) and pumps (1%). As global warming is a dominant impact category for energy production, we may assume that it can serve as an indicator for the total potential impact in this case. If we further assume as a very rough estimate, that contributions from “other electric motors” can be allocated to the printing process (primarily printing machines etc.), that contributions from “electronic equipment” can be allocated to the repro process (dominated by electronic equipment), and that all other contributions can be allocated evenly to the five process steps at the model printing company we end up with a profile as shown in Table 18
Table 18. Relative contribution to the total aggregated weighted potential environmental impact from the different process steps at the model printing company (in percentage of total)
| Process step at model printing company | Relative contribution to the aggregated impact (%) |
| Repro | 4 |
| Plate making | 3 |
| Printing | 74 |
| Cleaning | 18 |
| Finishing | 1 |
3.3.2.2 Resource consumption
A weighted profile for resource consumption of the reference scenario is shown in Figure 11. If we compare this profile with the normalized profile (see Figure 4) we notice that consumption of kaolin is still dominant (141 mPR gross and 95.5 mPR net) but consumption of natural gas has gained importance in comparison to consumption of kaolin (25.0 mPR gross and 15.8 mPR net). This is also the case for oil (7.52 mPR gross and 4.87 mPR net) and uranium (3.03 mPR gross and 3.01 mPR net). The weighted consumptions of lignite (0.0457 mPR gross and net) and anthracite (0.0762 mPR gross and 0.0736 mPR net), though both still very small, have also become a bit more important as compared to their importance in the normalized profile. After weighting the consumption of bentonite (0.0262 mPR net) is still very small as when normalized, see Figure 11 and 4.
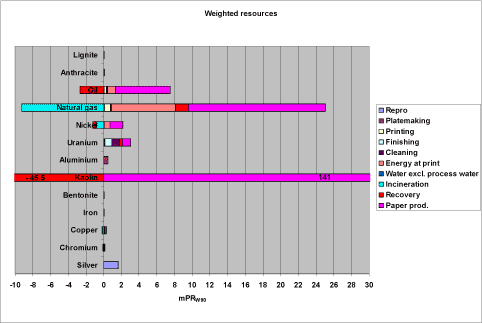
Figure 11. Weighted profile for resource consumption
The weighting factors for the metals nickel, aluminium, copper and chromium are all a bit higher (a factor of 4 – 22) than that of kaolin, and these metals therefore gain importance in the weighted profile, see Figure 11. Weighted consumption of nickel is highest with 2.16 mPR gross and 0.916 mPR net whereas aluminium accounts for 0.475 mPR. Copper and chromium only account for 0.318 mPR gross (0.155 mPR net) and 0.121 mPR gross (0.0512 mPR net). Iron only accounts for 0.0326 mPR gross (0.0184 mPR net).
As mentioned in Section 3.3.1.2 it is not possible to express consumption of silver as a normalized value, only as a weighted value as shown in Figure 11. Weighted consumption of silver accounts for 1.66 mPR.
In Figure 12, a weighted resource consumption profile is shown, where paper (production, recycling and incineration) is excluded, making the resource consumption of the other processes more visible.
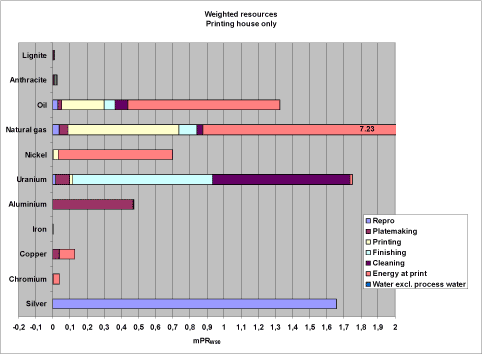
Figure 12. Weighted profile for resource consumption excluding paper
If we aggregate all the weighted resource consumptions in Figure 11 by summing them into one common resource consumption score, we arrive at the profile shown in Figure 13. Furthermore, if we express this aggregated profile in relative values instead of absolute values, we find the profile shown in Figure 14 and if paper is expressed in net values (total paper net) the profile shown in Figure 15.
As is evident from Figures 13, 14 and 15, production of paper is the overall dominating factor accounting for 135% gross and 88% net of the total aggregated weighted resource consumption. The second highest is energy consumption at the model printing company accounting for 7%, whereas all the other categories only account for 1%, see Figure 15.
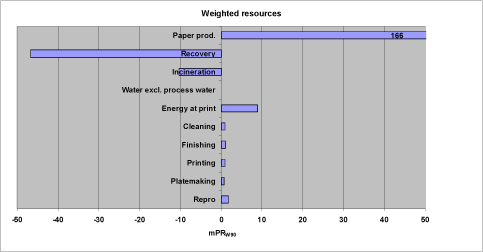
Figure 13. Aggregated weighted resource profile for the reference scenario
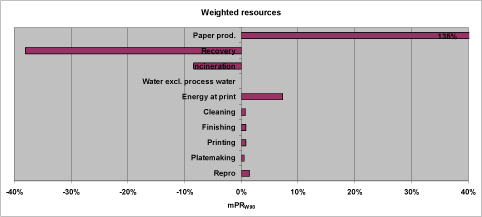
Figure 14. Aggregated weighted resource profile for the reference scenario in relative figures.
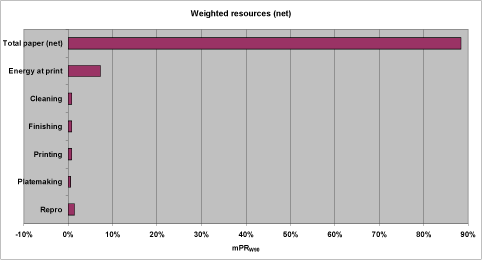
Figure 15. Aggregated weighted resource profile for the reference scenario in relative figures and with total paper as net value.
As pointed out in Section 3.3.1.2, kaolin may be substituted by talc and/or chalk for which the world consumption is several orders of magnitude higher and the supply horizon at the same level (Drivsholm et al. 1997). We may therefore present the aggregated weighted resource profile without kaolin as shown in Figure 16. In this case the paper production share of the total aggregated weighted resource consumption is reduced to 48% whereas energy consumption at the model printing company now accounts for 33%. Repro accounts for 6% and finishing and printing account for 4% each. Cleaning and plate making account for 3% and 2% respectively.
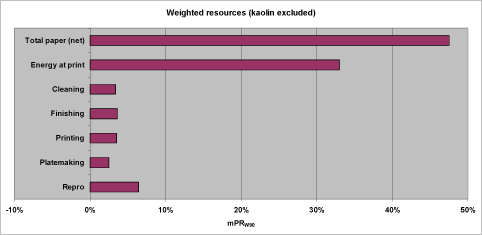
Figure 16. Aggregated weighted resource profile for the reference scenario in relative figures and with total paper as net value and kaolin excluded.
If we exclude paper totally we arrive at the profile shown in Figure 17. Now energy for print accounts for 63% of the total aggregated weighted resource consumption and repro accounts for 12%. Finishing and printing account for 7% each and cleaning and plate making for 6% and 5% respectively.
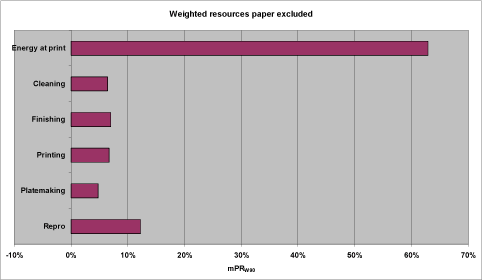
Figure 17. Aggregated weighted resource profile for the reference scenario in relative figures and with paper excluded.
3.4 Results of impact assessment: Average energy (scenario 1)
As mentioned in Section 2.4.1, the purpose of making a scenario based on average energy is to make it possible to compare the main results of our study with a previous LCA study of offset printed matter. The comparison is described below in Section 3.4.1.
The normalized profiles for scenario 1 are shown in Figures 18 and 19.
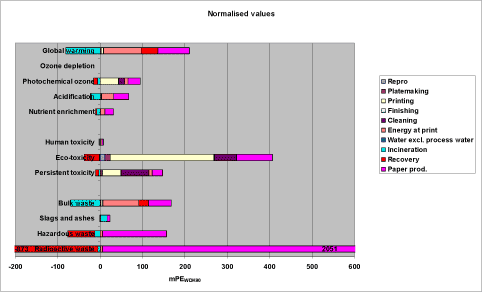
Figure 18. Normalized LCA profile for the scenario 1 (average energy based)
If we compare the environmental impact profile of scenario 1 in Figure 18 with the corresponding for the reference scenario (Figure 2) the main difference is the overall dominating role of radioactive waste in the profile for scenario 1, which is only of moderate significance in the reference scenario. Furthermore, bulk waste is about twice as large in scenario 1 as compared to the reference scenario.
These effects on the LCA profile due to the differences in energy scenario used (average instead of marginal) are also reflected in the resource profile shown in Figure 19. If we compare with Figure 4, the main differences are that consumption of uranium is now second most important, anthracite third most important (gross value) and natural gas only fourth most important.
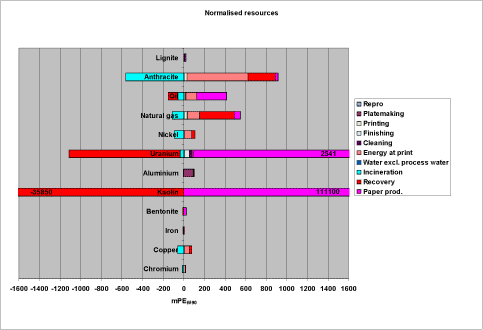
Figure 19. Normalized profile for resource consumption for scenario 1
3.4.1 Comparison with other LCA studies on printed matter
One of the LCA studies on offset printed matter (Drivsholm et al. 1996, 1997), which was mentioned in the Introduction, was performed using the same LCA methodology as this study, making a comparison meaningful. The goal of the study by Drivsholm and colleagues was among other things to create LCA profiles for three types of printed matter, i.e. a newspaper (cold-set), a weekly magazine (publication gravure) and a commercial (heat-set), and to identify the most important emissions and resource consumptions with the aim of identifying areas of intervention for reduction of potential environmental impact and resource depletion. Two of the products included are produced by use of offset technique but none by sheet fed offset. In the study by Drivsholm and colleagues, repro is excluded, and transport is fully included as an integrated part. The electricity scenario used by Drivsholm and colleagues is average (Swedish average for paper production) and for the comparison with this study, scenario 1 is therefore used.
In Figure 20 and Figure 21 the normalized profiles for scenario 1 are compared with the normalized profiles of the newspaper and the commercial. In all cases, the same type of overall functional unit is used (i.e. per tons product) and the same normalisation references are used.
Despite the fact that different types of offset printing techniques are used for cold set (rotation), heat-set (rotation, heat drying) and sheet fed offset (sheets), and to a certain degree different raw materials, e.g. paper for cold set (newspaper) contains wood fibres (i.e. produced from mechanical pulp) as opposed to graphic paper (white paper based on chemical pulp with a higher energy demand) included in the two other techniques, the difference between the profiles is not very large (see Figure 20 and Figure 21) with some exceptions commented on below.
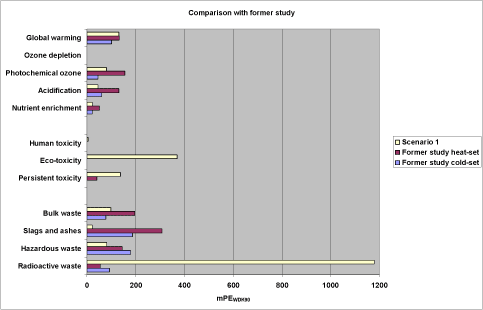
Fig. 20. Comparison of scenario 1 with a previous study by Drivsholm et al. (1996, 1997) on a newspaper (previous study cold-set) and a commercial (previous study heat-set).
As can be seen in Figure 20, the result of this study is at the same level for the energy related impact categories as the results from the previous study by Drivsholm et al. (1996, 1997) based on specific data from two specific Danish printing companies. The observed differences are probably mainly due to differences in the total energy consumption (primary energy, process) used per tons produced printed matter (energy consumption for producing thermo mechanical pulp (TMP) used for newspapers is lower than for producing sulphate pulp (INFRAS 1998) used for sheet fed offset paper). Furthermore, as indicated in Figure 21 there seem to be differences in, for example, the site specific energy scenarios used for the model printing company etc. (anthracite and natural gas instead of lignite and oil). The total energy consumption for the commercial is 43 GJ/ton and for the newspaper 33 GJ/ton (Drivsholm et al. 1996), whereas for scenario 1 it is 34 GJ/ton. Furthermore, as indicated in Figure 21, the energy resources for the newspaper and the commercial are dominated by anthracite, oil and natural gas in descending order, whereas scenario 1 is dominated by oil, lignite and anthracite in descending order.
The reason why photochemical ozone formation from the previous study on a commercial (heat-set) is about twice as high as that of scenario 1 is probably mainly that a much higher (factor 5) VOC emission per ton produced paper is assumed (data from a specific paper mill) which is partly compensated for by a higher VOC emission during printing and cleaning in scenario 1.
For bulk waste and hazardous waste, the results of the impact assessments for scenario 1 and the former study by Drivsholm et al. (1996, 1997) are at the same level as shown in Figure 20. However, the huge difference between the results on slag and ashes cannot be explained by differences in energy consumption or differences in overall energy scenario used but must be due to differences in the data used, i.e. amount of waste created per unit of energy produced.
The huge difference between the amounts of radioactive waste created per tons printed matter as depicted in Figure 20 is, as can be seen from Figure 21, not due to big differences in the amount of uranium used. The reason is a large difference in the data used for the amount of radioactive waste created for every unit of uranium used.
Only in the previous study on heat-set are chemical emissions included, and only a single one, i.e. IPA. The effect of including chemical emissions to a much higher degree and thereby taking impact categories for human toxicity and ecotoxicity into account (as in this study) is evident from the comparison shown in Figure 20 (persistent toxicity and especially ecotoxicity).
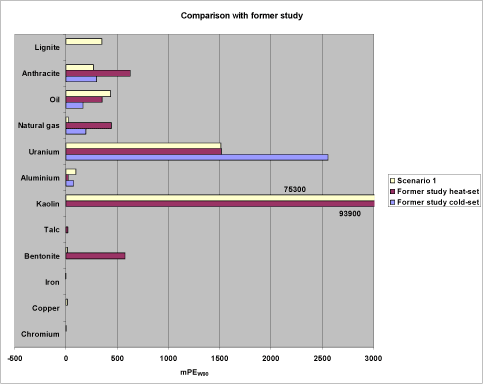
Fig. 21. Comparison of scenario 1 with a previous study by Drivsholm et al. (1996, 1997) on a newspaper (previous study cold-set) and a commercial (previous study heat-set).
The comparison in Figure 21 regarding the energy related resources is commented upon above. For the filler material kaolin, the consumption for one ton of commercials is at the same level as the consumption for one ton of product in scenario 1 (kaolin is not used in paper for newspaper production). However, consumption of bentonite is about a factor of 40 higher for the commercial than for the generic sheet fed printed matter in scenario 1. This may be due to differences in the filler combination used in the two studies and the fact that surface treatment of paper is not included in scenario 1.
For the metals, aluminium consumption is at the same level in the three cases (see Figure 21). Copper is 15 mPE for scenario 1 and zero for both the newspaper and the commercial. Iron and chromium are below 4 mPE in scenario 1 and also zero for both the newspaper and the commercial.
3.5 Results of impact assessment: Saturated paper market (scenario 2)
The result of comparing the reference scenario with a scenario where it is assumed that the paper market is saturated, and that the generic printed matter is produced on the basis of recycled paper exclusively, is shown in Figure 22. Increase in the normalized potential environmental impact is indicated in all impact categories, except for radioactive waste and “slag and ashes”, when changing the paper raw material from virgin to recycled. The main reason for the higher contributions from these two waste categories is that an average Danish energy scenario is used for recycling (not marginal and including different sources, e.g. nuclear energy and anthracite based energy) while for virgin paper production, natural gas based energy is used (marginal).
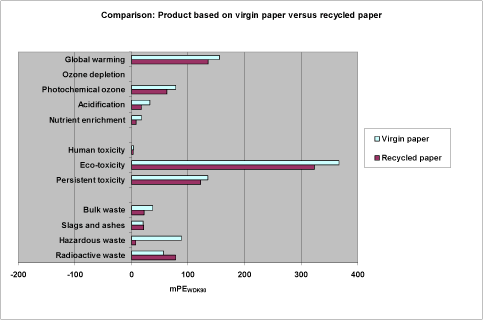
Fig. 22. Comparison of the normalized LCA profiles for the generic printed matter produced by use of virgin paper exclusively (reference scenario) or by use of recycled paper exclusively (scenario 2).
If the comparison illustrated in Figure 22 is expressed in aggregated impact the LCA profile for the product based on virgin paper accounts for 1780 mPET whereas the recycled paper based product accounts for 1490 mPET. In other words, these results indicate that changing the paper raw material from virgin to recycled leads to a reduction of 16% in the aggregated impact.
It should be noticed, as stressed earlier, that the world (and European) paper market today is not saturated but increasing and a demand for more paper (marginal approach) will lead to production of virgin paper. However should the demand for recycled paper decrease, leading to a collapse of the paper recycling system, the overall potential environmental impact (on a society level) will increase significantly. The comparison in Figure 22 is assuming a saturated paper market to illustrate a possible effect of a change in the paper raw material use at the model printing company if the lower potential impact from production of recycled paper (deinking pulp) is allocated to the functional unit.
3.6 Results of impact assessment: Variation in paper waste (scenario 3)
The effect of changing the paper waste amount at the model printing company from 32% to 3.3% of the total consumption is illustrated in Figure 23. In this case, the effect of reducing the paper waste (i.e. reducing the paper consumption) is a reduction in all impact categories. If expressed in aggregated impacts, the LCA profile for the product produced with 32% paper waste is 1900 mPET whereas the product produced with 3.3% paper waste accounts for 1700 mPET. So these results indicate that changing the paper waste fraction from 32% to 3.3% results in an 11% reduction in the total aggregated impact.
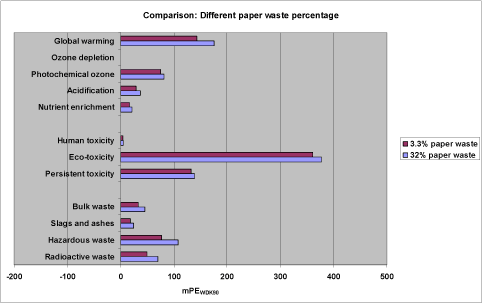
Fig. 23. Comparison of the normalized LCA profiles for the generic printed matter produced in a situation with 32% paper waste or in a situation with 3.3% paper waste.
3.7 Results of impact assessment: Variation in printing ink consumption (scenario 4)
Variation in printing ink consumption (observed: 1.8 kg/fu – 26.5 kg/fu) may to a high degree be due to variation in printing ink waste (observed: 2.4% – 45.9% of total consumption). In Figure 24, the effect on the normalized LCA profile of changing the ink consumption from 26.5 kg/fu to 1.8 kg/fu is illustrated.
As shown in Figure 24, the effect of changing the ink consumption is especially significant for the chemical related impact categories mainly due to reduced emissions at the model printing company and reduced emissions of toxic substances during the production of a reduced amount of pigments as a consequence of reduced ink consumption. A much smaller reduction in the energy related impact categories is also observed in Figure 24 connected to lower energy consumption to produce the smaller ink amount.
The consequence of reducing the ink consumption from 26.5 kg ink/fu to 1.8 kg ink/fu is a reduction from 2880 mPET to 1270 mPET when expressed in units of aggregated impact. This reduction is equal to 56%.
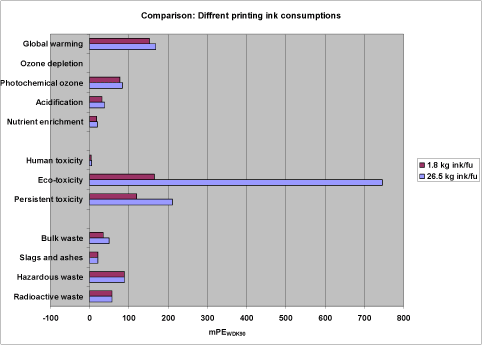
Fig. 24. Comparison of the normalized LCA profiles for the generic printed matter produced with 1.8 kg ink/fu or 26.5 kg ink/fu.
3.8 Results of impact assessment: Waste water treatment included (scenario 5)
The normalized LCA profile for a scenario where the substances emitted to the sewer by the model printing company are led to and treated in a wastewater treatment plant with biological step (WWTP) is shown in Figure 25. The fraction of each substance which is not degraded (mineralized), is emitted to either air, water or soil (i.e. via sludge used as fertilizer on arable soil) according to Table 14 in Section 2.4.5.
If we compare Figure 25 with Figure 2 (reference scenario), it is evident that the effect of the wastewater treatment is a reduction in the potential environmental impact in the chemical related impact categories – especially the impact category on ecotoxicity. In this category, printing is still dominant with 113 mPE though reduced by 54% as compared to the reference scenario. This reduction is primarily due to a 94% reduction in the amount of tetradecane emitted to water. If we disregard paper production, the second highest activity is now plate making accounting for 6.3 mPE after a 50% reduction mainly due to a 41% reduction in the water emission of Kathon. Furthermore, repro accounts for 4.3 mPE (63% reduction) primarily due to a 67% reduction in the water emission of hydroquinone, and finally cleaning is reduced to 3.1 mPE (94% reduction) mainly due to a 94% reduction in the emission of tetradecane to water.
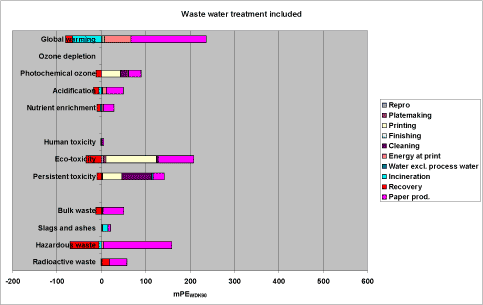
Figure 25. Normalized LCA profile for the scenario including WWTP (scenario 5).
In Figure 26 the LCA profile of scenario 5 including WWTP is compared to the reference scenario as totals within each impact category. The dominant effect on the impact category for ecotoxicity is evident. The consequence of including wastewater treatment is a reduction from 1780 mPET to 1320 mPET when expressed in units of aggregated impact. This reduction equals 26%.
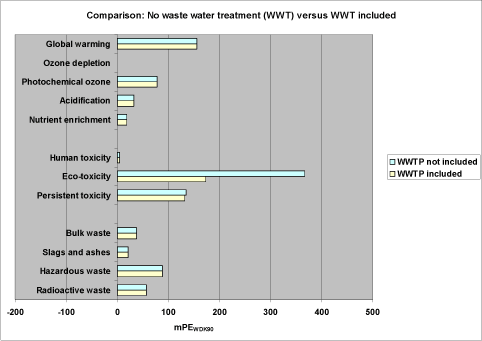
Fig. 26. Comparison of scenario 5 including WWTP with the reference scenario which is without WWTP.
If expressed in relative units (i.e. %) of the aggregated impact and divided into the different activities, the effect of including waste water treatment as compared to the reference scenario is a reduction from 41% to 32% for printing and an increase for paper from 31% to 41%. That is, the dominant position of printing is now taken over by paper as shown in Figure 27. Cleaning is reduced from 17% to 15% and energy consumption at the model printing company is increased from 6% to 9%.
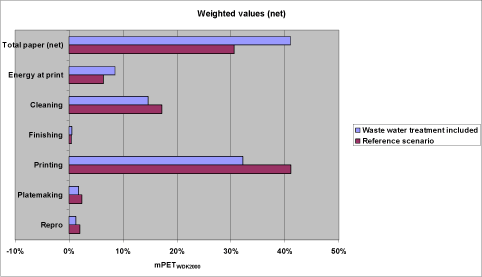
Figure 27. Comparison between the weighted LCA profile for the reference scenario and a scenario where wastewater from the model printing company is treated in a wastewater treatment plant (scenario 5). Expressed in percent share of total aggregated potential impact.
3.9 Results of impact assessment: Alternative biocide agent for rinse water (scenario 6)
To illustrate the effect of substitution of chemicals used at the model printing company on the normalized potential environmental impact scenarios with two different biocides for preservation of rinse water are compared in Figure 28. Figure 28 shows a comparison between scenario 5 described above where the biocide Kathon is used and scenario 6 where benzalkonium chloride is used as described in Section 2.4.6. For these two scenarios waste water treatment are included.
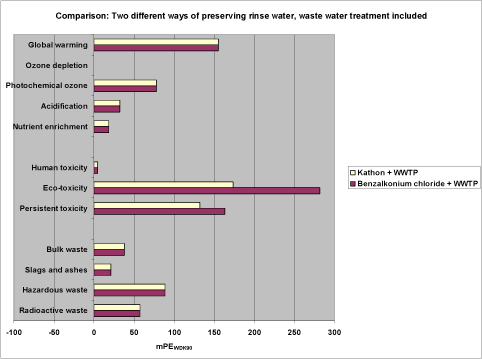
Fig. 28. Comparison of reference scenario using Kathon at recommended low dose with scenario 5 using benzalkonium chloride at recommended high dose, both for preservation of rinse water. Waste water treatment included.
The effect of substituting a recommended high dose of benzalkonium chloride with a low dose of Kathon (see Table 15 in Section 2.4.6) is evident from Figure 28. If the used rinse water is emitted to a WWTP the potential impact for the ecotoxicity impact category is reduced from 281 mPE to 173 mPE and for persistent toxicity the potential impact is reduced from 163 mPE to 132 mPE, see Figure 28. If the used rinse water is emitted directly to the water recipient the reduction is even more pronounced with a reduction from 1520 mPE to 367 mPE for ecotoxicity and 459 mPE to 135 mPE for persistent toxicity (not shown). This is due to the fact that only 10% of the benzalkonium chloride ends up in the water recipient after treatment in a WWTP whereas 59% of the treated Kathon ends up in the water recipient, see Table 14 in Section 2.4.5.
The effect of substituting benzalkonium chloride by Kathon in these scenarios including wastewater treatment is a reduction from 1680 mPET to 1320 mPET when expressed in units of aggregated impact. This reduction equals 21%. If wastewater treatment is not included the corresponding reduction is from 5740 mPET to 1780 mPET, which equals 69%.
3.10 Results of impact assessment: No waste water emitted (scenario 7)
In case no process waste water at all is emitted from the model sheet fed offset printing company, which is actually the case for some printing companies today, the normalized LCA profile becomes like the one shown in Figure 29.
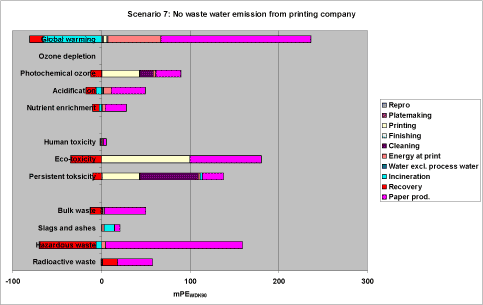
Figure 29. Normalized LCA profile for the scenario with no wastewater emission (scenario 7).
Because it is assumed that generated wastewater in this case is treated as chemical waste not contributing significantly to the impact category for hazardous waste the only significant changes are within the impact categories for ecotoxicity and persistent toxicity as shown in Figure 29. If we compare the profile in Figure 29 with the corresponding profile for the reference scenario (Figure 2, Section 3.3.1.1) and focus on the impact category for acute ecotoxicity it becomes evident that the highest reduction is within cleaning, undergoing a 99.96% reduction followed by repro and plate making both undergoing a reduction of 99.7%. Finishing (not visible in Figure 2) undergoes a 92% reduction and printing a 59% reduction. If we focus on persistent toxicity the reductions are much more moderate with the highest value of 93% for plate making followed by a 59% reduction for repro. Printing and finishing undergo a reduction of 4% each, whereas cleaning is only reduced by 0.3%. Energy consumption at the model printing company and activities outside the model printing company (e.g. paper production) are not changed.
In Figure 30 scenario 7 is compared with scenario 5 and the reference scenario. The effect of not emitting any waste water at the model printing company as compared to the reference scenario or scenario 5 (including WWTP) is a reduction from 367 mPE (reference scenario) or 173 mPE (scenario 5) to 146 mPE for acute ecotoxicity and a reduction from 135 mPE (reference scenario) or 132 mPE (scenario 5) to 128 mPE for persistent toxicity. These figures illustrate the fact that emission of wastewater from the model printing company contributes significantly to the impact category for acute ecotoxicity and to a much lesser degree to the impact category for persistent toxicity.
If expressed in units of aggregated impact, the effect of avoiding wastewater emission at the model printing company as compared to the reference scenario is a reduction from 1780 mPET to 1250 mPET and if compared to scenario 5 the reduction is from 1780 mPET to 1250 mPET. These reductions equal 30 % and 5% respectively.
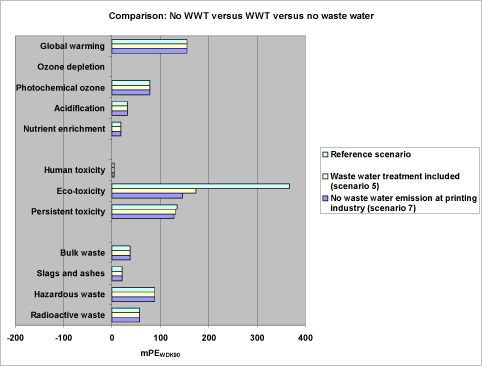
Figure 30. Comparison of a scenario with no wastewater emission at the model printing company (scenario 7) with a scenario with waste water emission and no waste water treatment (reference scenario) and with a scenario with waste water emission and waste water treatment (scenario 5).
Version 1.0 August 2006, © Danish Environmental Protection Agency