Ecolabelling of printed matter - part II
4 Interpretation
4.1 Sensitivity analysis
The robustness of the reference scenario profiles on potential environmental impact to different alternations in normalisation references, weighting factors, disposal and more are evaluated below. Special focus is placed on the importance of paper as compared to the other elements (especially chemicals) of the life cycle because, as stated earlier, all existing LCA studies of printed matter point to paper as the overall dominating factor and focus on the energy related impact categories. Furthermore, the effect of varying the consumptions and emissions within the observed ranges for offset printing companies on the LCA profile (as already done for ink and paper, see Section 3.6. and 3.7) is further investigated including consumptions and emissions assessed to be of importance and relevant for ecolabelling.
4.1.1 Alternative normalisation references and weighting factors
Updated normalisation references and weighting factors for the EDIP method are soon going to be published and exist already today (April 2004) in the final draft report “LCA Guideline: Update on impact categories, normalisation and weighting in LCA. Selected EDIP97-data” (Stranddorf, Hoffmann & Schmidt 2004a). This report includes estimated normalisation references (NR) and weighting factors (WF) for the current 15 EU countries (EU-15) and the world plus updated values for Denmark. The normalisation factors for the EU-15 and especially the world are in many cases estimated on basis of emission data (inventories) for a few (or one) countr(y)ies extrapolated by using Gross Domestic Product (GDP) based on the assumption that there is a linear relationship between the economic activity of the (EU)country and its emission of substances contributing to the impact category in question (Stranddorf, Hoffmann & Schmidt 2004b). For example the normalisation references for ecotoxicity (aquatic acute and chronic) are for organic substances only based on data from the Netherlands (Tørsløv 2004). As pointed out by the authors themselves, the uncertainty is relatively high, for example above one order of magnitude for ecotoxicity. The weighting factors for EU-15, especially those for ecotoxicity and human toxicity (including persistent toxicity) are based on a limited data set omitting important groups of substances due to lack of common EU regulation and the lack of inclusion of single member state regulation (due to no readily available data according to the author (Busch 2004)). As pointed out by the author himself, the EU weighting factors for human toxicity and ecotoxicity are therefore most probably underestimated. The updated normalisation references (NR1994) and updated weighting factors (WF2004) are shown together with the normalisation references (NR1990) and weighting factors (WF2000) used in this study are shown in Table 19.
In order to see how the use of the new and updated normalisation references and weighting factors affects the LCA profiles for the reference scenario, a comparison between profiles based on existing and new factors is shown in Figure 31 and Figure 32 for a normalized profile and a weighted profile respectively. Only the existing and new factors for Denmark and EU-15 are included because the factors for the world are relatively identical to the factors for EU-15 or non-existing, see Table 19. The existing factors for the waste impact categories are used in all cases because no new ones exist. Furthermore the weighting factor for stratospheric ozone depletion covering the world (value 63) is used as part of the new weighting factors for Denmark (WF2004) instead of infinite (¥).
Table 19. Normalisation references and weighting factors for the EDIP method.
| Impact category | Unit | Normalisation references | Weighting factors | ||||||
| NR1990* | NR1994** | WF2000* | WF2004** | ||||||
| Denmark and world*** | Denmark | EU-15 | Global | Denmark and world*** | Den-mark | EU-15 | World | ||
| Global warming | kg CO2- equiv./ capita/ year |
8,700 | 8,700 | 8,700 | 8,700 | 1.3 | 1.11 | 1.05 | 1.12 |
| Stratos- pheric ozone depletion |
kg CFC-11- equiv./ capita/ year |
0.202 | 0.103 | 0,103 | 0,103 | 23 | ¥ | 2.46 | 63/4.4# |
| Photo- chemical ozone formation |
kg C2H4- equiv./ capita/ year |
20 | 20 | 25 | 22 | 1.2 | 1.26 | 1.33 | 1.00 |
| Acidi- fication |
kg SO2- equiv./ capita/ year |
124 | 101 | 74 | 59 | 1.3 | 1.34 | 1.27 | - |
| Nutrient enrichment | kg NO3- equiv./ capita/ year |
298 | 260 | 119 | 95 | 1.2 | 1.31 | 1.22 | - |
| Acute human toxicity (via air) | m³ air/ capita/ year |
9.20×10⁹ | 2.09×10⁹## | 3.06×10⁹ | 2.45×10⁹ | 2.8 | 1.11 | 1.06 | - |
| Chronic human toxicity via water | m³ water/ capita/ year |
59,000 | 179,000 | 52,200 | 41,800 | 2.9 | 1.02 | 1.3 | - |
| Chronic human toxicity via soil | m³ soil/ capita/ year |
310 | 157 | 127 | 102 | 2.7 | 1.0 | 1.23 | - |
| Acute ecotoxicity (aquatic) | m³ water/ capita/ year |
48,000 | 791,000 | 29,100 | 23,300 | 2.3 | 1.73 | 1.11 | - |
| Chronic ecotoxicity in water | m³ water/ capita/ year |
470,000 | 74,000 | 352,000 | 282,000 | 2.6 | 1.67 | 1.18 | - |
| Chronic ecotoxicity in soil | m³ soil/ capita/ year |
30,000 | 656,000 | 964,000 | 771,000 | 1.9 | 1.56 | 1 | - |
| Persistent toxicity | - | - | - | - | - | 2.5 | 1.31 | 1.18 | - |
* Existing values used in this study and included in EDIP97 (Wenzel, Hauschild & Alting (1997))
** Final draft updated and new factors according to Stranddorf, Hoffmann & Schmidt (2004a)
*** Global warming and stratospheric ozone depletion based on data for the world – the rest based on data for Denmark
# Industrialised countries/Developing countries
## Most probably underestimated. Revised value is going to be included in the final report of the draft by Stranddorf, Hoffmann & Schmidt (2004a)
As is evident from Figure 31, the use of updated normalisation references for Denmark (NR-1994DK) or normalisation references covering the current 15 European Union member states (NR-1994EU-15) instead of the existing ones (NR-1990, EDIP97) does not change the overall picture of a profile dominated by contribution from the chemical related impact categories (categories covering (eco)toxicity).
The effect of using alternative normalisation references is, as shown in Figure 31, relatively moderate for the energy related impact categories. Global warming is constant and photochemical ozone formation is only reduced by 20 % if NR-1994EU-15 is used instead of the existing one (NR-1990). For acidification the normalized potential impact is increased by 23% and 67% respectively if the existing normalisation reference is substituted by the one for Denmark 1994 or EU-15. The effect on nutrient enrichment is also an increment for DK1994 and EU-15 if compared to NR-1990 with values of 14% and 150% respectively.
For the chemical related impact categories the effect of using alternative normalisation references is much more striking. The effect of using normalisation references from DK1994 instead of the existing ones is an increment of 3100% for acute human toxicity (probably too high, see Table 19), a reduction of 94% for acute ecotoxicity and an increment of 260% for persistent toxicity. If the EU-15 normalisation references are used instead of the existing ones the value for acute human toxicity is increased by 200%, the value for acute ecotoxicity is increased by 65% and for persistent toxicity the increment only accounts for about 6%.
If we look at the two impact category groups, i.e. the energy related one and the chemical related one, and sum up the normalized contributions within each group disregarding weighting (i.e. WF = 1 for all impact categories) and the waste impact categories we arrive at the figures shown in Table 20.
Table 20. Comparison of the result of using different normalisation references for calculating the total normalised potential impact within energy related and chemical related impact categories. Percent change as compared to NR-1990 shown in brackets.
| Normalisation references used | Total normalised potential impact* | |
| Energy related impact categories ** | Chemical related impact categories *** | |
| NR-1990 | 284 | 508 |
| 1994DK | 294 (+4%) | 642 (+26%) |
| 1994EU-15 | 317 (+12%) | 764 (+50%) |
* Not weighted, i.e. WF = 1 for all impact categories
** Global warming, photochemical ozone formation, acidification and nutrient enrichment
*** Acute human toxicity, acute ecotoxicity and persistent toxicity
As is evident from Table 20, using alternative normalisation references increases the impact potential for the chemical related impact categories more than the energy related ones hereby further strengthen the dominant position of the chemical related impact categories in the normalised profile for a generic printed matter.
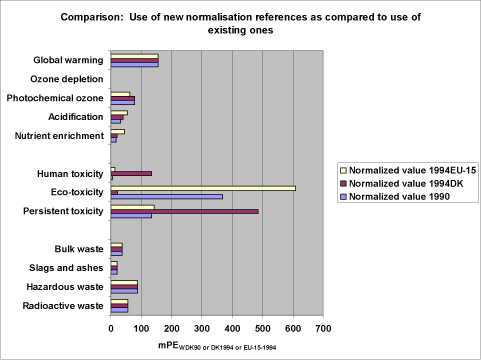
Figure 31. Comparison of the normalized profile for the reference scenario based on existing normalisation references (1990 from EDIP97), new final drafted values for Denmark (1994DK) and final drafted values for EU (1994EU-15).
If we look at the weighted profiles shown in Figure 32, the effect of using alternative weighting factors is a reduction in the potential environmental impact for most of the impact categories. The highest reduction is observed in the impact category for acute ecotoxicity, i.e. 25% for 1994DK and 52% for EU-15 if compared with the weighted value based on existing weighting factors. The reduction for persistent toxicity is also relatively high, accounting for 48 % and 52% for 1994DK and EU-15 respectively if compared with the weighted value based on existing weighting factors.
If we do the same grouping for the weighted values as for the normalised ones we produce the figures shown in Table 21.
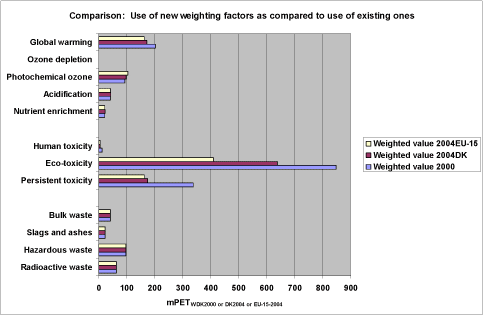
Figure 32. Comparison of the weighted profile for the reference scenario based on existing weighting factors (2000, from EDIP97), new final drafted values for Denmark (2004DK) and final drafted values for EU (2004EU-15).
The figures in Table 21 show a reduction of more than 50% in the total for the chemical related impact categories if the EU-15 weighting factors are used instead of the existing ones. The corresponding reduction in the energy related impact categories is only 8%. However most of the reduction in the chemical related impact categories may be due to the fact that the EU-15 weighting factors for the chemical related impact categories most probably are underestimated (Busch 2004) as mentioned above.
Table 21. Comparison of the result of using different weighting factors to calculate the total weighted potential impact within energy related and chemical related impact categories. Percent change as compared to WF-1990 shown in brackets.
| Weighting factor used | Total weighted potential impact | |
| Energy related impact categories * | Chemical related impact categories ** | |
| WF-1990 | 359 | 1200 |
| 1994DK | 337 (-6%) | 818 (-32%) |
| 1994EU-15 | 330 (-8%) | 576 (-52%) |
* Global warming, photochemical ozone formation, acidification and nutrient enrichment
** Acute human toxicity, acute ecotoxicity and persistent toxicity
In Figure 33 the weighted profile based on the EU-15 weighting factors and separated into the different activities is shown. If we compare this figure with Figure 6 in Section 3.3.2.1 (weighted profile based on existing weighting factors) the reductions mentioned above in the impact categories, especially for persistent toxicity, are evident. However as may be interpreted from the comparison of the two figures these reductions only change the distribution of the relative importance among the different activities to a minor degree. This fact is illustrated in Figure 34 where the relative importance of the different activities in the two cases are compared.
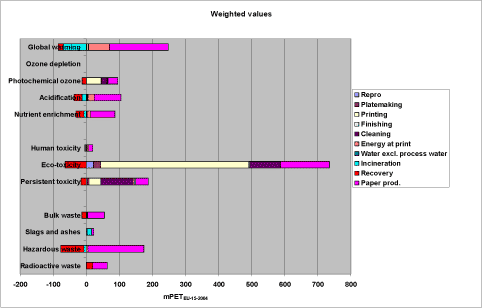
Figure 33. Weighted profile for a reference scenario where existing normalisation references and weighting factors are substituted by new drafted ones for the 15 current European Union member states (EU-15).
As shown in Figure 34 the effect of using the NR’s and WF’s for the current 15 EU member instead of the ones used in the reference scenario (mainly Danish) is an absolute increment of the importance of the paper production from 31% to 36% whereas printing is reduced from 41% to 37% making paper and printing about equally important. Cleaning is reduced in importance from 17% to 15% whereas energy consumption at the printing house is increased from 6% to 8% in importance. The other activities only undergo very small changes. This comparison shows that changing the NR’s and WF’s in the reference scenario to EU-15 values only has a minor influence on the distribution of importance among activities. It does not change the overall picture. Furthermore, if we take into account that moderate or small increases in the EU-15 weighting factors for acute ecotoxicity (e.g. 1.11 changed to 1.7) and persistent toxicity (e.g. 1.2 changed to 1.3) – which are both most probably underestimated – will lead to an increase in importance for printing from 41% to 43% and keep paper production and energy consumption at the printing house unchanged at 31% and 6% respectively, the difference between the two cases may be considered as negligible. The weighted reference scenario used in this study is therefore considered as robust and valid on a European scale.
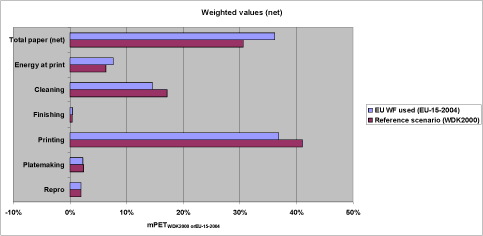
Figure 34. Comparison of relative importance distribution for the reference scenario (using existing NR and WF, WDK2000) and for a reference scenario using new drafted NR’s and WF’s (EU-15).
4.1.2 Allocation for paper production
As described in Section 1.1.2.7 two approaches for allocation on paper are used in this study, i.e. paper gross (avoided potential impacts from incineration and recycling are not allocated to the paper) and paper net (avoided potential impacts from incineration and recycling are fully allocated to the paper). If we instead use the “cut off” allocation principle INFRAS (1998), i.e. all potential environmental impacts are allocated to the virgin paper production (primary production) and the paper (including the printed matter) for recycling is considered as raw material for a new production process not carrying any burdens from the primary process, only the negative contribution from incineration is allocated to the paper used in our functional unit. This would result in a contribution of 43% (48% - 5%) to the aggregated impact; see Figure 8 in Section 3.3.2.1. On the other hand if we use the quasi-co-product allocation principle as described in INFRAS (1998) we will (if the same energy scenario is used at all cycles) see a significant reduction in the contribution from paper per functional unit. This is because in our case we would assume three cycles for the paper (i.e. chemical pulp reused twice) leading to a production of 3 co-products equally sharing the extra potential environmental impact from production of the primary product (based on virgin fibres). However, this allocation principle demands that the same functional unit can be used for all co-products and this is not true in our case because sheet fed offset to a very high degree uses virgin paper, which is reflected in an utilisation rate of only 8.6% for printing and writing paper (CEPI 2003). The recycled high-grade paper from sheet fed offset is therefore used after repulping for other product types such as packaging to a very high degree. We have therefore chosen in this study to use the paper (net) as the principle where recycling is taken into account in the functional unit, i.e. avoided fossil fuel consumption (including emission etc.) due to incineration of paper and the avoided energy consumption (including emission etc.) due to production of sulphate pulp (actually de-ink pulp) on the basis of recycled paper are fully allocated to the paper used for production of one functional unit.
4.1.3 Most important factors for the LCA profile
Some of the emissions and assumptions about the scoping of the reference scenario etc. included in this study are very crucial for the resulting LCA profile. The most important of these factors are dealt with below.
4.1.3.1 Paper
The production of paper is one of the most important activities in the life cycle of sheet fed offset printed matter. In the reference scenario paper production accounts for around 540 mPET/fu corresponding to 31% of the aggregated impact when recovery of energy and avoided emissions from recycling and incineration are allocated to paper production.
The outcome of the LCA profile for printed matter is very dependent on the energy scenario chosen for the paper and pulp production as described in details by INFRAS (1998) using site specific scenarios. However, in our generic study we avoid this problem to a high degree by using a marginal approach for electricity production.
The importance of paper production (from cradle to gate) is documented in several earlier LCA studies on offset printed matter (Dalheilm & Axelsson 1995, Axelsson et al 1997, INFRAS 1998, Johansson 2002 and Drivsholm et al. 1997). However the result of these studies shows an importance for paper that is more than twice as big (typically 70% – 80%) as the one found in this study (i.e. the reference scenario). In the study by INFRAS (1998) the importance of paper accounts for only about 64% in the main scenario (site specific), which may be due to the fact that the potential impact from nuclear power and hydro power (dominant in the energy scenario) are not included. The main reason that the importance of paper in this study is lower than half of the importance in the existing studies mentioned above is (besides differences in product types and methodology including allocation) most probably that emissions of chemicals contributing to the chemical related impact categories are included to a higher degree than in the existing studies. The effect of excluding the chemical related impact categories from the reference scenario is shown in Figure 35. The result is that the importance of paper is increased to 67%, which is at the level of the previous studies.
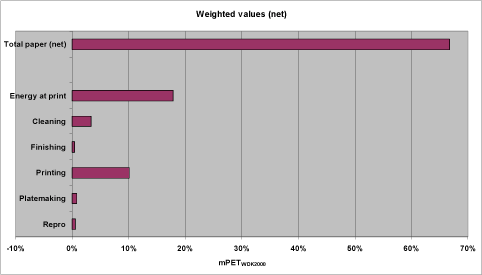
Figure 35. Weighted LCA profile for the reference scenario where chemical related impact categories are excluded. Expressed in percent share of aggregated impact.
Due to the lack of readily available data on the use of pesticides in forestry (as described qualitatively in Drivsholm et al. 1996) it has not been possible to include this potential contributor to the chemical related impact categories.
Known emissions during paper production in the reference scenario that it has not been possible to take into account in this study include AOX (107 g Cl/fu), biocides, chelating agents a.m.
AOX is a sum-parameter (expressed in mass of chlorine) covering halogenated (e.g. chlorinated) organic substances created during the bleaching of paper pulp if done by use of chlorine or chlorine dioxide containing agents. Bleaching with chlorine dioxide is called elementary chlorine free (ECF) bleaching whereas bleaching without any use of chlorine containing molecules (e.g. by use of peroxides) is termed total chlorine free (TCF) bleaching. In this LCA ECF bleached paper is included. In the study by INFRAS (1998) an analysis of the AOX issue is done. The conclusion is that the AOX emission from modern ECF bleaching processes (as included in that study and dominant today) does not contribute at all significantly to the potential impact of the LCA on printed matter. This conclusion is based on the estimation of an AOX-factor (characterisation factor) for the CML-method and calculating the contribution from AOX to the impact category “ecotoxicity water” on that basis. The AOX factor is estimated on basis of an assumption that the AOX can be represented by 85% monochloranilin, 7.5% dichlorobenzene and 7.5% of a fictitious substance with the average potential impact of trichlorobenzene and tetrachlorobenzene. The result is an AOX-factor of 0.14 points/g AOX which is pretty close to the factor for dichlorobenzene, i.e. 0.16 points/g dichlorobenzene. This estimated AOX-factor is of course only an approximation and based on the available characterisation factors for mono-, di-, tri- and tetra- chlorinated aromatics in the CML-method at that time (Heijungs et al. 1992) for which the characterisation factors were based on maximum tolerable concentrations and expressed in critical volume (“m³ polluted water”) with no fate part included. The toxicity and fate of different mono-, di-, tri- and tetra- chlorinated aromatic compounds vary considerably. However it seems quite strange that the CML-factor (on ecotoxicity water) for monochloroanilin is 0.01 points/g whereas the factor for dichlorobenzene is 0.16 points/g (i.e. a factor 16 more toxic) (Heijungs et al. 1992) even though the toxicity of monochloroanilin is about 10 times higher (based on No Observed Effect Concentration, NOEC’s) than that of dichlorobenzene according to the compilation of several toxicity data on these two substances by RIVM (1999) and Reuther, Crommentuijn & van de Plassche (1998). The reason might be that the CML-factors are estimated on the basis of a poor database. Anyway, if we accept the estimations by INFRAS (1998) and use dichlorobenzene to represent the AOX emission in our case (AOX =107g Cl/fu) we arrive at an emission of 222 g dichlorobenzene/fu and by multiplying by the EDIP characterisation factors for dichlorobenzene (Hauschild and Wenzel 1998), and further perform normalisation and weighting, the resulting contribution from the AOX emission is 116 mPET (paper gross) or 57 mPET (paper net). These figures correspond to about a 30% rise in the potential impact from the chemical related impact categories of paper. In the aggregated impact for the reference scenario (i.e. 1780 mPET/fu) the rise of 57 PET will result in an importance of AOX emission from paper production of about 3%. This estimation indicates that AOX emission from paper production may be important in the life cycle of sheet fed offset printed matter. According to the INFRAS study (INFRAS 1998) the “very small but still measurable sub lethal toxic effects” observed in fish populations exposed to waste water from modern ECF (or TCF) paper mills are not due to bleaching but maybe due to emission of “natural insecticides” and preservatives present in the wood. That sub lethal effects still occur in fish communities exposed to waste water from ECF paper mills has recently been documented by Sand & Newman (2003).
Biocides like Kathon are used for preservation in the paper production but the amount emitted is not known.
Even though it would have been nice if emission of AOX and biocides from paper production could have been included in the calculation of the chemical related impact categories, it is assessed that the heavy metal emission from the paper production (which is included) probably covers the major part of the chemical related potential environmental impact from the paper production. Furthermore it should be noted that also for other activities in the life cycle it has not been possible to include all potential contributing emissions. For example for printing, as earlier mentioned, it has not been possible to include water emission of siccatives. Even though it is considered that the most important emissions are covered - given the presently available knowledge - this missing contribution within printing may counteract the missing contribution from paper production, leading to no significant changes in distribution of relative importance between paper production and printing.
As described in Section 3.6 for scenario 3, the effect of changing the amount of paper waste per functional unit (actually the paper consumption) is significant for the outcome of the LCA profile. As depicted in Table 12 (Section 2.2.) the observed range in paper consumption is 1030 kg/fu – 1470 kg/fu. If we use these figures for recalculation of the reference scenario (all other factors constant) we end up with a net importance for paper of 28% for the lowest consumption and 35% for the highest consumption as compared to 31% in the reference scenario. These results illustrate the relative high importance of paper consumption in the life cycle of sheet fed offset printed matter. However due to the fact that the average consumption value used in the reference scenario is based on the actual consumption at more than 70 offset printing companies’ makes this value robust as input to this generic LCA.
Another issue that seems more crucial for the outcome of the estimated importance of paper is the choice of scenario for paper disposal/recycling. In the reference scenario 53% of the paper is recycled (actually recovered) and the rest is incinerated with energy utilisation. This scenario covers paper in general and is valid for Denmark, but in other European countries it may be different. According to the newest recycling statistics from the Confederation of European Paper Industries (CEPI) (CEPI 2003) covering 2002 the average recycling rate in the EU countries is about 53%, which is identical to the rate used in the reference scenario. However differences exist between the different EU member countries, which are reflected in the paper collection rate (average 56%) with a range of about 45% (e.g. Portugal and Italy) to about 70% (e.g. Finland and Germany) according to CEPI (2003).
On a European scale, paper not recovered is mainly disposed of as waste for either land filling or incineration. If we assume that at least the main part of this paper is disposed of as municipal waste we can use the data from EUROSTAT (2002) to estimate the average European partition between incineration and land filling for the paper waste. According to EUROSTAT (2002) 271 kg municipal waste per EU capita was land filled in 2002 whereas 102 kg municipal waste per EU capita was incinerated the same year. These figures gives an average estimate of about 70% paper wasteland filled and about 30% paper waste incinerated in EU. By using these figures we end up with 53% paper for recycling, 33% for land filling and 14% for incineration. In the INFRAS study (INFRAS 1998) based on a disposal scenario for Germany a split of 60% for recycling, 26% for land filling and 14% for incineration is used. Due to anaerobic conditions in the land fillings the paper deposited will during decomposition evolve methane, which is emitted to air. Methane emissions contribute to global warning and if we assume that the methane generation accounts for 0.3 kg methane/kg paper (Dailheilm & Axelsson 1995), which is a theoretical maximum, we end up with an extra contribution to global warming of 2960 kg CO2-equiv./fu in this alternative reference scenario. The LCA profile based on aggregated impacts for this alternative reference scenario is shown in Figure 36.
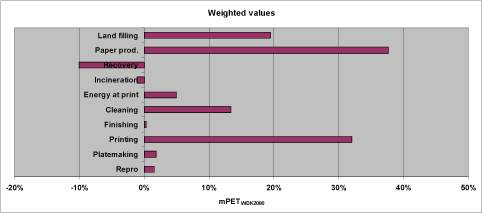
Figure 36. Weighted LCA profile for the alternative reference scenario where land filling of paper waste is included. Expressed in percent share of aggregated impact.
As is evident from Figure 36, land filling contributes significantly (19%) to the LCA profile leading to a reduction in the importance of all the other activities.
If we allocate the contribution from land filling to paper we reach the profile shown in Figure 37 together with the profile for the reference scenario.
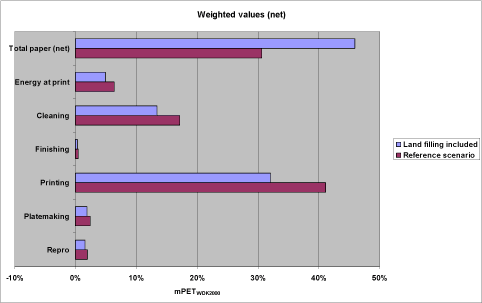
Figure 37. Comparison between the weighted LCA profile for the alternative reference scenario where land filling of paper waste is included and the reference scenario. Contributions from recycling, incineration and land filling of paper allocated to “Total paper (net)”. Expressed in percent share of aggregated impact.
As shown in Figure 37, the effect of including land filling is an increase in the relative importance of paper from 31% to 46% and a reduction in the importance of printing from 41% to 32%. Also the importance of the other activities is reduced, e.g. cleaning is reduced from 17% to 13% and energy consumption is reduced from 6% to 5%.
The recycling rates used here are based on a European average for paper in general. However about 19% of the paper on the market is not recyclable, comprising hygiene paper, cigarette paper, papers used for construction materials a.m. (CEPI 2003) leading to a recycling rate for recyclable paper (such as sheet fed offset printed matter) og 65%. If we use this rate we end up with 65% paper for recycling, 25% for land filling and 10% for incineration leading to an alternative reference scenario with the profile shown in Figure 38.
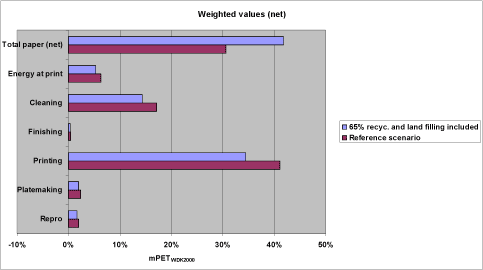
Figure 38. Comparison between the weighted LCA profile for the alternative reference scenario where 65% recycling of paper and land filling of paper waste is included, and the reference scenario. Contributions from recycling, incineration and land filling of paper allocated to “Total paper (net)”. Expressed in percent share of aggregated impact.
As is evident from Figure 38, the importance of paper is now increased from 31% to 42% and the importance of printing only reduced from 41% to 34%. Furthermore cleaning is only reduced from 17% to 14% when compared to the reference scenario.
The alternative reference scenarios shown in Figure 37 and Figure 38 are both based on the assumption that methane emission from land filling can be included as a worst case. However the following points all point in the direction of a reduced importance of methane emissions:
- The recycling rate for sheet fed offset printed matter (including paper waste from the printing company, average 16% of consumption) is probably substantially higher than 65% due to the fact that high-grade paper quality is used.
- The methane generation rate of 0.3 kg methane/kg paper is worst case assuming that all carbon (part of cellulose) in the paper is converted to methane and nothing to CO2 (e.g. due to oxidation in the upper layer of the land fill)
- Utilisation of methane from landfills for energy productions actually occur in Europe but the extent is unknown.
Unfortunately no quantitative data has been readily available for these three points. However if it is assumed that only 65% of the paper used for sheet fed offset is recycled but that 50% of the generated methane is utilised for energy production (avoided burning of fossil fuel not allocated to the functional unit) or otherwise oxidised to CO2 the LCA profile for this alternative reference scenario will be identical to the reference scenario (i.e. importance of printing 41%, importance of paper 31% etc.). Further, if the worst case for methane emission is assumed but 85% recycling of paper, the importance of paper becomes 39% and that of paper 34%. A combination of 30% of generated methane utilised and 80% paper recycled also leads to an importance of printing of 39% and paper 34%.
These estimations are based on assumption that are most probably closer to the truth than the estimations shown in Figure 37 and Figure 38 based on assumptions of a relatively low recycling rate for high grade graphic paper and worst case methane emission from land filled paper waste. It is therefore assessed that the inclusion of land filling of paper waste does probably not change the LCA profile for sheet fed offset printed matter substantially and the reference scenario is therefore assessed to be sufficient robust to represent the average European situation on paper disposal.
4.1.3.2 Printing
That the processes occuring at the printing company (upstream processes included except for paper) have a significant importance for the LCA profile of offset printed matter is documented in some earlier studies (Dalheilm & Axelsson 1995, Axelsson et al 1997, INFRAS 1998, Johansson 2002 and Drivsholm et al. 1997). However all these studies point to a much lower importance of the printing company processes than this study. For example in the INFRAS study (INFRAS 1998), looking at a newspaper, the importance of processes occuring at the printing company is estimated as 31% (35% if distribution is included) by use of the Eco-Indicator-95 method. In our study the corresponding importance is as high as 69%. Besides differences in the product types and methodology used including allocation principle for paper the main reason for this difference is assessed to be that the chemical related impact categories in our study are included to a higher degree than in the earlier studies, e.g. emission of specific non-energy related substances in upstream processes are not taken into account in the INFRAS study, see Introduction and Section 4.1.3.1 for further details.
Printing is in this study the most important factor contributing with 730 mPET/fu corresponding to 41% of the aggregated impact. However in our case it includes at least two main sub activities, i.e. printing ink production and the printing process at the model printing company.
Production of printing ink contributes in the reference scenario with 295mPET corresponding to 17%. As described in Section 3.2.1 this contribution is mainly due to relatively high characterisation factors based on emissions scenarios taken from the EC Technical Guidance Document (TGD) on risk assessment (EC 2002). This kind of scenario is used for first tier risk assessment/screening and may therefore be conservative. However, Andersen & Nikolajsen (2003) have consistently used the lowest among the proposed values for emitted fraction in every case (produced amount > 2000 ton, assuming WWTP at the production facilities). A brief critical review of the calculations by Andersen & Nikolajsen (2003) reveals errors in the estimated chronic characterisation factors for the two most contributing synthesis chemicals, i.e. 3,3-dichlorobenzidine and cuprous chloride. If these errors are taken into account, the chronic aquatic characterisation factor (EF(etwc)) in Table 16 (Section 3.2.1) for Pigment Yellow 14 upstream becomes 42.5 m³/g instead of 9.26 m³/g (a factor 5 higher) and for Pigment Blue 15 upstream the chronic aquatic characterisation factor (EF(etwc)) in Table 16 becomes 48.3 m³/g instead of 10.4 m³/g (also about factor 5 higher) and the chronic terrestrial characterisation factor (EF(etsc)) in Table 16 becomes 4.89 m³/g instead of 1.29 m³/g (about a factor 4 higher). If these corrections are taken into account the contribution to the aggregated impact from the ink production is increased from 295 mPET to 371 mPET leading to an increase in the importance from 17% to 20% for the ink production and a simultaneous reduction in the importance of, for example, total paper from 31% to 29%. The result of this correction points in the direction of a slightly higher importance of the ink production in the reference scenario. Furthermore it is known that pigments are part of the positive offset plate emulsion used at the plate making activity, but it is assessed that this consumption (due to low quantity) does not contribute significantly to the aggregated impact from pigment production. Actually measured emissions from the production of pigments would have been preferred, but this kind of data is unfortunately not readily available today.
The very high importance of the ink consumption at the model printing company is shown in Section 3.7 (scenario 4). A further analysis of these results based on the observed range of 1.8 kg ink/fu – 26.5 kg ink/fu reveals a range in the importance of 7% - 34% for ink production and 7% - 37% for ink residue emission at the model printing company. In total this gives an importance of printing (incl. ink production) of 23% in the lower consumption case and 74% in the upper consumption case. The corresponding importance for paper (net) is 40% and 14% respectively. However these calculations are based on the assumption that the emission of ink residues at the model printing company is directly proportional to the consumption. This is probably not true. If we assume that the ink emission is independent of the consumption, the result reveals a 34% importance of printing (incl. ink production) in the lower consumption case and 63% importance in the upper consumption case. For paper (net) the corresponding figures are 35% and 19% respectively.
Emission of ink residues at the model printing company contributes 316 mPET corresponding to 18% of the total in the reference scenario. The overall dominating contributor is emission of tetradecane which is as described in Section 2.1.10, included to represent the solvent part (mineral oil) of the printing ink. In this generic LCA the emission of ink residues is assumed to be via used fountain solution and to a lesser extent cleaning agents/water emitted as waste water to water, see table 13 in Section 2.3. The amount emitted is set to 1% of the ink consumption. No measured range in ink residue emission is known but if we assume a variation of a factor 10 (range: 0,3% - 3%) and use these figures to recalculate the reference scenario we get an importance of 6% (95 mPET) for the lower value and 39 % (950 mPET) for the upper value. These recalculations will simultaneously lead to an importance of the printing activity (total) of 33% (lower value) and 57% (upper value) and for total paper (net) of 35% (lower value) and 23% (upper value). These results illustrate a high importance of ink residue emission for the generic LCA of sheet fed offset printed matter. The amount actually emitted at a sheet fed offset printing company will depend on factors such as whether or not the used fountain solution and waste water from cleaning (e.g. dampening form rollers with cloth) are emitted to water, and if emitted, the concentration of ink residues in, for example, the used fountain solution which depends on the fountain solution system at the printing machine. However it is assessed that an emission of 1% of consumption represents emission of ink residues for a generic sheet fed offset LCA fairly accurately.
Emission of IPA at the model printing company (especially air emission) also contributes significantly, i.e. 100 mPET, corresponding to 6%. The range in the consumption is 0.0785 kg/fu - 10.4 kg/fu as depicted in table 12 in Section 2.2. If we use these two values to recalculate the reference scenario we obtain an importance of 0.1% in the lower case and 7% in the upper case. These results indicate that the importance of IPA is only moderately raised if used in the highest observed quantity and that it may be reduced to insignificance if the lowest observed consumption is used. Here it is assumed that the emitted amount of IPA is directly proportional to the consumption, which is assessed to be realistic in this case because IPA is an auxiliary substance not following the product.
The last factor within printing that contributes more than 1% to the aggregated impact of the reference scenario is the fountain solution. This contribution (1.1%) is primarily connected to the biocides emitted to water as part of the used fountain solution. The biocides used are typically Kathon and bronopol but Kathon may be used alone in a concentration of about 0.06% w/w. In that case the importance of fountain solution is only reduced to 0.9%.
4.1.3.3 Cleaning
Cleaning in the reference scenario is the third most important activity, contributing 305 mPET/fu, corresponding to 17% of the aggregated impact. The main contributors in this case are emissions of hexane and tetradecane where hexane’s part is about twice as big as the one for tetradecane. As described in Section 2.1.14 hexane is included to represent a light aliphatic (volatile) cleaning agent whereas tetradecane is included to represent a heavy aliphatic (low volatile) cleaning agent. As can be seen in Table 11 in Section 2.1.14, the mix of cleaning agents chosen for the reference scenario is 2% for surfactants and the rest is shared equally between the heavy aliphatic (tetradecane), the light aliphatic (hexane), the alcohol based (ethanol) and the vegetable based type (soya oil). If for example the aliphatic-based types are fully substituted by vegetable based types (and we assume no content of hazardous components in the substitute like emulgators based on nonyl phenol ethoxylates) the effect is a reduction in the importance of cleaning from 17% to around 0.8%. On the other hand if all but the surfactants (alkoholethoxylate) are substituted by the light aliphatic type (hexane) the effect is an increase to 27% in importance of cleaning in the LCA of sheet fed offset printed matter.
4.1.3.4 Repro, plate making and finishing
In the reference scenario these activities only contribute about 2% each for repro and plate making whereas finishing only contributes about 0.4% to the aggregated impact.
For the repro activity the main contributor is water emission of hydroquinone contributing with around 1.4% whereas the emission of biocides (i.e. Kathone) used in rinse water only contributes around 0.25% of the aggregated impact. Another source of biocide (fungicide) emission is film emulsion emitted to water via the rinse water. Due to scoping and lack of data this potential emission together with potential emission of filter dyes and wetting agents also from film emulsion are not included here and preliminary assessed to be insignificant due to the very low quantity per functional unit (see Section 2.1.1).
For plate making the main contributor is water emission of biocides (i.e. Kathone) in used rinse water contributing about 1.7% whereas the contribution from the use of aluminium plates only contributes 0.24%. For the reference scenario it is assumed that the aluminium plates are fully recycled, i.e. only the 8% loss during recycling is allocated as virgin aluminium to the plate making activity – the rest (92%) is considered as recycled aluminium. If it is assumed that the model printing company uses virgin aluminium exclusively and the potential impact from the production of virgin aluminium is fully allocated to the plate making activity, its importance is increased to about 3.7% of the aggregated impact. In that case the importance of use of aluminium is increased to 1.5% of the aggregated impact.
In the scoping of the finishing process some chemicals and activities are excluded that belong or may be considered as belonging to finishing. Including for example dispersion glue which typically contains biocides (Miljønet 2004) that may be emitted during cleaning with water, UV inks and especially the process of lamination may elevate the importance of finishing in the LCA profile on sheet fed offset printed matter. However this elevation is preliminary assessed not to change the overall LCA profile for printed matter substantially.
4.1.4 Excluded processes
4.1.4.1 Transport
As described in Section 1.1.2.3 on scoping transport is not dealt with as a separate activity in this LCA. Previous LCA studies by Dalheilm & Axelsson (1995), Axelsson et al (1997) and Johansson (2002) which all include transport as a separate entity (transport of raw materials for the production stage and transport during the production stage) indicate that when only energy related impact categories are included transport in the whole life cycle of generic offset printed matter accounts for around 10% of the potential environmental impact. In the study by INFRAS (1998) transport for distribution of newspapers in a newspaper LCA is estimated to account for about 4% of the total environmental load. The LCA study by Frees et al. (2004) on paper production and recycling of paper indicates that transport only accounts for about 4% of the energy consumption for recycling, even though this process involves a lot of transport, i.e. gathering of paper waste from several small industries, transport to one central paper mill for re-pulping etc. Furthermore in the final draft report “Review of existing LCA studies on the recycling and disposal of paper and cardboard” by Villanueva et al (2004) a study by Tillman et al from 1991 is analysed and this study indicates a contribution of 2% from transport to the overall paper cycle energy profile. When the chemical related impact categories are included, as in this study, it is assessed that transport accounts for around 5% of the aggregated impact covering the whole life cycle of the generic sheet fed offset printed matter.
4.1.4.2 Waste
Due to lack of readily available data, the scoping of this study and the method used (EDIP) waste i.e. nuclear waste; chemical waste, bulk waste, and slag and ashes are only treated as total amount (kg, no differentiation by characterisation factors) in this study. However the emissions from, for example, treatment of chemical waste from the printing company and of de-inking sludge from recycling of paper could maybe contribute significantly to the total potential impact of printed matter. Unfortunately it has not been possible to include these issues in this study.
4.2 Conclusion
The goal of this study is to identify the distribution of potential environmental impacts and consumption of resources during the life cycle of generic printed matter produced on a model sheet feed offset printing company. This distribution is represented by LCA-profiles on overall results in the Figure 39 and Figure 40. These results are based on average consumptions and emissions from primarily Scandinavian sheet fed offset printing companies but assessed to be fairly representative for average modern technology in Europe. The functional unit (fu) is one-ton printed matter.
In Figure 39 and Figure 40 the contributions are divided into the different activities at the model printing company, the energy consumption at the model printing company and the contribution from paper production as a net value (avoided potential impact and resource consumption from incineration and recycling of paper is withdrawn). This is primarily done because in ecolabelling we typically focus on the activities at the printing company. Paper is shown separately (though actually a raw material for the printing process) mainly because former LCA studies indicate that it is the overall dominating factor. This study including the chemical related impact categories however indicates that the LCA profile for generic sheet fed offset printed matter is much more varied as shown in Figure 39 and 40.
For aggregated weighted potential environmental impact (hereafter designated aggregated impact) the dominant activity is printing with 41% contribution, see Figure 39. This 41% consists of 18 % from ink emission at the model printing company (e.g. mineral oil components), 17% from upstream pigment production (emission of synthesis chemicals), 6% from emission of IPA at the model printing company and 1% from emission of used fountain solution at the model printing company. Paper contributes 31%, which is mainly due to emissions related to energy consumption (CO2, SO2, heavy metals) which is also the case for the 6% contribution from the energy consumption at the model printing company. Cleaning activities at the model printing company contribute 17% where emission of volatile organic aliphatic solvents is dominant. Plate making contributes about 2%, dominated by emission of biocides (used recycled rinse water). Repro activities at the model printing company also contribute about 2% (mainly due to emission of hydroquinone) whereas finishing only contributes about 0.4%.
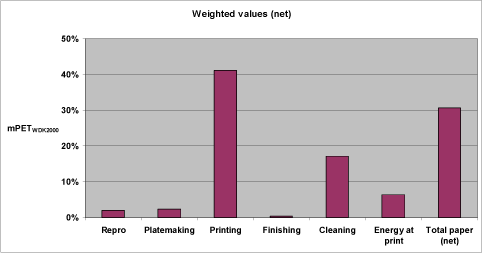
Figure 39. Aggregated impact profile for the reference scenario in relative figures and with total paper as net value.
For the aggregated weighted resource consumption paper is dominant with a share of 48%, primarily due to consumption of energy carriers (natural gas and oil), see Figure 40.
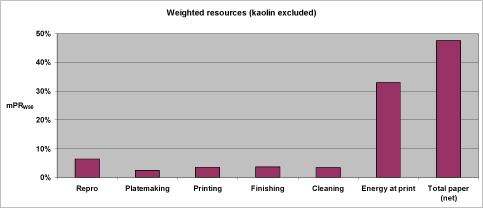
Figure 40. Aggregated weighted resource profile for the reference scenario in relative figures and with total paper as net value and kaolin excluded.
In Figure 40, kaolin (used as filler for paper) is excluded but if it were included the share of paper would be increased to 88%. However kaolin can easily be substituted by, for example, chalk, reducing the importance of the filler by several orders of magnitude. Energy consumption at the model printing company has a share of 33% in Figure 40, which is also mainly due to consumption of energy carriers (natural gas). The repro activity has a share of 6% (silver) and finishing a share of 4% (energy carriers, uranium). For printing the share is also 4% (energy carriers, natural gas) whereas for cleaning it is 3% (energy carriers, uranium) and for plate making 2% (aluminium).
The main results from the sensitivity analysis are the following:
- Using European based normalisation references and weighting factors instead of the Danish/Swedish ones used in the reference scenario does not change the overall LCA-profile significantly
- The inclusion of a European disposal scenario for paper (i.e. including land filling) in the reference scenario is assessed probably not to change the LCA profile substantially
- Known emissions that it has not been possible to include in this study are preliminarily assessed (on the basis of readily available data) probably not to change the overall LCA profile of the reference scenario if included
The results of this LCA study are therefore assessed to be valuable both for ecolabelling of offset printed matter (especially sheet fed) on a Nordic scale (Swan labelling) and a European scale (Flower labelling).
Further sensitivity analysis and alternative scenarios performed by varying the consumption, emissions etc. within the observed and estimated ranges at the model printing company give the following main results:
- The effect of treating waste water from the model printing company in a waste water treatment plant including a biological step is a reduction of about 26% in aggregated impact
- The effect of reducing the printing ink consumption from 26.5 kg/fu to 1.8 kg/fu is a reduction in the aggregated impact of 56%
- The effect of substituting the biocide benzalkonium with the biocide Kathon (both used for preservation of rinse water) is a reduction in the aggregated impact of 69% (no waste water treatment included)
- The effect of using recycled paper exclusively instead of virgin paper exclusively is a reduction in the aggregated impact of 16%
- The difference between using highly volatile aliphatic cleaning agents instead of vegetable oil based types may be 27% contribution to the aggregated impact instead of 0.8%
As illustrated by the points mentioned above, the strength of this LCA approach for use in ecolabelling of printed matter is not only the exact LCA profile of the reference scenario based upon average values but to a high degree the possibilities to use sensitivity analysis based upon known or theoretical ranges within values on consumption, emissions or other parameters. By conducting sensitivity analysis we see an indication on how sensitive the distribution of the potential impact within the life cycle of the printed matter is to variation in the parameter in question and thereby guidance on how much weight to put on the parameter in the development of ecolabelling criteria based on a life cycle approach. This LCA approach is also valuable when dealing with substitution, i.e. substituting one chemical with another technically suitable type and observing the change in the distribution of the potential impact within the life cycle.
The main issues that it has not been possible to include in this study and that might change the outcome significantly include:
- Upstream emissions of specific substances, e.g. emission of synthesis chemicals from pigment production based on measured values (included in this study but based on estimated values)
- Fate of paper when disposed as land fill, i.e. how much methane is actually emitted to air?
- Fate of chemical waste and other waste types from the printing company etc., e.g. how big is the potential environmental impact from treatment of used solvent or rinse water from printing or waste treatment of deinking sludge from recycling of paper?
Research in these areas is needed if the reliability of the LCA on printed matter is to be further strengthened and thus improving the foundation for life cycle based ecolabelling criteria for printed matter
Version 1.0 August 2006, © Danish Environmental Protection Agency