|
Værditab ved salg af forurenede eller tidligere forurenede ejendomme med helårsbeboelse Summary and conclusionsBackground and scope of project Earlier analyses have shown that owners of plots for houses that are contaminated, or previously were contaminated, may have to bear larger costs in connection with lending, or they suffered a larger loss resulting from depreciation of their property than other house owners. However, the data material has not been sufficient to allow general conclusions on the magnitude of loss. Such conclusions have been attempted in connection with work in the Land Depreciation Committee, which resulted in the establishment of the Land Depreciation Programme, and, finally, in connection with the evaluation. The Danish EPA therefore initiated this study in 2004, in order to investigate the extent to which owners of contaminated sites, or sites that were contaminated previously, may have experienced a loss in connection with selling their property, or whether such contamination affects the possibility for potential buyers to raise loans in connection with buying the property. This study analyses the depreciation loss, if any, experienced by owners of property that is or was contaminated in the period 1996-2003. The study does not include the effect on the costs of mortgage loans on the property in connection with selling, since the mortgage banks do not register commitments or refusals of applications for loans. The study is the first part of a land depreciation project. The second part will analyse the costs of removing residual contamination that may still remain. Data collection In the study, data from different data sets are coupled, i.e. data from environment databases and land registries, and data on market prices of properties, and public property valuations. Environment data was collected from central databases/registers of contaminated sites in Denmark operated by the Danish EPA and the Agency for Governmental Management, while land register data was collected from these databases, and from the National Survey and Cadastre Denmark, and from the municipalities of Copenhagen and Frederiksberg. Data on buying and selling houses was collected from the Central Customs and Tax Administration database of property valuations and the prices of houses on the market. Data collection focuses on the following identification flow: Identification of contaminated/previously contaminated sites -> identification of land belonging to the registered land -> establishment of unique list of registered land -> identification of contaminated properties that have been sold on the market -> identification of comparable properties, i.e. properties sold in the same valuation district -> establishment of unique list of traded contaminated/previously contaminated properties and non-contaminated properties -> delimitation of data to include only traded properties approved for permanent habitation/housing). The collected data was integrated in a project database. Key parametres A pivotal issue in the study was the status of contamination of individual properties in the entire period 1996-2003. A contaminated site may very well change its contamination status over time – from being suspected of contamination (knowledge level V1), to having an ascertained level of contamination (knowledge level V2), and later, to having been cleaned up or to being affected by residual contamination. The project database was established by coupling data in the three central databases of contaminated sites, and setting up codes for eight contamination levels. Table 0-1: Contamination status
The study measures the loss of value by quantifying the market price's share of the public valuation. The report defines this share as the relative market price (RH)[2]. The study also applies the concept of free trade, which differs from trade within the family, sale by auction, and other types of trade. Free trade means sale/purchase of properties between parties with opposing interests regarding the market price, while for other types of transactions, a number of unknown factors may influence the market price. Project database In order to establish a unique database, data was prioritised in two ways. 1) Where property transactions involved contamination data derived from more than one database/one registry, the data was prioritised accordingly. Information from the source databases was ranked by order of priority, in order to make sure that correlations were unique. Information from the OM (Danish Oil Industry's Association for Remediation of Retail Sites) database ranks highest, then the VTO (Land Depreciation Programme) registry, and last, information from the national register of contaminated sites ROKA. The order of priority was also defined for transactions related to several “registered properties”, i.e. localities in ROKA, cases registered in the OM database or the VTO register with different codes identifying the contamination status. Where transactions are related to several registered properties having different contamination statuses, the worst-case status was given the highest priority. Prioritisation is shown in Table 0-2. Table 0-2: Prioritisation of contamination status in project database
1Highest number = highest priority The project database includes at total of 693,160 transactions, of which 7,756 are related to registered properties which at the time of sale were listed in one of the three central databases of contaminated and possibly contaminated sites (suspicion, contamination, cleaned up, residual contamination, and investigated without findings). Of these, the number of free transactions with complete transfer of title to the property is 6,925. These transactions form the basis for the statistical calculations made in this study. The number of transactions indicates that the data used is very well suited for a more detailed analysis of the magnitude of the depreciation loss. Public property valuation reduction recorded by the Customs and Tax Administration The number of transactions of contaminated sites with complete transfer of title to the land (i.e. not only to part of the land) in free trade (i.e. not within the family, and not by auction), where the Customs and Tax Administration has recorded reduced valuation, is 3,328. Of these transactions, reduced valuation due to contamination was recorded in 179 transactions. Frequency of properties being resold Properties in the project database have been resold approx. 1.25 times on average in the period 1996-2003. The frequency for non-contaminated properties is 1.3. Statistical analysis The data was processed statistically in variance analyses, which contribute to determining the importance of different factors to the relative market price and to determining whether differences are incidental. Five hypotheses were set up to reveal the factors that influence the loss of value. Hypothesesis 1: There is a relationship between the relative market price of the property, its contamination status, and the area in Denmark in which the property is located. Hypothesis 2: There is a relationship between the relative market price of the property, its contamination status, and the zoning of the site (urban or rural zoning). Hypothesis 3: There is a relationship between the relative market price of the property, its contamination status, and the type of housing (detached house, flat etc.). Hypothesis 4: There is a relationship between the relative market price of the property, its contamination status, and the programme under which the contamination is managed (Contaminated Soil Act, Danish Oil Industry's Association for Remediation of Retail Sites (OM), or the Land Depreciation Programme (VTO)). Hypothesis 5: There is a relationship between the relative market price of the property in connection with resale and a change of the contamination status of the property. The statistical analyses are based on an iterative approach, starting by setting up a statistical model, scrutinising of the data material (incl. test running), revision of the model, and finally, final running and interpretation of results. Prior to each running of a model analysis, extracts of transactions were made from the project database, using a number of general and, sometimes, model-specific criteria. The general criteria were:
Among the hypothesis-specific criteria were:
Further, non-deviating observations were to be made. Statistical tools were used in order to select deviating observations. The analyses were based on a 10 per cent level for the variance analysis model, and a 90 per cent mean value confidence level. The assumptions for variance analyses, including the requirement for independent observations (transactions), normally distributed residuals (normality), and variance homogeneity, are fulfilled for all model hypotheses with sufficient convergence to carry out the statistical analysis. Table 0-3 shows the data basis after filtering. Table 0-3: Data basis used in Hypotheses 1-5
Results Results of the five model runnings are presented in figures and tables for the five hypotheses. The figures show the share of the purchase price (market price) of the valuation. The tables show the loss of value in percentage points in relation to non-contaminated sites. Hypothesis 1 (area in Denmark) Figure 0-1: Hypothesis 1 - Contamination status and area - estimated RH values for transactions, and 90 per cent confidence interval distributed by contamination status. Table 0-4 Hypothesis 1 – Loss of value due to contamination, in percentage points
”– ”: no significant deviation from non-contaminated sites. The analysis shows:
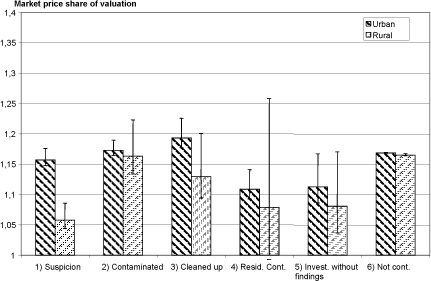
Hypothesis 2 (Zoning) Figure 0-2: Hypothesis 2 - Contamination status and zoning - estimated RH values for transactions and 90 per cent confidence interval distributed by contamination status.
Table 0-5: Hypothesis 2 - Loss of value in percentage points caused by contamination in relation to non-contaminated sites
”– ”: no significant difference. The analysis shows:
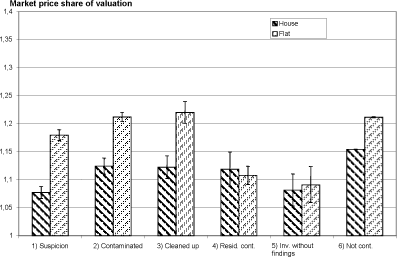
Hypothesis 3 (Use of house) Figure 0-3: Hypothesis 3 - Contamination status and use of house - estimated RH values for transactions and 90 per cent confidence interval distributed by contamination status
Table 0-6 Hypothesis 3 Loss of value in percentage points caused by contamination
”– ”: no significant difference. Based on these categories, the figure and table show:
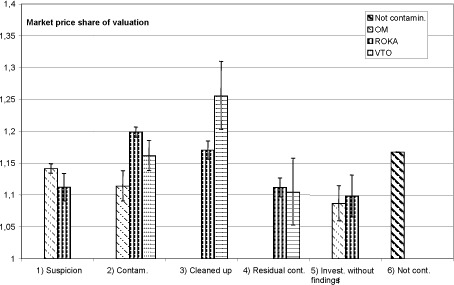
Hypothesis 4 (Scheme) Figure 0-4: Hypothesis 4 - Contamination status and scheme – estimated RH values for transactions and 90 per cent confidence interval distributed by contamination status
Table 0-7: Hypothesis 4 - Loss of value in percentage points caused by contamination
”– ”: no significant difference. Considerable differences are found between the three databases, which do not include comparable categories for all levels of contamination. The categories are compared to the average relative market value for the contamination status ”not contaminated” in the same public valuation district. With this division of categories, the figure and table show that:
Hypothesis 5 (Resale) Test of:
Conclusions The study shows that hypotheses 1-4 are substantiated:
However, the study shows that Hypothesis 5 is only partially substantiated:
The study shows that property owners may achieve considerable gains by having their site investigated in cases where the contamination status is changed from “suspicion” to ”contaminated”. It should be noted that contamination in relation to flats will often be associated with problems in the indoor climate. The study also shows that the Land Depreciation Programme is an efficient tool, enabling the owner to achieve considerable gains by cleaning up the site, because the loss of value is reduced. The historical development of the data registers used, and the geographical development in the process of mapping contaminated sites may both contribute to deviations from what is expected for some of the results. One of the reasons is that the price of properties has increased very much in the period 1996-2003. The price increases in the period do, however, vary considerably, both geographically, and among different types of properties. It is important to note that the analysis was made in a period (1996-2003), in which the real estate market has developed rapidly, and the lack of dwellings may in certain areas have influenced the relative market price for properties affected by contamination. Looking at the loss of value expressed as DKK per DKK 1 mill. (valuation), the study reveals the following average loss of value for the five different levels of contamination:
The study also shows that the actors on the housing market are confident that the sites have been cleaned up. The loss of value for transactions related to the contamination status ”cleaned up” amounts to DKK 1,000 per DKK 1 mill. (valuation). However, it also appears that any form of uncertainty, whether it is based on facts or not, i.e. for contamination statuses suspicion, contaminated, residual contamination or investigated without findings, will be reflected in the price. Fodnoter [2] Relative market price (Relativ handelspris (RH)) = market price (valuation + any price reduction due to contamination). Section 2.3.3 gives a more detailed description of RH.
|
||||||||||||||||||||||||||||||||||||||||||||||||||||||||||||||||||||||||||||||||||||||||||||||||||||||||||||||||||||||||||||||||||||||||||||||||||||||||||||||||||||||||||||||||||||||||||||||


