Brændeovne og små kedler
Summary and conclusions
Pollution from burning wood in private households, and the environmental and health consequences of this is determined in practice by a complicated interaction between a number of factors, including firing habits, fuel, type of stove/boiler, chimney and location of the chimney in relation to the surroundings.
This report maps out the technologies used today for burning wood in private households, how these technologies contribute to particle emissions and which technologies may potentially reduce emissions of particles from burning wood in households in Denmark. Moreover, the possible emissions reductions and the financial costs incurred by consumers from different initiatives have been estimated.
This report does not deal with possible initiatives for improvement of firing habits, fuel quality and chimneys.
Wood consumption and emissions
The assessment of Danish particle emissions has been updated. The figures describing the population of stoves, boilers etc. are based on results from the Danish Technological Institute's survey on fuel consumption patterns for old and new wood-burning stoves and boilers in 2005 and the survey made by the Force Technology and the Danish Technological Institute on firewood consumption in Denmark in 2006. The emission factors applied are based on emission factors calculated by the Danish National Environmental Research Institute and emissions measurements by the Danish Technological Institute of CO and NMVOC from wood-burning boilers.
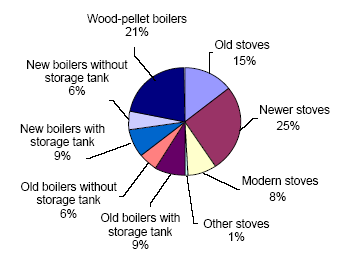
These calculations show that in Denmark the majority of installations are wood-burning stoves, and that they constitute 86 per cent of the total number of installations of approximately 600,000. However, wood consumption per installation per year is far larger for boilers than for stoves, and approximately 50 per cent of the fuel converted into energy units is estimated to be used in boilers. As it appears from figure 0.1, which shows the wood consumption by installation type, the consumption by wood-burning boilers and wood-pellet boilers constitutes approximately 30 per cent and 20 per cent, respectively.

Figure 0.1 Wood consumption analysed by installation type

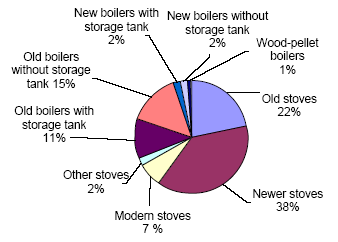
Figure 0.2 PM2.5 emissions analysed by installation type.
Emission factors for old wood-burning stoves and boilers are generally higher than for new installations. Estimates of emission factors are particularly high for old wood-burning boilers. The lowest emission factors are estimated for wood-pellet boilers, which means that emissions from this type of installation only constitute 1 per cent of the total PM2.5 emissions from wood-burning installations in households (Figure 0.2). Almost 90 per cent of the emissions come from installation types with high emission factors, and therefore there is a great potential for reducing emissions by changing to installation types with more efficient combustion, for example new boilers with storage tanks, automatically fired stoves and boilers, modern wood-burning stoves, and masonry stoves. As mentioned above, this report only includes technological reduction possibilities. However, a large reduction potential also exists in awareness campaigns to inform people about the appropriate use of wood-burning stoves and boilers, as measurements have shown that very low particle emissions can be achieved even from old wood-burning stoves.
Table 0.1 shows wood consumption and emissions in 2005 for stoves and boilers, as well as weighted average emission factors.
Table 0.1. Wood consumption, emission factors and emissions for 2005
| Consumption (TJ) | Emission factors, PM2.5 (g/GJ) | Emissions, PM2.5 (tonnes) | |
| Stoves | 12.5 | 921 | 11536 |
| Boilers | 7.1 | 722 | 5128 |
| Pellet boilers | 5.4 | 32 | 173 |
| In total | 25.0 | 672 | 16838 |
Emissions scenarios
The emissions trends for four scenarios have been estimated. These scenarios include 1) a base line scenario, where the replacement of stoves and boilers is assumed to be the same as assessed for 2005, however with some technological development for stoves, 2) Statutory Order scenario, where maximum emissions standards for stoves and boilers are imposed to direct the development, 3) a filter scenario, where over a ten-year period electro-filters are installed on all wood-burning units and 4) a sub-scenario where filters are only installed on wood-burning units located in cities of a certain size. The Statutory Order scenario is based on the assumption that regulation is introduced as described in the Danish Environmental Protection Agency's draft proposal for a Statutory Order on wood-burning stoves. The filter scenario will require an additional 1-2 years’ development work on the filters in order to be technologically realistic.
As a basis for all four scenarios, the latest official energy projection of firewood and wood-pellets has been applied up to 2020. The wood consumption in three of the scenarios is therefore the same, and only the composition of the technologies applied is changed.
The greatest reduction is for the filter scenario, where emissions in 2020 are expected to be approximately 705 tonnes PM2.5, equivalent to a reduction of 96 per cent from 2005, provided that the filters are installed on all wood-burning units without special focus on the units' consumption or emission factor before introducing the filters. The basic scenario shows a steady fall in the number of installations with high emission factors, and the proportion of technologies with low emission factors will rise from 18 per cent in 2005 to 43 per cent in 2020. The Statutory Order scenario shows that this proportion will rise to 74 per cent in the same period. In two of the scenarios, emissions will be reduced from 16.8 kilo-tonnes in 2005 to 14.1 kilo-tonnes and 10.6 kilo-tonnes in 2020, respectively; equivalent to reductions of 16 per cent and 37 per cent. This should be seen in relation to the fact that in the same period an increase in firewood and wood-pellets consumption of 22 per cent is expected.
The welfare economic analysis shows that the filter scenario clearly offers the largest welfare economic surplus overall. Even if the filter scenario is more than twice as expensive as the basic scenario, the consumer-borne investment cost alone will give the filter scenario the largest welfare economic surplus of DKK 11.9 billion in present value compared to the basic scenario, which is equivalent to a reduction in costs of damage from emissions of PM2.5 of DKK 16.4 billion minus the consumer-borne additional costs of 4.5 billion. There is, however, great uncertainty associated with the prices calculated in the welfare economic analysis for particle emissions. It will require further studies to estimate the costs of damage from particle emissions from wood-burning units in households more accurately. If, however, the efficiency of investing in the different scenarios is examined, the greatest emissions reduction per invested DKK is achieved with the Statutory Order scenario, at 2.5 times greater than for the two filter scenarios.
Version 1.0 April 2007, © Miljøstyrelsen.