Effects of Mechanical Weed Control in Spring Cereals – Flora, Fauna and Economy
3 Results
3.1 Weeds and arthropods
3.1.1 Field experiment
3.1.1.1 Effects of harrowing on diversity of weed species
The sum of all subsample occurrences of all weed species was calculated for the reference and experimental subplots. Maximum theoretical number of occurrences per category was 135 for each species. The results are presented in Figure 3.1. After three and four times harrowing, a marked difference in weed occurrence is seen, when comparing only two harrowings with three, respectively four harrowings. Furthermore, no significant change in the weed occurrence was found, when increasing weed harrowing from three to four times harrowing (model 1).
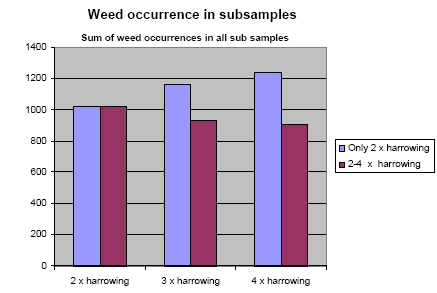
Figure 3.1. The effect of harrowing on weed occurrence. Y axis is the sum of recorded species in all subsamples.
The total number of weed species observed in all the subplots as a function of harrowing frequency is shown in Figure 3.2.
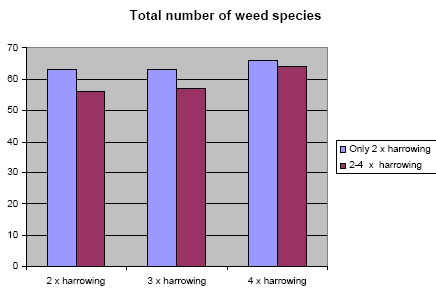
Figure 3.2. The effect of harrowing on the total number of observed weed species. Y axis: the total number of weed species observed.
There is no significant difference between two and four harrowings, but a small, not significant increase in total species number with harrowing frequency, probably reflecting the higher probability with time for new weed species to occur (see discussion). The seemingly higher difference between the columns at 2 x harrowing is only accidental.
3.1.1.2 The effect of weed harrowing on vegetation biomass
The results were analysed statistically using the model 2. The total number of samples with size 0.15 m² (mean of four - five subsamples of 0.15 m² – see Figure 2.2) was number of years ´ number of farms ´ number of plots per field ´ number of subplots per plot ´ number of samplings = 2´6´2´11´3 = 792; three of these were discarded due to anomaly.
Table 3.1. The reduction in weed and crop biomass related to number of times harrowing. The sampling in the two plots per field was carried out simultaneously ensuring that the estimated biomasses between two-harrowing plots and three-four harrowing plots are directly comparable. The % reduction in weeds is significant at the P < 0.01 level..
| Vegetation | Estimated mean dry biomass, g m-² | % reduction | ||
| Affected by 2 harrowings | Affected by 3 harrowings | Affected by 4 harrowings | Total | |
| Weeds | 3.5 | 2.0 | 43 | |
| 12.0 | 6.3 | 48 | ||
| Crop | 60.7 | 58.7 | 3 | |
| 213.0 | 200.0 | 6 | ||
It is seen from Table 3.1, that there is relatively little further weed and crop reduction by increasing the harrowing frequency from three to four times. This may infer that acceptable decrease in weed competition on the crop already was attained with only three times harrowing.
3.1.1.3 The relation between weed biomass and weed species composition
It was attempted to clarify, whether variation in weed species composition reflects differences in ecological growth conditions between the experimental plots, by Sørensen similarity and Ellenberg index calculations.
In total 81 taxons of weed plants were found in the biomass samples. In order to calculate Sørensen similarity and weighted Ellenberg indices, the biomass samples were ranked in separate weight classes. The number of intervals was 30 (Sørensen index) and 12 (Ellenberg), and the total number of biomass samples was 789. Sørensen similarity index is based on the number of species occurring in the two samples selected for comparison, and the number of common species between these samples. The index range is 0 to 1. The results are shown in the matrix (Table 3.2). One figure in the matrix is the calculated Sørensen index for the species contributing to the two compared weight classes. The bold figure 0.8 thus constitutes the Sørensen index based on the species found in weight class nr 8 (0.07-0.08 g) and 10 (0.09-0.1 g), respectively. In general terms, the index value 0.8 means that 80% of the species found in the two weight classes are the same.
Table 3.2. Sørensen similarity indices. Only indices with values equal to or higher than 0.6 are shown. Numbers 1-30 represent biomass weight intervals separated by 0.01; 0.02; 0.03; 0.04; 0.05; 0.06; 0.07; 0.08; 0.09; 0.1; 0.2; 0.3; 0.4; 0.5; 0.6; 0.7; 0.8; 0.9; 1; 2; 3; 4; 5; 6; 7 ; 8; 9; 10 and 20 g dry matter, respectively The Sørensen index is calculated as 2a/(2a+b+c) where a is the number of common species and b & c are the numbers of species only found in one of the two plots under comparison. If the value is above 0.6, more then 60% of the species are common. The matrix is filled out with few, scattered cells, where the index value was below 0.6.
Table 3.2 shows, that there is a high degree of similarity between the biomass samples with respect to weed species composition, and for most of the weight classes, there is more than 60% common species when compared in pairs. There is, based on these results, no reason to suspect any strong variation in ecological growth conditions between the experimental areas. This conclusion is corroborated by calculation of weighted Ellenberg indices, calculated for the same material. Based on the registered Ellenberg index values for the weed species contributing to the sub sample biomass values, and using the biomass of the individual species as importance value, the weighted Ellenberg indices for L, F, R and N were calculated. The results are presented in Figures. 3.3 and 3.4.
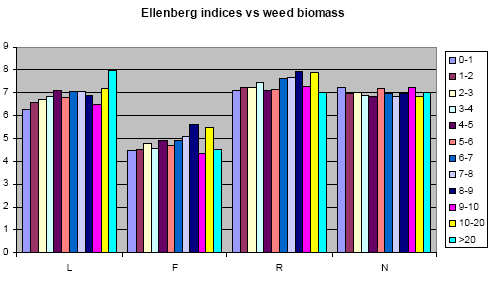
Figure 3.3. Compilation of Ellenberg indicator values (ranges1-9) of 12 biomass weight classes. L: Light, F: Humidity; R: pH (high value corresponds to high pH); N: Eutrophication with nitrogen compounds. The bars represent different weight classes between 0-1 g to >20 g biomass pr sample.
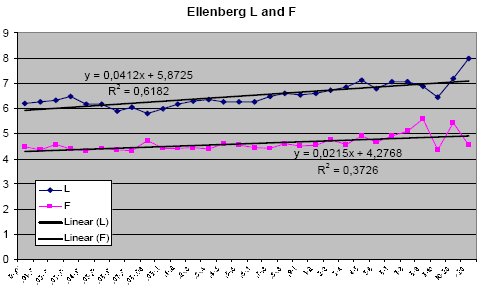
Figure 3.4. Weighted Ellenberg indices based on Ellenberg light (L; range: 1-10) and humidity (H; range: 1-10) indicator values for the weed species contributing to the biomass. Importance value: Biomass weight in g dry matter of the weed species. The x-axis is 30 weight classes from 0.01-0.02 to >20 g biomass. The F trend line slope is not significantly different form zero.
Based on the Ellenberg index results above, it may safely be concluded that no humidity gradient is present in the material. The humidity gradient was singled out, as this indicator in particular was believed to be of possible importance. A significant humidity gradient would have effect on the conclusions. In other words, high biomass values do not result from higher water availability, as the species composition of samples with high biomass does not reflect adaptation to a more humid environment.
3.1.1.4 Weed plant phenology related to harrowing frequency
Table 3.3 shows the results of the phenological studies 2004 and 2005.
Table 3.3. Statistical significant findings from the phenology analyses.
| Treatment | Number of species | Estimated relative frequencies | |
| Flowering plants/ all occurring plants |
Seedlings/ all flowering plants |
||
| 2 x harrowing | 10.0 | 0.52 | 0.11 |
| 4 x harrowing | 8.1 | 0.38 | 0.16 |
The number of species was significantly higher (25%) after only 2 x harrowing compared with 4 x harrowing. The relative frequency of flowering plants (the ratio flowering plants versus all recorded plants) was also highest (14% higher) by 2 x harrowing, while the number of seedlings was highest (5%) by 4 x harrowing. No clear conclusion with respect to harrowing frequency could be made concerning the relative frequency of seed producing plants; the results from 2004 and 2005, respectively, were contradictory.
3.1.1.5 Pin-point analyses of crops and weeds
In 2004, pin point analyses were made in all the fields after two and four harrowings. The analyses were done shortly after second harrowing and shortly after fourth harrowing, respectively. The number of times (out of the maximum 100) the pin touched either a crop or a weed shoot, respectively, was noted. One frame was analysed at all of the 11 subplots. The average values of the recorded pin-point frequencies are shown in Table 3.4. The weed data in Table 3.4 are based on hits on several species, but no distinction is made here.
Table 3.4. The average number of pin-point hits (=pin pont frequencies in %) of crops and weed plants. Frame size 1 m² with a 10 cm mesh, givng a theoretical maximum of 100 hits per stop.
| After 2 harrowings Crop |
After 4 harrowings Crop |
After 2 harrowings Weed |
After 4 harrowings Weed |
|
| Asnæs | ||||
| Four harrowing plots | 15 | 40 | 1 | 1 |
| Two harrowing plots | 14 | 47 | 0 | 2 |
| Viskingegård | ||||
| Four harrowing plots | 9 | 36 | 0 | 2 |
| Two harrowing plots | 10 | 31 | 1 | 3 |
| Vibygård SØ | ||||
| Four harrowing plots | 55 | 30 | 12 | 3 |
| Two harrowing plots | 58 | 30 | 7 | 7 |
| Vibygård NV | ||||
| Four harrowing plots | 50 | 35 | 4 | 2 |
| Two harrowing plots | 60 | 27 | 3 | 2 |
| Oremandsgård | ||||
| Four harrowing plots | 34 | 28 | 3 | 2 |
| Two harrowing plots | 36 | 30 | 3 | 3 |
| Gl. Oremandsgård | ||||
| Four harrowing plots | 60 | 43 | 18 | 10 |
| Two harrowing plots | 53 | 45 | 20 | 39 |
The plots received four or two harrowings, and all the plots were analysed when the fourth harrowing had taken place at the ‘four harrowing plots’.
The effect on the crop is marginal when inceasing the harrowing from two to four times (Table 3.4), but the effect on the weed abundance is seen in two cases: Gl. Oremandsgård (39 versus 10) and Viby SØ (7 versus 3), the former showing the strongest effect. The pattern, however, is complex, and the number of weed hits too few, so the conclusion is not statistically significant.
3.1.1.6 The effects of weed harrowing on polyphagous arthropod predators
Data from the soil flooding method were analysed using two statistical models. One model analysed if there were differences in arthropod densities between two-harrowing plots and the plots receiving three and four weed harrowings (the basic model 2). The other model included covariates (model 3). A covariate is e.g. weed biomass, which was included in the analysis in order to explain indirect (or hidden) effects behind the results obtained by the basic statistical model. Such an effect could e.g. be a higher weed occurrence in two-harrowing plots, which may influence the predator densities.
Using model 2 significant numerical responses of weed harrowing were found for Linyphiidae, Tachyporus and the sum of the four groups of polyphagous predators analysed (Table 3.5). For the carabids Agonum and Bembidion no significant effects of weed harrowing were revealed. In all significant cases higher arthropod densities were found at two weed harrowings compared to three and four harrowings (Figure 3.5). The effects of year and the interaction weed harrowing ´ year were not significant in any cases (Table 3.5), implying that the effects of weed harrowing could reliably be analysed independently of year effects.
Table 3.5. Results of the statistical tests of the density effect of three and four weed harrowings compared to simultaneous densities in two-harrowing plots of common polyphagous predators in spring wheat using the basic statistical model on soil flooding data (model 2).
| Harro- wing |
Factor | Significance (P) | ||||||||
| Agonum | Bembidion | Linyphiidae | Tachyporus | Total | ||||||
| Three | Weed harrowing | 0.4697 | 0.1127 | 0.0196* | 0.0331* | <0.0001*** | ||||
| Year | 0.2954 | 0.3884 | 0.9870 | 0.7405 | 0.9952 | |||||
| Weed harrowing´Year | 0.1348 | 0.1778 | 0.6529 | 0.2013 | 0.4133 | |||||
| Four | Weed harrowing | 0.1146 | 0.1149 | 0.0025** | 0.0320* | 0.0434* | ||||
| Year | 0.0591 | 0.1865 | 0.7346 | 0.5556 | 0.7963 | |||||
| Weed harrowing´Year | 0.7250 | 0.7042 | 0.8377 | 0.8808 | 0.6069 | |||||
*P < 0.05, **P < 0.01, ***P < 0.001
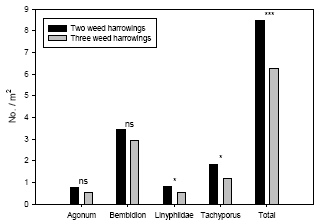
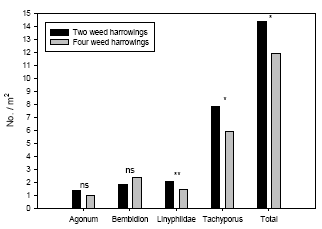
Figure 3.5. Estimated densities (Least-squares means based on the basic statistical model) of common polyphagous predators in spring wheat following three and four weed harrowings compared to simultaneous densities in two-harrowing plots. Notice the different scales on the ordinates. ns P > 0.05, *P < 0.05, **P < 0.01, ***P < 0.001.
Using model 2 the estimated densities of Linyphiidae were 51% higher at two weed harrowings compared to three harrowings. For Tachyporus this difference was 54% and for the sum of polyphagous predators a 35% higher density was found in two-harrowing plots (Figure 3.5). Following four weed harrowings the densities for Linyphiidae was 46% higher in two-harrowing plots, 32% higher for Tachyporus and 21% higher at two weed harrowings for the sum of predators (Figure 3.5).
The statistical analysis comparing the relative effects of three and four weed harrowings on arthropod abundance (model 4) revealed that there was no significant difference (P = 0.081), indicating that the relative effect on arthropod densities was the same for the third and fourth weed harrowing.
The effect of fourth weed harrowing however, may partly be explained by carry over effects from the third harrowing. Using estimates from the basic statistical model the densities of the arthropod predator complex following 3rd weed harrowing were 8.5 per m² in the two-harrowing plots and 6.3 per m² in the plots receiving three weed harrowings (Figure 3.5). Following fourth weed harrowing the predator density in two-harrowing plots was 14.4 per m² and 11.9 per m² in the plots receiving four weed harrowings. In two-harrowing plots that was a 70% increase in predator density for the time period from the third harrowings to the time period of the fourth harrowings (or 5.9 individuals per m²) and in plots receiving four harrowings that was a corresponding 90% increase (or 5.63 individuals per m²). This means, that the relative increase in arthropod densities from the time following third harrowing to the time following fourth harrowing was higher in four-harrowing plots despite the extra harrowing and the corresponding absolute increases in predator densities was approximately the same for both treatments despite the fourth harrowing. The higher relative increase in predator densities in the four-weed harrowing plots can mainly be referred to a factor four increase in Tachyporus density compared to a factor three increase in two-harrowing plots.
Model 3 included four covariates: ‘2nd weed harrowing’, ‘distance’, ‘weed’ and ‘crop’ in order to explain part of the statistical variation. ‘2nd weed harrowing’ is density of arthropod predators following 2nd harrowing. This covariate adjusts for the natural density variation within each experimental field before the third and the fourth harrowings were carried out. ‘Distance’ is the loge-transformed distance in meters to the nearest perennial vegetation from the sampling sites. This distance may affect the predator distribution within the field with fewer arthropod predators at increased distance to perennial vegetation. ‘Weed’ and ‘crop’ are the vegetation biomasses in g per sample of 0.15 m². The amount of vegetation, which in this case is measured as biomass, may affect the predator abundance.
Model 3 revealed that the third weed harrowing had a direct negative effect on densities of Linyphiidae, Tachyporus and the total number of predators (as the basic model 2) which could not be explained by the covariates because the factor ‘weed harrowing’ was still significant for these predator groups (P < 0.05) even the four covariates were included in the model (Table 3.6).
Table 3.6. Results of the statistical tests of the density effect of three and four weed harrowings compared to two weed harrowings on common polyphagous predators in spring wheat using the full statistical model including covariates on soil flooding data. Covariates with P > 0.1 were omitted from the analysis.
| Harro- wing |
Factor | Significance (P) | ||||||||
| Agonum | Bembidion | Linyphiidae | Tachyporus | Total | ||||||
| Three | Weed harrowing | 0.7356 | 0.1251 | 0.0493* | 0.0278* | 0.0003*** | ||||
| Year | 0.3094 | 0.4327 | 0.9789 | 0.8444 | 0.6810 | |||||
| Weed harrowing ´Year | 0.1712 | 0.1881 | 0.7070 | 0.0576 | 0.1732 | |||||
| 2nd weed harrowing a | 0.0140* | 0.0377* | - | 0.0027** | 0.0002*** | |||||
| 2nd weed harrowing ´Year | - | - | - | - | 0.0630 | |||||
| Distance* | - | - | - | - | - | |||||
| Distance´Year | - | - | - | - | - | |||||
| Weeda | 0.4003 | - | 0.0300* | <0.0001*** | 0.0009*** | |||||
| Weed´Year | 0.0096** | - | - | - | - | |||||
| Cropa | <0.0001*** | - | - | <0.0001*** | <0.0001*** | |||||
| Crop´Year | - | - | - | - | - | |||||
| Four | Weed harrowing | 0.6220 | 0.1042 | 0.0125* | 0.1799 | 0.3221 | ||||
| Year | 0.0565 | 0.5357 | 0.7624 | 0.0830 | 0.9725 | |||||
| Weed harrowing ´Year | 0.6880 | 0.8848 | 0.8893 | 0.7305 | 0.6815 | |||||
| 2nd weed harrowing a | - | - | - | - | - | |||||
| 2nd weed harrowing ´Year | - | - | - | - | - | |||||
| Distancea | <0.0001*** | - | - | 0.0587 | 0.0351* | |||||
| Distance´Year | 0.0008*** | - | - | 0.0502 | - | |||||
| Weeda | <0.0001*** | 0.1064 | 0.0084** | 0.0002*** | <0.0001*** | |||||
| Weed´Year | - | - | - | 0.0896 | - | |||||
| Cropa | <0.0001*** | 0.0244* | - | <0.0001*** | 0.0010** | |||||
| Crop´Year | 0.0008*** | 0.0426* | - | - | - | |||||
a Covariate
*P < 0.05, **P < 0.01, ***P < 0.001
Following three harrowings estimated Linyphiidae density based on model 3 adjusted for covariate effects were 43% higher in two-harrowing plots compared three weed harrowings. For Tachyporus this difference was 40% and for the sum of polyphagous predators the difference was 29% (Figure 3.6).
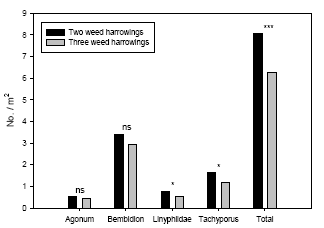
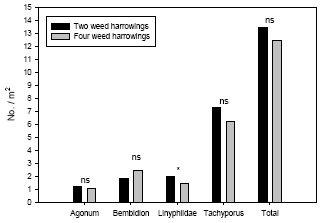
Figure 3.6. Estimated densities (Least-squares means based on the full statistical model including covariates) of common polyphagous predators in spring wheat following three and four weed harrowings compared to simultaneous densities in two-harrowing plots. Notice the different scales on the ordinates. ns P > 0.05, *P < 0.05, ***P < 0.001.
The third weed harrowing had indirectly a significant negative effect on predator densities because the covariate ‘weed’ was significantly and positively related to the densities of Agonum, Linyphiidae, Tachyporus and the sum of predators, although for Agonum there was an interaction with year (Table 3.6).
The parameter estimates revealed that when weed biomass increased with 1 g per sample (or 6.67 g per m²) the densities of Linyphiidae, Tachyporus and the sum of predators increased between 8% and 19% after the third weed harrowing (Table 3.7). For Agonum there was a positive relationship between weed biomass and carabid density in 2004 (+20% per g biomass) and a negative relationship in 2005 (- 10% per g drymass) (Table 3.7).
Table 3.7. Parameter estimates of covariates included in the full model statistical tests (see Table 3.6). Covariates with P > 0.1 were omitted from the analysis.
| Harro- wing |
Covariate | Parameter estimate ± 95% confidence limits | ||||
| Agonum | Bembidion | Linyphiidae | Tachyporus | Total | ||
| Three | 2nd weed harrowing | 0.271±0.216 | 0.174± 0.165 |
- | 0.276±0.180 | - |
| 2nd weed harrowing ´Year |
- | - | - | - | 2004: 0.105± 0.156 2005: 0.317± 0.160 |
|
| Distance | - | - | - | - | - | |
| Distance´Year | - | - | - | - | - | |
| Weed | - | - | 0.122± 0.110 |
0.192±0.066 | 0.082± 0.048 |
|
| Weed´Year | 2004: 0.200±0.126 2005: -0.102±0.192 |
- | - | - | - | |
| Crop | 0.124±0.030 | - | - | 0.101±0.022 | 0.053± 0.015 |
|
| Crop´Year | - | - | - | - | - | |
| Four | 2nd weed harrowing | - | - | - | - | - |
| 2nd weed harrowing ´Year |
- | - | - | - | - | |
| Distance | - | - | - | - | -0.173± 0.161 |
|
| Distance´Year | 2004: -1.607±0.692 2005: -0.203±0.423 |
- | - | 2004: -0.430±0.331 2005: 0.001±0.287 |
- | |
| Weed | 0.084±0.036 | 0.025±0.030a | 0.043± 0.032 |
- | 0.049± 0.016 |
|
| Weed´Year | - | - | - | 2004: 0.067±0.023 2005: 0.025±0.042 |
||
| Crop | - | - | - | 0.018±0.007 | 0.010± 0.006 |
|
| Crop´Year | 2004: 0.055±0.022 2005: 0.010±0.014 |
2004: -0.001±0.015 2005: -0.025±0.018 |
- | - | - | |
a Not significant (P = 0.1064 - Table 3.6)
The covariate ‘crop’ was positively related to densities of Agonum, Tachyporus and total number of predators after the third weed harrowing. When crop biomass increased with 1 g per sample the densities of these three predator groups increased between 5% and 12% (Table 3.7). The effect of weed on arthropod densities was in all cases higher than the effect of crop at the time following third weed harrowing except for Agonum in 2005 (Table 3.7).
Model 3 including covariates revealed that the fourth weed harrowing only had a direct negative effect on densities of Linyphiidae (Table 3.6) (or carry-over effect from third weed harrowing – see discussion). This means the significantly negative effect of weed harrowing on Tachyporus and the total predator complex found by model 2 following the fourth weeding indirectly can be explained by the covariates in model 3. The density of Linyphiidae adjusted for covariate effects was 38% higher in two-harrowing plots compared to four-harrowing plots (Figure 3.6).
After the fourth harrowing the covariate ‘weed’ was significantly and positively related to all predator groups except for Bembidion where the positive relationship was not significant (Table 3.6), revealing a significant negative effect of removing weed biomass, hence an indirect effect of harrowing on the predator groups. The parameter estimates showed that when weed biomass increased with 1 g per sample the densities of predators increased between 3% and 8% at the time when the fourth weed harrowings were carried out (Table 3.7).
The covariate ‘crop’ was positively related to densities of Agonum, Tachyporus and total number of predators after the fourth weed harrowing and negatively related to Bembidion. The crop biomass however, interacted with the factor ‘year’ for the carabids Agonum and Bembidion (Table 3.7) revealing that the effect was not uniform between years. When crop biomass increased 1 g per sample the densities of Agonum, Tachyporus and total number of predators increased between 0% and 6% (Table 3.7). When crop biomass increased 1 g per sample the density of Bembidion was unaffected in 2004 but decreased 3% in 2005.
The effect of weed was in all cases higher than the crop effect on polyphagous predators at the time following the fourth weed harrowings (Table 3.7).
Following the third weed harrowing the covariate ‘2nd weed harrowing’ (which adjusts for the natural density variation within each experimental field before the third and fourth weed harrowing was carried out) was significant for four out of five analysed arthropod groups with the exception being Linyphiidae (Table 3.6). The covariate ‘distance’ (the loge-transformed distance in meters to the nearest perennial vegetation) was not significant in any case after the third weed harrowing (Table 3.6). It is possible that an effect of distance was already explained indirectly by the covariate ‘2nd weed harrowing’. In order to test that, ‘2nd weed harrowing’ was excluded before other model reductions in supplementary analyses using model 3. This however did not result in significant effect of ‘distance’, although the estimates in most cases were negative (Table 3.8), indicating a reduced number of predators at increased distance.
Table 3.8. Test values and estimates for the effect of the covariate ‘distance’ following third weed harrowing using a reduced model were the covariate ‘2nd weed harrowing’ was excluded before other model reductions (model 3).
| Arthropods | Estimate for distance ± 95% confidence limits |
Significance (P) | |
| Agonum | -0.350±0.547 | 0.2078 | |
| Bembidion | -0.168±0.216 | 0.1260 | |
| Linyphiidae | -0.011±0.398 | 0.9569 | |
| Tachyporus | 0.036±0.305 | 0.8180 | |
| Total | -0.022±0.162 | 0.7938 | |
Following the fourth weed harrowing the covariate ‘2nd weed harrowing’ was no longer significant in any case (Table 3.6). Instead the covariate ‘distance’ was significant and negatively related to densities of Agonum and the total number of predators, although there was interaction with the factor year for Agonum, implying that the effects was not uniform both years (Tables 3.5 and 3.6). The relationship between arthropod density and distance is illustrated in Figure 3.7.
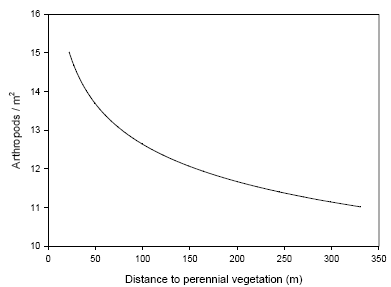
Figure 3.7. Illustration of the relationship between distance to the nearest perennial vegetation and density of the arthropod complex of polyphagous predators analysed. Only distances relevant for the described investigations are presented. Densities are not directly comparable with other arthropod densities presented due to simplicity of the illustration (back-transformed mean arthropod density vs. mean distance with the parameter estimate of distance following four weed harrowing as slope (Table 3.7).
In all cases the relative direct effect of weed harrowing was reduced in the full model (model 3) compared to the basic model (model 2) whether two weed harrowings were compared to three or four weed harrowings.
3.1.1.7 Pitfall trapping of arthropods in 2004
Pitfall trapping did generally not reveal any effect of weed harrowing, which was not found by soil flooding. Following three harrowings a significant effect of treatment was found for Tachyporus only (P = 0.002), with estimated 0.45 beetle per trapping day in two harrowing plots and 0.30 beetle in plots harrowed three times. Following four weed harrowings the factor treatment was only significant for Linyphiidae (P = 0.011), with 1.68 spiders per trapping day in two harrowing plots and 0.96 spider in plots harrowed four times.
3.1.1.8 Vegetation effect on arthropod abundance
In order to investigate the positive plant–arthropod relationships revealed in section 3.1.1.6 further, data of weeds and crop were analysed in a model excluding the direct effect of weed harrowing (models 6 and 7). The data used comprised data from two-harrowing plots only and were collected in late May and early June (the time following the 4th harrowing in the opposite field halfs) to make sure that the plots had not been weed harrowed recently thereby reducing the disturbance of weed harrowing on the analysis. Results of the statistical analyses are presented in Table 3.9.
Table 3.9. Results of the statistical tests of the relationship between vegetation biomass and densities of polyphagous predators in spring wheat using the statistical model 7.
| Factor | Significance (P) | ||||||||
| Agonum | Bembidion | Linyphiidae | Tachyporus | Total | |||||
| Year | 0.0287* | 0.5909 | 0.6657 | 0.3742 | 0.9674 | ||||
| Distancea | 0.0006*** | - | - | 0.3331 | 0.1510 | ||||
| Distance´Year | 0.0017** | - | - | 0.2733 | - | ||||
| Weeda | <0.0001*** | 0.0099** | 0.1807 | 0.0018** | 0.0008*** | ||||
| Weed´Year | - | - | - | 0.1160 | - | ||||
| Cropa | 0.0003*** | 0.3333 | - | <0.0001*** | <0.0001*** | ||||
| Crop´Year | 0.0025** | 0.0842 | - | - | - | ||||
a Covariate
*P < 0.05, **P < 0.01, ***P < 0.001
Weed and crop biomasses were also in this analysis related to predator densities because the covariates ‘weed’ and ‘crop’ (g biomass per sample of 0.15 m²) had highly significant effects on densities of Agonum, Bembidion (except ‘crop’), Tachyporus and the sum of predators (Table 3.9).
Parameter estimates of the covariates are presented in Table 3.10. For Agonum, Bembidion, Tachyporus and the predator complex there was a significantly positive relationship with weed biomass (Table 3.10). Arthropod densities increased between 2% and 8% every time weed the biomass increased 1 g per sample (or 6.67 g per m²) (Table 3.10).
Table 3.10. Parameter estimates of covariates included in the statistical model of the analysis of the relationship between vegetation biomass and densities of polyphagous predators in spring wheat (see Table 8). Covariates with P > 0.1 were omitted from the analysis.
| Covariate | Parameter estimate ± 95% confidence limits | ||||
| Agonum | Bembidion | Linyphiidae | Tachyporus | Total | |
| Distance | - | - | - | - | -0.178±0.243 |
| Distance´Year | 2004: -1.726±0.866 2005: -0.107±0.521 |
- | - | 2004: -0.292±0.416 2005: 0.001±0.388 |
- |
| Weed | 0.084±0.038 | 0.042±0.032 | 0.026±0.038 | - | 0.048±0.019 |
| Weed´Year | - | - | - | 2004: 0.067±0.025 2005: 0.023±0.050 |
- |
| Crop | - | - | - | 0.021±0.008 | 0.013±0.008 |
| Crop´Year | 2004: 0.047±0.024 2005: 0.005±0.013 |
2004: 0.005±0.019 2005: -0.020±0.024 |
- | - | - |
For Agonum, Tachyporus and the predator complex there was a significantly positive relationship with crop biomass with densities increasing between 0% and 5% at every crop biomass increase of 1 g per sample or 6.67 g per m². For the predator complex this increase was 1% (Table 3.10). The effect of weed was in all cases higher than the crop effect.
3.1.1.9 Estimating a non-linear vegetation-arthropod relationship
The data used for modelling the relationship between densities of the predator complex and vegetation biomasses excluding the influence of weed harrowing are presented in Appendix D. The result of the modelling (using model 8) is presented in Table 3.11.
Table 3.11. Estimated parameters for the model describing densities of the arthropod predator complex by vegetation biomasses and distance to perennial vegetation (model 8).
| Model Parameter |
Model | |
| Estimate | Std. | |
| α a | -7.82 | 2.49 |
| β b | 0.344 | 0.130 |
| βh c | 11.17 | 4.77 |
| γ d | 53.16 | 10.63 |
| δ e | 0.0181 | 0.0172 |
| σ2 f | 9.50 | 3.88 |
| -2 log Lg | 61.1 | |
| AIC h | 73.1 | |
| BIC i | 76.2 | |
| R j | 0.882 | |
a α = effect of distance to perennial vegetation
b β = effect of biomass
c βh = the amounth of biomass that result in an 50% effect
d γ = maximum density of arthropods
e δ = relative importance of wheat compared to weed
f σ² = residual variance
g -2 log L = - 2 log residual likelihood
h AIC = Akaike’s Information Creterion (Akaike, 1974)
i BIC = Schwarz Bayesian Information Creterion (Schwartz, 1978)
j R = Coefficient of correlation between predicted and observed values for the analyzed variable
The model can now be written as follows:

where:
Y = predicted predator density per m²
x = ln(distance in meters to perennial vegetation)
w = weeds (g biomass per m²)
c = crop (g biomass per m²)
In Figure 3.8 the observed number of arthropods is plotted against the numbers predicted by the model. In Figure 3.9 the predicted numbers of predators are shown for three combinations of the explanatory variable weed and crop biomasses and at three distances to perennial vegetation.
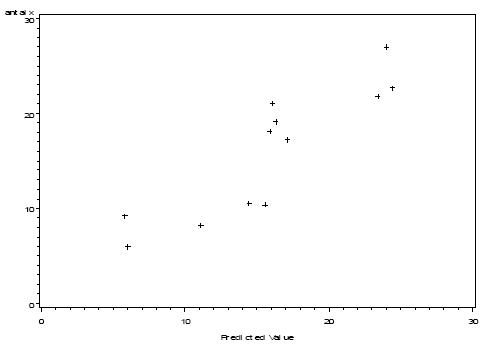
Figure 3.8. Plot of the arthropod numbers predicted by the model (X axis – no. per m²) with actual number of arthropods as response variable (Y axis - no. per m² )(r=0.88).
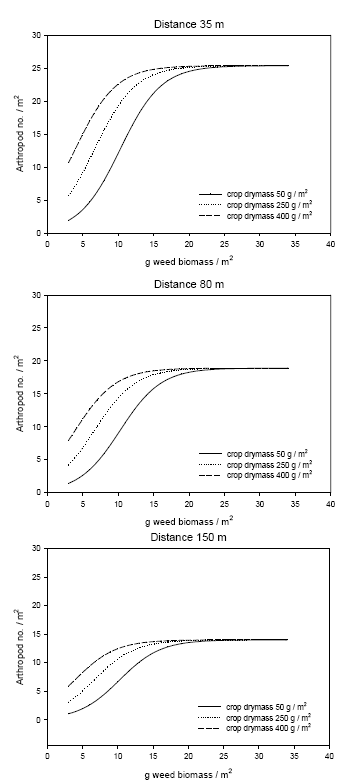
Figure 3.9. Predicted numbers of the polyphagous predator complex Agonum spp., Bembidion spp., Linyphiidae and Tachyporus spp. in spring wheat at increasing weed biomasses (dry masses) and at three distances to perennial vegetation (35, 80 and 150 m) and at three crop biomasses (50, 250 and 400 g / m²). The predictions are based on the data collected in late May and early June which are presented in Appendix D using the model presented in Table 3.11.
3.1.2 Field arena experiments
Using UV-light the positions of 80 A. dorsalis were recorded during the night observations 4 June. The results using the statistical model 9 showed an evenly distribution between the weeded and the un-weeded areas (53% vs. 47% respectively, Logit estimate = 0.1001, P = 0.6597). Only four B. lampros were seen, which was insufficient for further analysis.
On 5 June (day experiment) 273 beetles were recorded in total. Of these, 82 individuals were A. dorsalis with 68 being marked beetles. 191 were B. lampros of which 73 were marked beetles. On 11 June 191 beetles were recorded altogether with 48 being A. dorsalis and 143 being B. lampros. The results of the statistical analysis of the two day experiments are presented in Table 3.12.
Table 3.12. Summary of the statistical analysis on carabid presence on weed harrowed ground. Only the reduced models (using model 10) are presented.
| Parameter | 5 June | 11 June | ||||
| Logit estimate | Significance (P) | Logit estimate | Significance (P) | |||
| Both species (µ) | 0.0557 | 0.7374 | -1.0030 | 0.1076 | ||
| A. dorsalis (aA) | -0.2382 | 0.3340 | -1.4456 | 0.0049** | ||
| B. lampros (aB) | 0.3495 | 0.1002 | -0.6094 | 0.2154 | ||
| Species | 0.0351* | 0.0410* | ||||
| Time | -0.0836 | 0.0165* | -0.1522 | 0.1615 | ||
*P < 0.05, **P < 0.01
Table 3.12 shows that on 5 June there were no significant differences in beetle occurrence between weed harrowed and un-harrowed ground, neither for the sum of both species (µ) or for the individual species (aA and aB). However, the significant effect of difference between species indicates that there is some difference in preferences between the two species for weed harrowed and un-weeded soil. This difference is illustrated in Figure 3.10 which shows that the likelihood of finding beetles on weed harrowed ground is lower than 50% for A. dorsalis but higher for B. lampros. The significant effect of the parameter time on 5 June reveals that the percentage of recorded beetles on weed harrowed soil decreased during the day (Logit decreased by 0.0836 for every hour, Table 3.12). The vegetation biomass did not significantly influence the preferences of the beetles on 5 June in any case (P always > 0.05), and neither did any other variable analysed. If only the marked beetles recorded were analysed, the results did not differ either.
The statistical analyses of data from 11 June revealed that the probability of finding A. dorsalis on weed harrowed ground was significantly lower that 50% (Table 3.12, Figure 3.10). The probability of finding B. lampros on weeded ground was not significantly different from 50% (Table 3.12) although the estimated probability of finding the beetles was lower on weed harrowed ground (Figure 3.10). For the sum of both species there was no significant difference in preference either (Table 3.12, Figure 3.10). The significant effect of the parameter species indicates that there is some difference in preferences between species (Table 3.12), with a higher percentage of A. dorsalis preferring un-weeded ground compared to B. lampros. No of the other variables analysed were significant (P > 0.05).
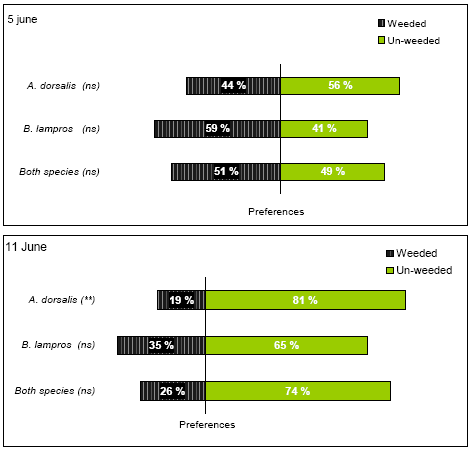
Figure 3.10. Preferences of the two common carabids A. dorsalis and B. lampros for non-weeded and newly weed harrowed spring wheat. Preference is defined as the likelihood of encountering beetles on weeded and un-weeded ground respectively. The results presented are based on two experiments carried out the 5 June and 11June. ns P > 0.05, **P < 0.01.
The results from the combined statistical analyses of the two experiments using model 11 are presented in Table 3.13. For A. dorsalis and the sum of both species there was a significantly lower preference for weed harrowed ground (Table 3.13, Figure 3.11). For B. lampros, the probability of finding the beetles on weeded ground did not differ significantly from 50% (Table 3.13), although the estimated preference for weed harrowed field was lower (Figure 3.11).
Table 3.13. Summary of the statistical analysis (model 11) of the two experiments (5 June and 11 June combined on carabid presence on harrowed ground. Only the reduced model is presented.
| Parameter | Logit estimate | Significance (P) |
| Both species (µ) | -0.4498 | 0.0136* |
| A. dorsalis (aA) | -0.7891 | 0.0135* |
| B. lampros (aB) | -0.1105 | 0.3876 |
| Both species 5 June (p5. June) | 0.0422 | 0.7740 |
| Both species 11 June (p11. June) | -0.9418 | 0.0050** |
| Date | <0.0001*** | |
| Species | 0.0377* | |
| Species ´ Date | 0.6971 | |
| Time | -0.1078 | <0.0001*** |
* P < 0.05, **P < 0.01, ***P < 0.001
The combimed analysis showed that on 11 June the sum of both species had a significant lower preference for un-weeded ground (Table 3.13, Figure 3.11), a significance which was not found when data from 11 June was tested separately (Table 3.12). Furthermore there were significant effects of the parameters date, species and time. The significant effect of species verified a difference in preference between the two species and the significant effect of time revealed that the percentage of beetles found on the weeded parts declined for every hour the sampling was carried out (Logit dropped 0.1078 for every hour – Table 3.13). No other variables analysed were significant (P > 0.05).
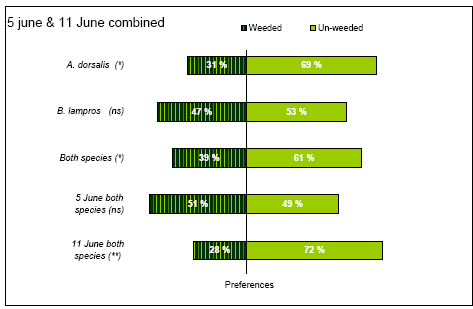
Figure 3.11. Preferences of the two common carabids A. dorsalis and B. lampros for non-weeded and newly weed harrowed spring wheat. Preference is defined as the likelihood of encountering beetles on weed harrowed and un-weeded ground respectively. The preferences presented are based on two experiments carried out the 5 June and 11 June and analysed in the same statistical model (model 11). ns P > 0.05, *P < 0.05, **P < 0.01.
3.2 Birds
3.2.1 Skylark
A total of 46 active Skylark nests were found in 2004, and 58 were found during the extended search period in 2005. The fate of the nests in each plot and year are summarized in Appendix B1. Fifty (48%) of the nests found were successful (one or more young left the nest), while 33 nests were predated, 15 were destroyed by weed harrowing and 6 failed for other reasons.
Seventeen known, active nests were exposed to weed harrowing (one of them to two harrowings). The fate of these nests is summarized in Table 3.14. In 15 cases (83%) the nest was completely lost; all eggs were removed, crushed or buried by the harrowing. Two of these nests contained 4 to 7 days old chicks, which were killed by the harrow (one of the chicks was still alive, albeit dying, two days after the event). Only in 3 cases, the nest survived, but the number of eggs/young was reduced. At the egg/young level, 55 out of 63 (87%) were destroyed while only 13% survived the harrowing.
Table 3.14. Summary of the fate of Skylark nests exposed to weed harrowing. Harrowing no. 2 was performed 11-14 May, no. 3 between 20 and 28 May and no. 4 between 30 May and 10 June.
| Weed harrowing no. | Contents at time of weed harrowing |
No. of nests exposed | Fate |
| 2 | Eggs | 3 | 3 nests destroyed |
| 3 | Eggs | 5 | 4 nests destroyed 1 nest survived: 1 egg gone, 3 intact eggs incubated |
| 4 | Eggs | 7 | 6 nests destroyed 1 nest survived: 1 egg gone, 2 intact eggs incubated |
| Eggs or newly hatched chicks | 1 | 1 nest survived: 3 chicks OK, 1 egg/chick gone | |
| Chicks | 2* | 2 nests destroyed: nestlings dead, moribund or removed |
* One of the nests had previously survived weed harrowing no. 3 (q.v.)
Weed harrowings performed = 37 days after sowing only affected known Skylark nests in two cases, whereas nests were generally exposed when harrowing was carried out = 40 days after sowing.
Rather few nests were established before mid-May, and in both study years the majority of Skylark nests were established between 15 May and 11 June (Figure 3.12). New nests were established at least until mid-July, but a clear second peak in July, corresponding to presumed second clutches, was not apparent.
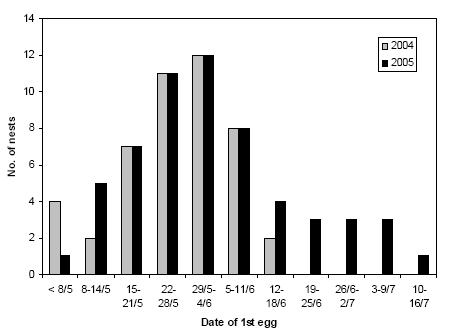
Figure 3.12. Phenology of the establishing of Skylark nests on the study fields in 2004 and 2005. If a nest was found with a full clutch or with young, date of first egg was estimated from the age of the nestlings and/or the date of hatching. Notice that in 2004, nest searches stopped 3 to 4 weeks earlier than in 2005.
The density of Skylark nests and the number of eggs laid did not differ between plots that were exposed to two times weed harrowing and plots that were harrowed four times (Table 3.15). However, the number of hatchlings and the number of young leaving the nest were significantly higher in “2 harrowings” plots than in “4 harrowings” plots, indicating a higher success rate of each breeding attempt in plots that were only harrowed twice. It should be noticed that the densities in the table are minimum values (because a number of nests were certainly missed) and that first and second breeding attempts could not be distinguished with certainty and therefore were pooled.
Table 3.15. The estimated mean number of nests, eggs and chicks per ha in plots exposed to two and four times weed harrowing. Estimations and tests were based on model 13.
| No. of weed harrowings | 2 | 4 | Significance (P) |
| No. of nests per ha | 0.64 | 0.54 | 0.46 |
| No. of eggs per ha | 2.42 | 2.09 | 0.55 |
| No. of hatchlings per ha | 1.46 | 0.69 | 0.0041 |
| No. of fledglings* per ha | 1.14 | 0.40 | 0.0025 |
* Chicks leaving the nest, although still flightless at this stage
Thirty-seven out of 57 Skylark nests (65%) found in “2 harrowings” plots were successful, while this was the case in only 13 out of 47 nests (28%) found in “4 harrowings” plots. The difference in success rate is significant (P = 0.0013, model 12). By contrast, the number of fledglings per successful nest did not differ between treatments (2.89 and 2.92 in plots exposed to 2 and 4 weed harrowings, respectively).
Because the two first weed harrowings were carried out simultaneously in plots harrowed two and four times, treatment-related differences should not be manifest until after the third harrowing. To reflect this, comparisons between treatments should be restricted to nests that were active at the third harrowing or later. This constraint excluded 7 nests in “2 harrowings” plots and 2 nests in “4 harrowings” plots and increased the difference in success rate between treatments: 74% of the 50 nests in “2 harrowings” plots were successful, while only 29% of 45 nests were successful in “4 harrowings” plots (P < 0.001, model 12).
Not surprisingly, significantly more nests were destroyed by weed harrowing in “4 harrowings” plots than in “2 harrowings” plots: 26% vs. 5% (P = 0.044, model 12). However, weed harrowing mortality only accounted for part of the difference in breeding success between treatments; predation rates were also significantly higher in plots that were harrowed four times than in plots that were harrowed only twice (Table 3.16).
Table 3.16. Rate of predation on Skylark nests in plots exposed to 2 and 4 weed harrowings. Statistical significance of treatment effects on daily predation rates was tested using model 14.
| No. of weed harrowings | No. of nests | No. of nest-days | No. of nests predated | Daily predation rate | Estimated predation rate (23 days)* | Significance (P) 2 vs. 4 harrowings |
| 2 | 57 | 824 | 14 | 1.70 % | 33 % | 0.016 |
| 4 | 47 | 480 | 19 | 3.96 % | 61 % | |
| Data restricted to nests active at 3rd weed harrowing or later: | ||||||
| 2 | 50 | 802 | 10 | 1.25 % | 25 % | 0.0047 |
| 4 | 45 | 471 | 17 | 3.61 % | 57 % | |
* Calculated as 1 – (1 – daily predation rate)23
Besides the difference between plots exposed to two and four weed harrowings, it appears from Table 3.16 that predation rates were lower when only nests active at the time of the third harrowing or later were included. In fact, the daily predation rate for early nests (nests established with 1st egg no later than 20 May) was as high as 4.89% (based upon 21 nests, 184 nest-days, all plots pooled), corresponding to a total predation risk of 68% for these early nests.
It was not specifically studied which predator species were involved, but the main predator on the nests was probably Hooded Crow Corvus (corone) cornix that was frequent on most of the study fields. Predation from Crows was most important early in the breeding season when the nests were fairly easily visible. In June-July, Marsh Harrier Circus aeruginosus seemed to be an important nest predator on some of the study fields. In addition, some predation was certainly due to mustelids and other mammals.
3.2.2 Lapwing
A total of 15 and 21 Lapwing nests were found on the experimental fields in 2004 and 2005, respectively. In addition, 41 nests were found on the Vibygård study fields in 2006, and 13 Lapwing nests were found on the two Kalø fields in 2004-05. The fate of the nests on each field and treatment plot are summarized in Appendix B2. Out of the 90 nests, 47 were completely unsuccessful (all eggs lost), but in 38 nests one or more young hatched successfully and a further 5 nests were still being incubated at the end of the registration period.
By far the most frequent cause of nest failure was farming operations (27 losses, 16 because of weed harrowing, 11 because of other soil treatments). Ploughing, harrowing and rolling proved completely destructive as all nests and eggs exposed to one of these treatments were lost.
Twenty-eight active nests were exposed to one or more weed harrowings. Twelve of these nests were completely destroyed (all eggs crushed) after one harrowing. The fate of each of the other 16 nests is summarized in Table 3.17.
Table 3.17. Summary of the fate of the 16 Lapwing nests that were exposed to weed harrowing without being completely destroyed. An additional 12 nests were destroyed and abandoned after one weed harrowing.
| Year | Farm / Field | Nest ID | Contents before harrowing |
Date of harrowing1) |
Contents after harrowing |
| 2004 | Vibygård NV | B-1 | 3 eggs | 14.05 | 2 eggs gone, 1 intact egg incub. |
| B-2 | 4 eggs | 14.05 | 2 eggs gone, 2 intact eggs incub. | ||
| B-3 | 4 eggs | 14.05 | 1 egg crushed, 3 intact eggs incub. | ||
| B-4 | 4 eggs | 14.05 | 1 egg crushed, 3 intact eggs incub. | ||
| Oremandsgård | O-2 | 4 eggs | 11.05 | Nest destroyed; 1 egg gone, 1 crushed. 2 intact eggs incub. in re-established nest |
|
| 2005 | Asnæsgård | A-0 | 2 eggs | 20.04 2) | 2 intact eggs incub. |
| 2 eggs | 29.04 | Nest and eggs completely destroyed | |||
| A-1 | 4 eggs | 20.04 2) | 4 intact eggs incub. | ||
| 4 eggs | 06.05 | 2 eggs broken, 2 intact eggs incub. | |||
| Vibygård NV | B-3 | 4 eggs | 14.05 | 2 eggs gone, 2 slightly damaged eggs incub.4) | |
| B-4 | 4 eggs | 14.05 | 3 eggs gone, 1 intact egg incub. | ||
| 1 egg | 20.05 3) | Nest destroyed, abandoned. 1 egg c. 30 cm from nest, apparently intact | |||
| B-5 | 4 eggs | 14.05 | 3 eggs gone, 1 intact egg incub. | ||
| B-6 | 4 eggs | 14.05 | 1 egg gone, 2 broken, 1 slightly damaged. Incubated. | ||
| 3 eggs (2 broken) | 20.05 3) | Nest and eggs completely destroyed | |||
| B-10 | 4 eggs | 14.05 | 4 eggs more or less damaged; incub. | ||
| 4 eggs (+/– damaged) |
20.05 3) | 1 egg gone, 1 newly hatched chick, 2 partly broken eggs, incub.5) | |||
| B-11 | 4 eggs | 14.05 | Eggshell fragments – eggs crushed, predated or hatched ? | ||
| Viskingegård | V-1 | 3 eggs | 14.05 | Nest destroyed, 2 eggs intact, 1 slightly damaged. All 3 incub. in re-established nest 6) | |
| Kalø / Krovang | KR 616.33 | 3 eggs | 04.05 | 3 intact eggs incub. | |
| 3 eggs | 12.05 3) | Nest and eggs completely destroyed | |||
| 2006 | Vibygård / 5+6 | V-35 | 4 eggs | 27.05 | Nest destroyed, eggs intact but scattered. All 4 eggs later incub. in re-established nest |
1) First weed harrowing after crop emergence unless stated otherwise
2) Pre-emergence weed harrowing
3) Second weed harrowing after crop emergence
4) Both survived until time of hatching
5) One of the partly broken eggs maybe hatched
6) All 3 eggs hatched
If successive harrowings of the same nest are treated as separate events, and one nest (B-11) with unknown fate is omitted, the outcome of 33 monitored cases where a Lapwing nest was exposed to weed harrowing may be summarized as follows: 16 nests (48%) were completely destroyed (all eggs lost), 12 nests (36%) were partially destroyed (one or more viable eggs remaining, nest incubated), and 5 nests (15%) were intact (nest intact or re-established, all eggs viable, incubated). At the egg level, 116 eggs were exposed to weed harrowing; 66% of these were destroyed while 34% survived.
In several nests, more or less damaged eggs were still incubated after weed harrowing. At least in 3 cases, one or more of the foetuses were still viable:
- B-3 (2005): Incubated c. 20 days when exposed to weed harrowing. Two eggs were left in the nest after harrowing; one with just one, tiny hole, the other with 2-3 small holes. Four days later, the former was in the process of hatching and clear cheeps were heard from the egg with 2-3 holes (indicating a live young about to hatch).
- B-10 (2005): Incubated c. 18 days when exposed to weed harrowing for the first time. All 4 eggs were affected, the damage varying from tiny holes to dents c. 1 cm in diameter. The next weed harrowing was performed 6 days later, and on the following day the nest contained one newly hatched chick and two partly broken eggs. Three days later, one partly broken egg was left; the other egg possibly hatched or had been removed.
- V-1 (2005): Exposed to weed harrowing c. 3 days after the clutch was complete. All 3 eggs survived, one of them with a small crack in the shell, and the nest was re-established. On the day after harrowing, the eggs were cold when visited in late morning, but incubation was resumed one hour later. All eggs hatched successfully 24 days after weed harrowing.
The mean reproductive output per nest in relation to the number of post-emergence weed harrowings and the crop is shown in Table 3.18. Five nests (one in “1 harrowing” plots, 4 in “0 harrowings” plots) containing a total of 18 eggs were still incubated when the registrations were stopped and have been omitted from the table; these nests probably had a fair chance of being successful, thus increasing the mean reproductive output per nest.
Table 3.18. The number of Lapwing chicks (hatchlings) per nest in relation to the number of post-emergence weed harrowings and the crop. Nests abandoned with one egg and nests where the reproductive output was unknown (mainly because they were still incubated when the registrations stopped) have been omitted.
| No. of post-emergence weed harrowings | 0 | 1 | 3 | ||
| Crop | Spring-sown wheat | Spring oats with undersown grass | Perennial grass | Spring-sown wheat | Spring-sown wheat |
| No. of nests | 12 | 11 (8) 2) | 15 | 19 1) | 15 |
| No. of successful nests | 8 | 8 (8) | 12 | 4 | 5 |
| Mean no. of hatchlings per nest | 2.42 | 2.27 (3.13) 2) | 2.80 | 0.58 | 0.70 |
| Mean no. of hatchlings per successful nest | 3.63 | 3.13 | 3.50 | 2.75 | 2.10 |
1) Two nests placed in areas that were not harrowed according to schedule have been omitted.
2) 7 nests established before ploughing have been omitted. Figures in brackets also exclude nests that were established in the 5 day period between sowing and rolling.
Obviously, breeding success was greatly reduced in plots where one or more weed harrowings were performed, compared to untreated plots. The number of hatchlings per nest as well the number of hatchlings per successful nest were reduced, the latter because of partial destruction of clutches by harrowing. It appears that the success rate was higher in plots that were subject to three post-emergence harrowings than in plots that were only subject to one harrowing, but 4 of the 5 successful nests in “3 harrowings” plots were in fact only exposed to one harrowing, as the second harrowing after crop emergence on the field in question did not take place until 1 June and hatching occurred 21-29 May. Because Lapwings breed early in the season, the first weed harrowing after crop emergence is the main cause of harrowing-induced nest mortality. Out of 16 recorded nest losses due to weed harrowing, 13 were caused by the first harrowing after crop emergence and only 3 were caused by later harrowings.
In 2004 and 2005, systematic observations did not start until late April, after the emergence of the crop. This implies that nest mortalities caused by the pre-emergence weed harrowings performed between 12 and 25 April (4 to 17 days after sowing) were generally not recorded. On Asnæsgård in 2005, two Lapwing nests were found during exploratory field visits in mid-April. In these nests the first egg had been laid no later than 5 days after sowing. Both nests were exposed to a pre-emergence harrowing on 20 April and survived (cf. Table 3.17). On the other fields, no breeding Lapwings were discovered at exploratory visits around 20 April (1-2 weeks after sowing). However, on 26 April at Vibygård a nest was found with two broken and two intact eggs, probably damaged by the weed harrowing performed 8 days earlier.
On the Kalø fields, where pre-emergence harrowings were not carried out, only one or two of the 13 Lapwing nests found in 2004-05 were established before emergence of the crop (estimated from date of hatching) and would thus have been vulnerable to early weed harrowings.
In 2006, observations at Vibygård began on 7 April. The timing of the establishing of Lapwing nests varied between fields (Figure 3.13). On the two fields that were ploughed and sown in mid-April, no nests were established until early May, immediately after crop emergence (Figure 3.13 C). Thus, on these fields the nests were probably not exposed to the pre-emergence weed harrowings carried out. Contrary to this, on the large field lying as harrowed stubble until 22 April, at least 7 nests were established during the first half of April. These nests were all destroyed during soil preparation works (cf. Table 2.3). An additional 3 nests were established immediately after sowing and were destroyed by rolling 5 days after sowing. After this, 8 nests (most of them probably replacement clutches) were established within one week after rolling (12 days after sowing) and were all successful as no weed harrowings were carried out. On the perennial grassland acting as a reference area without any soil treatments, all first nesting attempts were established early, before 20 April (most of them during the first week of April), while later nests were probably replacement clutches after the first clutch had been predated or abandoned.
In at least 12 of the 90 nests found, predation was the primary cause of nest failure. Two more clutches were predated but were probably abandoned beforehand, and a further 6 clutches were partially predated as one or two eggs disappeared during incubation. In two of the 12 completely failed nests the clutch was predated over time, one or two eggs being removed between successive nest control visits until no eggs were left.
Predation rates varied greatly between fields, even on a local scale. For example, on Kalø in 2005 all Lapwing nests on the Keglehøj field were predated while all nests on the nearby Krovang field survived. However, data are too sparse to allow a detailed analysis of predation rates so only a few gross estimates can be made (Table 3.19). It appears from this table that predation rates on cereal fields and perennial grassland were rather similar and that an estimated 23% of all Lapwing nests were lost to predators while 12% of nests were partially predated.
Table 3.19. Rates of predation on Lapwing nests on the study areas. Nests abandoned early (with one egg) and nests with unknown cause of failure have been omitted from the calculations. Complete/partial predation refers to predation of whole clutch/part of the clutch, respectively.
| Crop | No. of nests / nest-days | No. of nests completely / partially predated | Daily predation rate complete / partial |
Estimated complete predation rate (30 days)* |
Estimated partial predation rate (30 days)* |
| Spring cereals | 65 / 1056 | 10 / 4 | 0.95 / 0.38 % | 25 % | 11 % |
| Perennial grass | 18 / 324 | 2 / 2 | 0.62 / 0.62 % | 17 % | 17 % |
| Total | 83 / 1380 | 12 / 6 | 0.87 / 0.43 % | 23 % | 12 % |
* Calculated as 1 – (1 – daily predation rate)30
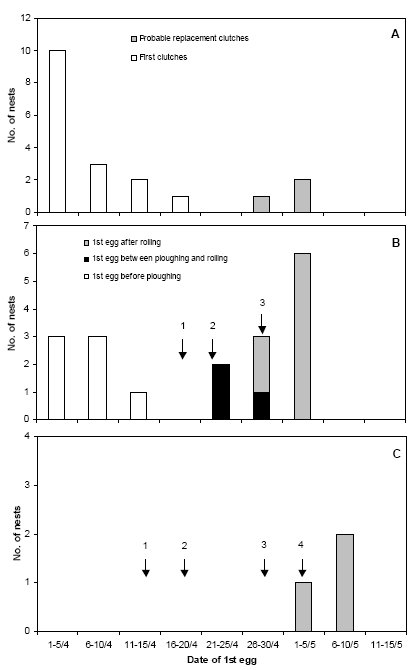
Figure 3.13. The timing of the establishing of Lapwing nests in relation to soil treatments on the study fields at Vibygård in 2006. A: Perennial grass (no soil treatments). B: Spring-sown oats with undersown grass (1: coarse rolling, 2: ploughing followed by harrowing and sowing, 3: rolling). C: Spring-sown oats (1: ploughing, 2: sowing, 3: 1st weed harrowing, 4: 2nd weed harrowing). The oat fields were lying as harrowed stubble until ploughed. In B, one late nest (found with 4 eggs 27 May) has been omitted.
3.2.3 Oystercatcher
A total of 7 Oystercatcher nests were found (Table 3.20). Only two clutches hatched successfully while one nest was completely destroyed by weed harrowing and four were predated. Two of the predated nests had been partially destroyed by weed harrowing and were maybe abandoned before they were predated.
Table 3.20. Summary of the fate of the Oystercatcher nests found on the study fields. No nests were found in 2006.
| Year | Farm / Field | No. of eggs | Date of 1st egg (estimated) |
Date of weed harrowing | Fate |
| 2004 | Asnæsgård | = 2 | = 27.04 | 28.04 1) | = 1 egg destroyed, 1 egg intact, incub.2) Predated 7-12 days later |
| Kalø / Krovang | 2 | 02.05 | – | Hatched (2 chicks) | |
| 2005 | Asnæsgård | 3 | 29.04 - 04.05 | 05.05 1) | All eggs apparently intact, incub. Predated 19-24 days later |
| Gl. Oremandsgård | = 2 | 21-22.05 | 25.05 | = 1 egg destroyed, 1 egg apparently intact, incub.? Predated 3-9 days later, maybe abandoned beforehand | |
| Vibygård SØ | 3 | 2-3.05 | 13.05 | 1 egg gone, 2 eggs strongly damaged but incub. Predated 2-6 days later, maybe abandoned beforehand | |
| Kalø /Krovang 3) | 4 | = 25.04 | 04.05 | Completely destroyed by harrowing | |
| 3 | 12-15.05 | – | Hatched (2 chicks) |
1) Nest found on the day after harrowing
2) In re-established nest 10-15 cm from destroyed nest
3) Successive breeding attempts by the same pair
Three nests were monitored before and after weed harrowing. One of these nests was completely destroyed (all eggs lost) while the other two were partially destroyed by harrowing and may well later have been abandoned. In addition, two surviving nests were found after weed harrowing, one with 1 egg intact, the other with 3 eggs intact (Table 3.20); however, such nests should not be included in the calculation of loss and survival rates in relation to weed harrowing (cf. section 2.3.3).
The mean reproductive output was 2.0 hatchlings per nest in untreated plots and zero in plots that were subject to weed harrowing.
The daily predation rate was as high as 2.02 %, even when the two nests where predation was possibly secondary are omitted from the calculation. This is equivalent to an estimated predation rate of 46% of nests.
3.3 Weed control
3.3.1 Six field trials with repeated weed harrowings
The effect of repeated weed harrowings in spring barley has been evaluated in the selected trials described in section 2.4.1.1, and Dansk Landbrugsrådgivning concluded that an increasing number of harrowings did not increase the crop yield in spring barley (Petersen 2002).
In all eight trials, a pre-emergence weed harrowing was combined with one to four post emergence harrowings. The pre-emergence harrowing took place five days after sowing, the additional post emergence harrowings were planned to take place 7, 14, 21 and 28 days after sowing, respectively. For all eight trials the crop yield as well as the time of sowing and harrowing was reported, and for six of the eight trials the crop and weed density 14 days after the last treatment (primo/medio June) was also reported. Unfortunately the weed biomass and the intensity of harrowing were not reported.
Table 3.21 shows the effect of mechanical weeding in the selected spring barley trials.
Table 3.21. Effect of mechanical weeding in spring barley.
3.3.1.1 Yield and net yield
It is shown in Figure 3.21, that the average untreated yield is 48.4 hkg and that the highest yield, with at 0.8 hkg yield gain, is obtained by a pre-emergence harrowing plus two times post emergence harrowing. Three or more post emergence harrowings will result in a moderate 0.3-0.6 hkg yield loss. When the weeding costs are taken into account, none of the treatments are profitable. At a cost of 65 DKK per pre- and post-emergence harrowing, the increasing number of harrowings will raise the net yield loss from 1.5 to 4.6 hkg per ha. On average the mechanical weeding per se is not profitable. In this way the most efficient strategy is the one reducing the weed to a given level, involving as few harrowings as possible.
Figure 3.14 shows the net yield gain from post emergence harrowing in spring barley.
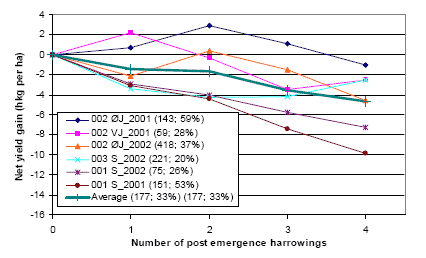
Figure 3.14. Net yield gain from post emergence harrowing in spring barley
Untreated weed density and average reduction in weed density pr. harrowing MSM is shown in parenthesis for each trial ID.
Source: Landsforsøg 2001 and 2002 (Petersen 2006, Link)
It is shown that one or two post emergence harrowings have been profitable or almost profitable for three out of six trials. For the other three trials, the net effect of mechanical weeding is negative. In these cases, the costs are increasing with the increased number of harrowings. Unfortunately there is no obvious correlation between the profitability of the treatments and weed density, and the weeding effect of the individual treatments. This indicates that in some cases, the mechanical weeding damage overrules the positive effect of reducing a high weed density, or that a high and untreated weed density not always causes a reduction in crop yield. On average a shift from a one post-emergence harrowing strategy to a three post-emergence harrowing strategy will increase the reduction in weed density from 40% to 70% and increase the weeding net cost by 1 hkg (80 DKK or 11€) per ha.
3.3.1.2 Effect on weed density
It is also shown (figure 3.14) that the first treatment reduced the crop density by 4%, the dicot weed density by 35%, and the grass weed density by 64%. In total, four post emergence harrowings have reduced the crop density by 16%, the dicot weed density by 81%, and the grass weed density by 84%.
The effect of each treatment can be calculated in many ways. A simple average effect per treatment can be calculated by dividing the total reduction by the number of treatments, and the effect can be calculated as a minimum survival effect by using the minimum survival method (MSM). According to Table 3.21 (third dicot weed column) the simple average reduction in the weed density is decreasing from 35% to 20% by increasing the number of treatments, whereas the MSM average reduction in the weed density (the fourth column) is stable and around 35%. This indicates that each post emerge harrowing reduces the remaining weed density by 35%. The average reduction per treatment calculated by using the MSM model is almost constant. This indicates that the MSM model is a god model for describing the harrowing weeding effect. It also indicates that the pre-emergence (blind) harrowing or (less likely the first post emergence harrowing) has none or little effect on the weed density. It is well known that pre-emergence weed harrowing has none or little effect on the crop, but it is also found, e.g. Rasmussen (2007), that pre-emergence harrowing in combination with post emergence harrowing has a modest and varying effect on the weed biomass. Although the pre-emergence harrowing in some cases effectively reduces the emerged weed, it also able to brings more new weed seeds to germinate.
It is found that, on average, each post-emergence harrowing reduces the weed density by 33%. In order to investigate the variation of effectiveness from trial to trial and from treatment to treatment, the total relative reduction in weed density and the logarithm to the total relative survival (100% - total relative reduction) of weed plants is shown in figure 3.15 and 3.16.
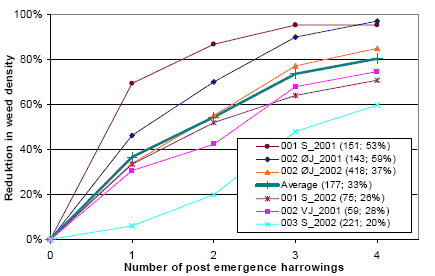
Figure 3.15. Total reduction in weed density from post emergence harrowing in spring barley. Untreated weed density and average reduction in weed density pr. harrowing (MSM) is shown in parenthesis.
Source: Landsforsøg 2001 and 2002 (Petersen 2006, Link).
It is shown (figure 3.15) that there is a huge variation in the weeding effect of post emergence harrowings. In one of the trials, a single post emergence harrowing was able to reduce the weed density by 70%, whereas in another trial four post emergence harrowings were needed to get a 60% reduction. It is also shown that high and low reductions in weed density cannot be explained alone by region (S, ØJ and VJ) or weed density (shown in parentheses).
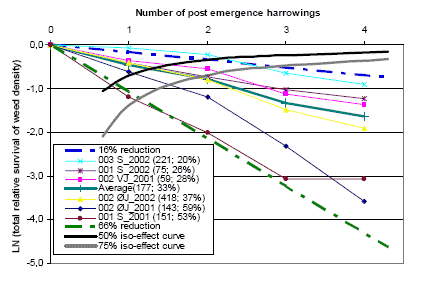
Figure 3.16. Total relative survival of weed plants for post emergence harrowings in spring barley. Untreated weed density and average reduction in weed density pr. harrowing MSM is shown in parenthesis.
Source: Landsforsøg 2001 and 2002 (Petersen 2006, Link).
It is shown (figure 3.16) that the logarithms to the total relative survival (100% - total relative reduction) of the weed density for all the trials are almost a linear function of the number of harrowings. The almost linear effect curves indicate that the MSM model is also a god model to describe the effect of repeated harrowings in individual trials. The two dashed, bold lines indicate the 66% and 16% reduction per harrowing curves. The effect of the post emergence harrowing varies from trial to trial, whereas for each trial the effect of the individual harrowings is almost constant (not varying). In other words, if the first post emergence harrowing offers a god or bad effect, the second, third, and fourth harrowing will most likely present the same god or bad effect. The bold black and gray lines indicate the 50% and 75% reduction in the weed density iso-curve. The lower the effect per harrowing, the more harrowing is needed to get a 50 or 75% reduction in the weed density. In case of the highest effect, less than one (0.8) post harrowing is needed, and in case of the lowest effect, more than two (2.2) harrowings are needed to reduce the weed density by 50%. In five of six trials, two post emergence harrowings have resulted in a 50% or higher reduction in the weed density. In all six trials three post emergence harrowings have resulted in a 75% or higher reduction in the weed density.
3.3.1.3 Effect on crop density
Also crop density is affected by mechanical weeding. Table 3.18 shows that pre-emergence harrowing plus one post emergence harrowing on average reduces the crop density by 4%, and each additional harrowing reduces the remaining crop density by 3-4%. On average, a pre-emergence harrowing plus four post emergence harrowings reduce the crop density by 16%.
Figure 3.17 shows reduction in weed and crop density in spring barley as a result of mechanical weeding.
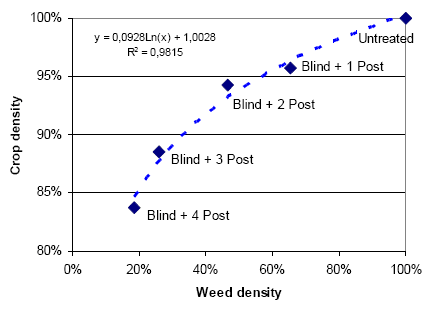
Figure 3.17. Reduction in weed and crop density in spring barley after mechanical weeding.
Source: Landsforsøg 2001 and 2002 (Petersen 2006, Link).
It is shown that weed density is much more affected by the harrowings than crop density, but it is also shown that an increased number of post emergence harrowings increases the crop damage – weed damage ratio. If it is the number of harrowings more than the intensity that causes the increased ratio, it might be an idea to perform a few but more intensive harrowings to control the weed.
3.3.1.4 Timing
It is a wide spread and often repeated assumption (e.g. Duval, 1997), that timing is alpha and omega for the weeding effect and crop damage caused by mechanical weeding. For instance, the crop is very resistant before the two-leave stage and most vulnerable in the two leave stage. Some weed spices are most resistant in the early growth stages and some are more resistant later on. The effect might also depend on the weather conditions before and after the treatment, and some treatments are able to bring more weed seeds to germinate.
Contrary to this, the above analyses (3.3.1.1 - 3.3.1.3) indicate that there is no significant timing effect. And also Rasmussen & Nørremark (2007, figure 2) found that the relative weed control (selectivity) by using post emergence harrowing in spring barley is unaffected by the crops growth stage (a two week interval from growth stage 12 to 21).
Unfortunately the selected trials do not include treatments with single pre- and post harrowings at different periods. And the first post emergence harrowings, if any, are always performed very early (7 days after sowing). By using the selected trials we can not measure the timing effect of the first post emergence harrowing. But the constant within-trial relative weed reduction (MSM)(table 3.21) and the almost straight lines in figure 3.16 indicates that timing is significantly not important for the weeding effect of at least the additional harrowings. This indicates that the post emergence harrowings, from the first to the last harrowing within each trial, independent of timing have the same relative weeding effect. In this way, the weeding effect of additional harrowings can be added up by using the MSM model, and the weeding effect of two or more post emergence harrowings can always be substituted by a single, more intensive post emergence harrowing. From a farm economic and environmental point of view, a single but intensive harrowing is optimal, and more than two harrowings, including the pre-emergence harrowing, is costly and inefficient. However, the selected data can not be used to verify whether or not timing is alpha and omega for the weeding effect of one intensive harrowing. Thus we can conclude that one intensive post emergence harrowing is optimal, and that this harrowing is expected to be an early harrowing.
Also the crop damage and crop yield may be influenced by intensity, frequency and timing of the weed harrowing. Figure 3.17 shows, that each harrowing, except for the second harrowing 14 days after sowing, reduces the spring barley plants by 5%. The harrowing 14 days after sowing seems to be less harmful than the earlier and later harrowings, and the barley is more likely to overcome the early damages by tillering etc. In that respect weed harrowings from 7 to 14 days after sowing, may be almost harmless to the crop yield. But due to shortcomings in the design of the selected field trials we can not be sure about the yield effect of intensity, timing and frequency of the weed harrowings.
As mentioned earlier, the timing of the harrowing is crucial for birds like the Lapwing and Skylarks, their nests, eggs, young and food (arthropod) for the young. Although the selected eight trials are limited to two years, no harrowings later than 28 days after sowing have been performed, these eight trials may possibly give an idea about how early the first harrowings can be carried out and how many harrowings can be performed in given periods in spring barley.
Table 3.22 sums up the timing and weeding effect of harrowing in spring barley.
Table 3.22. Timing and weeding effect of harrowing in spring barley.
| Pre emergence | 1. Post energence | 2. Post emergence | 3. Post emergence | 4. Post emergence | |||
| - Sowing - | -------------------------- Harrowing date ---------------------------- | ||||||
| 8 trials 2001-2002 | |||||||
| Day 0 | +5 days | +7day | +14days | +21days | +28days | ||
| First obs. | April 1. | April 8. | April 10. | April 20. | April 25. | May 7. | |
| Average obs. | April 13. | April 21. | April 24. | May 2. | May 12. | May 23. | |
| Last obs. | May 2. | May 7. | May 10. | May 17. | May 23. | June 14. | |
| 6 trials 2001-2002 | |||||||
| ------------- Average reduction in weed density ---------- | |||||||
| 37% | 54% | 74% | 80% | ||||
| Std.var. | (21%) | (23%) | (18%) | (15%) | |||
| ------------- Marginal reduction in weed density ---------- | |||||||
| 35% | 29% | 44% | 28% | ||||
| Std.var. | (21%) | (16%) | (17%) | (24%) | |||
Source: Landsforsøg 2001 and 2002 (Petersen 2006, Link).
It is shown that on average, the third post emergence harrowing was carried out the 12th of May, no later than the 23rd of May, and never before the 25th of April.
3.3.2 Modelling approach and more weeding trials
In this section even more but unbalanced fields trials data including chemical and mixed weeding strategies (presented in 2.4.1.2) are analysed primarily by using the complex of weed control models (presented in 2.5.1).
3.3.2.1 Weed harrowing calendar
The weed harrowing can be carried out at different periods relative to the time of sowing, the crop growth stage, the weed growth stage or the time of spraying with pesticides. Considering the Skylarks, weed harrowing should not be carried out more than 37 days after sowing and not after 20 May (see 4.2.1). The selected Landsforsøg have been used to investigate the timing of the harrowing.
Table 3.23 shows the planned and realised timing for harrowing used in the selected Landsforsøg weeding trials in spring barley.
Table 3.23. Planned and realised timing for harrowing in the selected weeding trials in spring barley 1999-2002.
| Planned treatments (timing) | Normal practice | Latest obs. |
| Barley st. 12-13 | primo-medio May | 10-May |
| Barley st. 12-14 | primo-medio May | 22-May |
| Barley st. 12-13 + 7 days | medio May | 23-May |
| Barley st. 21-25 | ultimo May | 28-May |
| Sowing + 7 days | primo May | 10-May |
| Sowing + 14 days | medio May | 17-May |
| Sowing + 21 days | ultimo May | 23-May |
| Sowing + 28 days | 1. June | 14-June |
| 5-7 days after spraying | medio May | 22-May |
| 8-10 days after spraying | medio May | 21-May |
| 16-18 days after spraying | ultimo May | 05-June |
Source: Selected Landsforsøg (Petersen 2006).
For each planned harrowing in the Landsforsøgene, the corresponding normal and latest observed timing has been deducted. The bold latest observations and treatments are those in conflict with the sky larks.
It is shown that only two types of treatments have been carried out later than the 1st of June. The treatments “Sowing + 28 days” and “16-18 days after spraying” (see also 2.4.1) are normally carried out the 1st of June and ultimo May, but in a few cases theses treatments were carried out the 14th and 5th of June, respectively. These late treatments were obtained for the fifth treatment in a five-treatment strategy, and for a combined strategy with pesticide spraying followed by a late (16-18 days) harrowing. None of the remaining mechanical strategies with less than five times harrowing (32 sites and more than 200 strategies/treatments) caused a treatment later than the 28th of May.
3.3.2.2 Standard weeding strategies
By using the above estimated model complex and the estimated local variation in crop density, yield and weeding conditions, etc., the weeding effect on weed biomass has been calculated for different herbicide and harrowing strategies. Not all of the strategies are tested in selected trials, but results are estimated by using the model complex. Table 3.24 shows the selected weeding strategies.
Table 3.24. Selected weeding strategies
| Strategy name | Short name | Pre-emergence harrowing | Herbicides | Post-emergence harrowing |
| --- No. --- | -- Treatment Freq. Index (TFI) -- | -- Crop soil cover (CSC) -- | ||
| Untreated | ||||
| Herb 0,1 TFI | Herb 0,1 | 0,1 | ||
| Herb 0,3 TFI | Herb 0,3 | 0,3 | ||
| Herb 0,5 TFI | Herb 0,5 | 0,5 | ||
| Herb 1,0 TFI | Herb 1,0 | 1,0 | ||
| Post 10% CSC | Post 10 | 10% | ||
| Post 20% CSC | Post 20 | 20% | ||
| Post 30% CSC | Post 30 | 30% | ||
| Pre | Pre | 1 | ||
| Pre + 1 x Post 10% CSC | Pre + 1 Post 10 | 1 | 10% | |
| Pre + 3 x Post 10% CSC | Pre + 3 Post 10 | 1 | 3 x 10% | |
| Pre + 1 x Post 20% CSC | Pre + 1 Post 20 | 1 | 20% | |
| Pre + 2 x Post 20% CSC | Pre + 2 Post 20 | 1 | 2 x 20% | |
| Pre + Herb 0,1 TFI | Pre + Herb 0,1 | 1 | 0,1 | |
| Herb 0,1 TFI + Post 20% CSC | Herb 0,1 + Post 20 | 0,1 | 20% | |
Figure 3.18 shows the estimated variation in weed biomass reduction for different mechanical weeding strategies in spring barley.
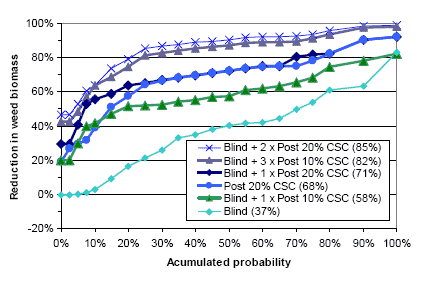
Figure 3.18. Estimated variation in weed biomass reduction for different mechanical weeding strategies in spring barley. Average reductions in weed biomass for 32 trials are shown in parentheses.
Source: Calculations on selected Landsforsøg (Petersen, 2006).
It appears that there is a great variation in the relative reduction in weed biomass for all the mechanical weeding strategies. A single pre-emergence harrowing with an average 37% reduction in weed biomass is obviously the least effective and least stable mechanical weeding strategy in spring barley. The more harrowings the higher is the relative reduction in weed biomass. A single 20% crop soil cover post emergence harrowing yields a reduction in weed biomass varying from 20 to 90%, and 68% on average. The combination of a pre-emergence harrowing and a 20% crop soil cover post emergence harrowing is, in most cases, as effective as the sole 20% crop soil cover harrowing. In some cases (less than 20% of the cases) the combination yields a 20% higher (50% instead of 30%) reduction in weed biomass, whereas, on average, the combination just yields a 3% higher reduction (71% instead of 68%). The combination of pre-emergence harrowing and one 10%, three 10% or two 20% crop cover post emergence harrowings on average yields a 58%, 82% and 85% reduction in the weed biomass, respectively. This indicates that one or two highly intensive (a high crop soil cover) harrowings are probably more (economically) efficient than three or more less intensive harrowings.
Figure 3.19 shows estimated variations in weed biomass reduction for different weeding strategies, including herbicides in spring barley.
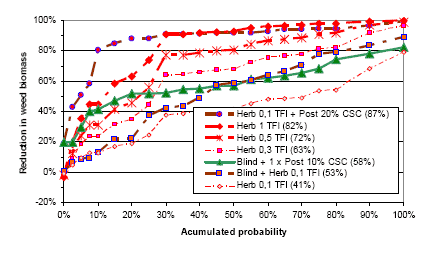
Figure 3.19. Estimated variation in weed biomass reduction for different weeding strategies, including herbicides in spring barley.
Average reductions in weed biomass for 32 trials are shown in parentheses.
Source: Calculations on selected Landsforsøg (Petersen, 2006).
It is shown that there is also a huge variation in the weeding effect of weeding strategies, including herbicides. The most effective strategies are the full dose herbicide strategy and the strategy combining a low herbicide dose and a 20% post emergence harrowing yielding an 87 and 82% reduction in the weed biomass. The least effective strategies are the 0,1 TFI low dose herbicide strategy and the strategy combining a pre-emergence harrowing and a low dose of herbicides, yielding a 41 and 53% reduction. Obviously, the weeding effect of the combination of herbicides and harrowing very much depends on the timing of the harrowing. On average they are as effective as the 0,3 TFI herbicide strategy, but used the right way, a low dose herbicides followed up by a harrowing at least a week or two after the spraying, the combination is more effective than a full dose of herbicides, or four to five intensive harrowings. The poor weeding effect of the pre-emergence harrowing followed by a low herbicide dose could, as also suggested by Petersen (2002), be caused by the pre-emergence harrowing causing new weed seed to germinate, and that the resulting new weed plants are not in the vulnerable two- leave state when herbicides are applied. The success of the low dose of herbicides followed by a post emergence harrowing could be that the weed plants surviving the herbicide treatment are retarded and weakened and thus more sensitive to the physical damage caused by the harrowing and easier to cover with soil when harrowing.
In order to pinpoint the most efficient strategy, one has to consider the costs of herbicides, spraying, and harrowing as well as yield reduction from harrowing, herbicides or weed. If there were no weed, the farmer could avoid weeding costs and yield losses from weeding. If there is a lot of weed, there will be a significant yield loss, or need for costly chemical and mechanical weeding, also damaging the crop. In the following economic analysis of the weeding strategies, the strategies are evaluated on their net cost for weed and weeding and their effect on the weed biomass. The price for a full herbicide dose (1 TFI) is set to 200 DKK per TFI. The price for spraying and harrowing is 65 DKK per ha, and the barley price is 80 DKK per hkg.
Figure 3.20 shows estimated net weed and weeding costs for a few effective weeding strategies in spring barley.
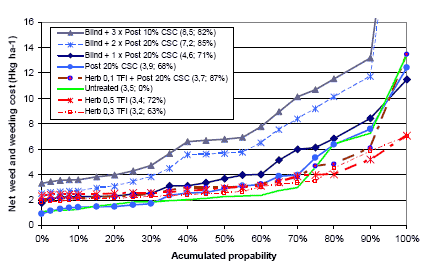
Figure 3.20. Estimated variation in net weed and weeding costs for a few effective weeding strategies in spring barley.
Average net cost and reductions in weed biomass for 32 trials are shown in parentheses.
Source: Calculations on selected Landsforsøg (Petersen, 2006).
It is shown, that there is a huge variation in the net weed and weeding cost for all the weeding strategies, however the 0.3 and 0.5 TFI herbicide strategies are significantly more stable than the strategies involving harrowing. The 0.3 and 0.5 TFI herbicide strategies and the untreated strategy are the cheapest strategies yielding a 3.2, 3.4 and 3.5 hkg per ha net cost. More harrowings results in significantly higher net weed and weeding cost. There is no correlation between net expences and the weeding effects. Some of the cheapest strategies, like the 0.5 TFI strategy, are very effective, whereas others, like the untreated strategy, have no effect at all. To pinpoint the most effective strategies both cost and effect has to be taken into account.
Figure 3.21 shows estimated net weed and weeding cost, and weeding effect for different weeding strategies in spring barley.
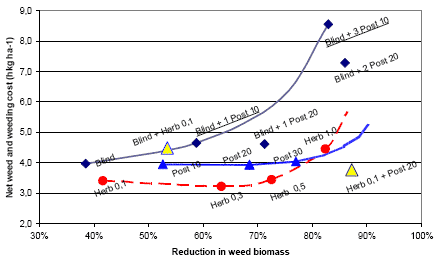
Figure 3.21. Estimated net weed and weeding cost, and weeding effect for different weeding strategies in spring barley.
Average net cost and reductions in weed biomass for 32 trials are shown in parentheses.
Source: Calculations on selected Landsforsøg (Petersen, 2006).
It is shown, that the net weed and weeding cost in most cases, except for herbicides, increase with increasing reduction in weed biomass. For the herbicide strategies, the total net cost has a minimum around the 0.3 TFI dose. In case of a required reduction in the weed biomass below 80%, the herbicide strategies are in general the most efficient strategies. If a higher reduction in the weed biomass is needed, the strategies involving post emergence harrowing, perhaps combined with low doses of herbicides, are more efficient. The 0.1 herbicide plus a 20% crop soil cover post emergence harrowing combination offer an extremely high reduction in the weed biomass, but it is a little more expensive (0.5 hkg or 40 DKK per ha) than the sole 0.3 or 0.5 TFI herbicide strategies. For farmers not using herbicides, a single intensive post emergence harrowing seems to be the most efficient strategy. A single 20-30% post emergence harrowing is more effective than the often recommended 0.3 TFI herbicide solution, indicating that such a strategy will yield the required weeding effect (70% is often supposed to be the required reduction in weed biomass).
3.3.3 Weed cost and yield loss
Yield loss is caused by weed and weeding. The yield loss from weed is often calculated as a simple difference between the full (or highest) herbicide dose yield and the less weed-controlled yield (e.g. Milberg & Hallgren 2004). In that case the controlled-weed yield and not the weed-free yield potential is the yield-loss reference. The yield loss from the surviving 20-25% weed biomass in the full dose reference is in this way “free” and not accounted for.
A new decision support system prototype for herbicides in spring barley taking care of the “free weed” problem has been tested in the Crop Protection Online (PVO) project (Jørgensen et al. 2007). In that prototype the short run economic objective is not just to maximize the net yield gain by controlling the weed, but to minimize the total weeding and weed costs. The optimal herbicide dose is unaffected, but the true cost of controlled as well as uncontrolled weed is exposed.
In Milberg & Hallgren (2004) and the Crop Protection Online (PVO) prototype the general weed yield-loss relations are set up regardless of crop density and varieties, soil type, and weed-free yield-potential etc. In Milberg & Hallgren each type of cereals has an individual (predictable) yield-loss relation, and in the Crop Protection Online (PVO) prototype each year and location has an individual (stochastic, not explained) yield-loss relation.
In the prototype the resulting fresh weed biomass (g ha-1) is a function of weed density (d), fresh weight (g) (g m-2) per weed plant, and the local (stochastic) weed conditions (T):
3.1) 
In spring barley the T-value is around 1.050 in the 15% fractal, 3.600 on average, and 12.600 in the 85% fractal. And the offset fresh weight per weed plant (g) is 10 g per weed plant per m² for an average mix of weed species. In the same prototype the yield loss (YL) (hkg ha-1) is a function of fresh weed biomass (w) (g m-2):
3.2) ![]()
By using the model complex, the yield loss depends on more than just the weed biomass, and the weed biomass itself also depends on a number of parameters. By using the model complex, the variety, seed density, weeding intensity etc has to taken into account. By using standard doses or economic optimal doses (Crop Protection Online) a 70-90% reduction in biomass is expected. Figure 3.22 shows estimated yield loss as a function of not controlled (untreated) weed biomass.
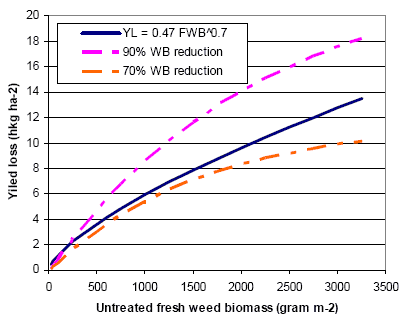
Figure. 3.22. Estimated yield loss in a 60 hkg yield potential, 250 crop plants per m-2 standard spring barley variety.
The figure shows, that an untreated 1.500 g fresh weed biomass will cause a 7, 8, or 11 hkg yield loss in case the losses are calculated by using the model complex at a low weeding intensity (70% effect, Yellow), the average Jørgensen et al. (2007) model (Blue, formula 3.1 and 3.2), or the model complex at a high weeding intensity (90% effect, Red) respectively. At a high weeding intensity, the controlled, but not weed free reference yield is higher, and thus the yield loss from not controlling the weed becomes higher. Apparently the simple yield loss (Blue) is very similar to the yield loss calculated by using the complex model on a standard barley variety with a normal yield potential (60 hkg) and seed rate (250 m-2) in case of no control and a (normally considered economically optimal) 70% reduction in the weed biomass. In scenarios where variety, seed rate, yield potential, and control measures (70% reduction) is not to be changed or discussed, the simple model (Blue line) might be as good as, and more handy, than the complex model. But we always have to remember, that the simple yield loss is not the loss compared to a weed free situation, but a situation where the weed biomass is reduced 70-80% by means of herbicides or mechanical weeding. The above figures show the yield effect caused by the barley-weed competition. The potential yield loss from using herbicides or mechanical weeding is not included in this figure and calculations.
3.3.4 Arthropods and weed costs
It is found that the number of arthropod predators (insects etc.) per m² is a function of the fields’ average weed biomass and the average distance to perennial vegetation (see 3.1.1.9). And the maximum number of arthropod is produced for a weed biomass around 15-20 g per m².
Figure 3.23 shows the estimated weed biomass as a function of weed density for a normal mix of weed species and normal (p=50%) as well as extreme weed conditions (p=15% and 85). The weed biomass is estimated by using functionality and findings from the Crop Protection Online (PVO) herbicide prototype (Jørgensen et al. 2007).
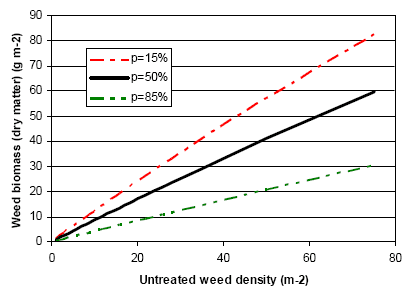
Figure 3.23. Weed biomass as a function of untreated weed density and varying weed conditions.
It is shown that in order to produce 15 g weed dry matter a weed density between 15 and 45 plants per m² is needed, depending on the weed species and the general growth conditions. A weed density around 10 to 35 plants per m² is needed to produce the maximum number arthropods, but a much higher initial weed density is of course required if the weed is controlled by herbicides or harrowing.
In order to assess the actual level of weed density and biomass in Danish fields, data from 128 field trials in spring cereals (Jørgensen et al. 2007) has been analysed (Figure 3.24). These trials are typically placed on well managed conventional arable clay soil farms on Zealand. These particular farms are considered to have low or moderate weed populations.
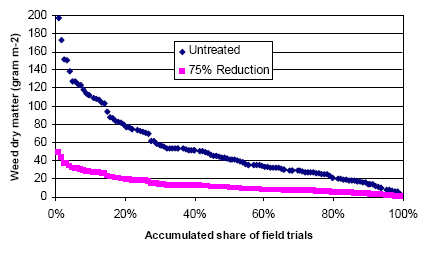
Figure 3.24. Distribution of untreated and treated (75% reduction) weed biomass (15% dry matter) for 128 spring cereal field trials.
The figure shows that almost 80% of the spring cereal fields have a sufficient untreated weed dry matter (>20 g) to insure a high density of arthropods. It is also shown, that in case of a 75% reduction in the weed biomass, less than 30% of the spring cereals fields can insure the highest density of arthropods.
Additional analysis (Figure 3.25) have shown, that 90% of these fields have an untreated weed density above 15, and 60% have a weed density above 50 plants per m².
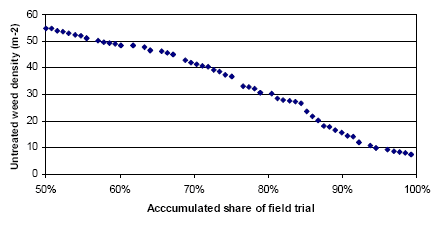
Figure 3.25. Distribution of untreated weed density for 128 spring cereal field trials.
All in all it can be concluded that even well managed conventional spring cereal fields on clay soil, in case of a reduced weed control, have a high potential for producing sufficient weed for a high arthropod predator density.
Figures 3.26 and 3.27 show weed and weeding costs (yield equivalent) estimated by using the complex of weeding models (2.5.1), and the Protection Online (PVO) prototype method (formula 3.1 and 3.2) with an average setting for weed species mix and weed growth.
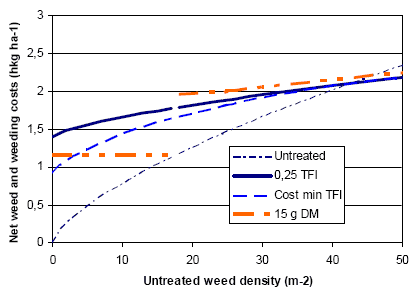
Figure 3.26. Weed biomass as function of initial untreated weed density.
Figure 3.26 shows the net weed and weeding costs in case of no weed control (Untreated), a cost minimizing herbicide strategy (Cost min TFI), a 0,25 TFI herbicide strategy, and a “15 g weed dry matter” strategy (15 g DM). Just in case of no weed and no weeding (Untreated) the net weed and weeding cost are zero. In most cases the net costs increases by increasing initial weed density. For weed deities below 40 plants per m² the no weeding strategy generates the lows net costs. On average a 17 plants per m2 weed density is required to produce 15 g weed dry matter and a high number of arthropods. At a density below 17 the “15 g dry matter” strategy requires that extra weed is “planted”. The extra plants results in more weed biomass and an extra yield loss, but weeding is not necessary. At a density above 17 the desired 15 g dry matter is produced by using reduced herbicides doses. The use of herbicides affords a spraying (result in a discontinuous curve) and the reduced (not optimal) dose and more surviving weed biomass, as in the case of the 0,25 TFI strategy, result in higher net costs.
Figure 3.27 shows the additional costs of producing the desired 15 g weed dry matter.
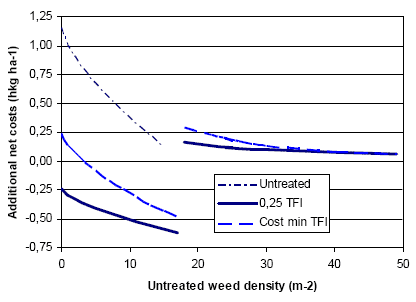
Figure 3.27. Additional net cost of producing 15 g weed dry matter relative to three different weeding alternatives.
It is shown that the additional cost of producing an average of 15 g weed dry matter depends on the initial weed density and the strategy used to produce the biomass. The additional cost (yield equivalent) of producing the desired 15 g weed dry matter at a weed density of 20 plants per m² is around 0.2-0.25 hkg (~ 2,3 € per ha) and the cost decreases to (and below zero) for an increasing weed density. In case of a very low weed density, the net costs of implantation the weed needed depends on the alternative strategy. If no weeding is the alternative the desired 15 g dry matter costs 1.25 hkg per ha (~12 € per ha), and if a 0.25 TFI herbicide strategy is the alternative, the net costs are negative.
In case of a low initial weed density, the weed biomass desired by the arthropods and sky larks can not be produced. But the above analysis have shown, that in case of a sufficient initial weed density the cost of producing more weed and to assure a high production of arthropods is very small (free or max 2,3 € per ha at the highest) and in practice insignificant for the farmer.
Additional analysis have shown that 20 and 25 g of weed dry matter also can be produced for free or at the highest for an extra cost of 0.33 and 0.5 hkg per ha (3.1 and 4.6 € per ha). Although it seems to be all most costless to produce more weed and arthropods, the farmer might still be worried about the long-run dynamic effect of producing more weed. Figure 3.28 shows the relative weed biomass reduction for different herbicide strategies.
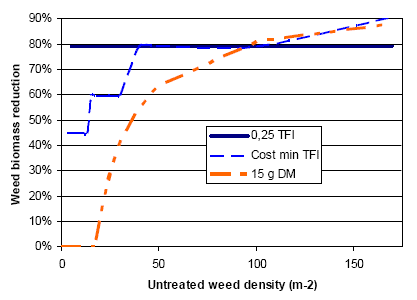
Figure 3.28. Weed biomass reduction for different herbicide weeding strategies.
It is shown, that the 0.25 TFI herbicide strategies secures a high 80 % reduction of the estimated weed biomass for all densities. Contrary to this, the “15 g weed dry matter” strategy results (not surprisingly) in a very low reduction in case of a moderate weed density. At a higher weed density the difference in weed reduction is however levelled-out.
The long run effect of a “15 g weed dry matter” strategy has not been analysed in details. But the long-run economic and dynamic effect of such a strategy will, as mentioned before, depend on the crop rotation and the weeding strategies used in the subsequent crops.
Version 1.0 August 2007, © Danish Environmental Protection Agency