Model assessment of reductive dechlorination as a remediation technology for contaminant sources in fractured clay: Modeling tool
3 Modeling TCE dechlorination
- 3.1 Reductive sequential dechlorination
- 3.2 Experimental data
- 3.3 Model implementation
- 3.4 Model parameters optimization
- 3.5 Coupling to the transport model
In this section, a mathematical model is developed to simulate TCE sequential dechlorination. The kinetic parameters used in the model are fitted to an experimental data set and the model is then verified using independent experimental data.
3.1 Reductive sequential dechlorination
Reductive TCE degradation occurs via the following pathway:
TCE → DCE → VC → ethene
DCE can be produced in different forms but cis-DCE form constitutes the main part (95%) of DCE produced by anaerobic reductive dechlorination [Bjerg et al., 2006]. Degradation is possible when electron donor (commonly H2) and dechlorinating bacteria are present (the only bacteria known to allow total degradation to ethene is Dehalococcoides Ethenogenes [Duhamel et al., 2002]).
The degradation models are described in detail together with a critical appraisal of the literature in Appendix A.
3.2 Experimental data
In order to test the models, it is useful to compare with experimental data. Two sets of experimental data are considered here:
- Laboratory experiments under “ideal conditions”, performed by Anne K. Friis during her PhD studies at DTU Environment [Friis, 2006], described in the following section.
- Laboratory experiments with field sediments and groundwater, corresponding to a treatability study performed in the context of reductive remediation [Jørgensen et al., 2007b], described in Appendix B.
3.2.1 “Ideal conditions” microcosm experiments
A detailed description of the experimental protocol can be found in Friis et al. [2007]. TCE was introduced in anaerobic serum bottles, together with the enriched dechlorinating culture KB-1TM and two different electron donors, lactate and propionate. TCE and its daughter product concentrations were measured at regular intervals during the experiments. These experiments have been performed at different temperatures, but the most interesting results for this study are those performed at 10°C, as it is representative of groundwater temperature in Denmark.
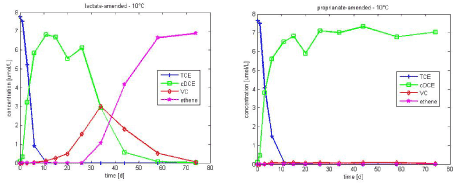
Figure 3.1 - Experimental data of TCE dechlorination in lactate and propionate-amended culture at 10°C
An example of the experimental data is present in Figure 3.1. Dechlorination was complete to ethene in the lactate-amended culture, within the time frame of the experiments (74 days), whereas dechlorination stalled to cis-DCE in propionate-amended culture. However complete dechlorination to ethene was observed in propionate amended culture at 15°C. As the purpose of this study is to determine typical kinetics parameters for TCE dechlorination with different electron donors, the experimental results at 15°C are also considered (see experimental data in Figure 3.2).
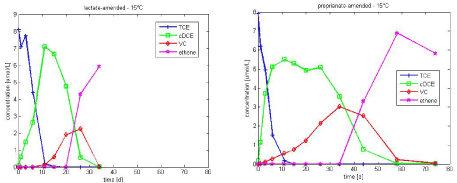
Figure 3.2 - Experimental data of TCE dechlorination in lactate and propionate-amended culture at 15°C
The type of electron donor is a very important, when looking at kinetics of TCE dechlorination. Hence the kinetics parameters vary for the lactate and propionate – amended experiments, with lactate amended resulting in a faster degradation to ethene (see Figure 3.1 and Figure 3.2).
3.3 Model implementation
As it is shown in Appendix A, several processes can be added to the basic Monod kinetic model to simulate sequential TCE dechlorination. Increasing the number of processes in the model leads to the addition of new parameters. In this way, the system of differential equations can become quite complex. The model developed in this study has to be a good compromise between accuracy and simplicity. In this context, the different processes described in Appendix A have been assessed to determine their importance. The mathematical model is based on modified Monod kinetic form that includes competitive inhibition, and the presence of two growing/decaying biomass groups. The detailed information can be found in Appendix C. The implementation of the chosen processes is described in the following section. The model parameters are then calibrated using the experimental data presented in Section 3.2.
Based on the selected relevant process and the mathematical formulation found in literature (and explained in Appendix A), TCE degradation is simulated with the following system of differential equations:
TCE concentration change in time:

DCE concentration change in time:

VC concentration change in time:

Ethene concentration change in time is calculated with a mass balance:
![]()
Group 1 of biomass (responsible for TCE degradation only) growth and decay:

Group 2 of biomass (responsible for DCE and VC degradation) growth and decay:
![]()
Where Ci is the concentration of chlorinated ethene i, µi is the maximal growth rate of i, Ki is the half-velocity constant of i, Ki,i is the inhibition constant of i, Xj is the biomass concentration of group j, Yj is the specific yield of biomass j and kdj is the decay rate of biomass j.
This mathematical model formed a system of ordinary differential equations with 5 variables and 13 parameters. This system is implemented in Matlab, which provides a solver for this type of mathematical problem.
3.4 Model parameters optimization
The model is used to simulate the experimental data presented in Section 3.2. In order to obtain a reasonable fit between the simulated and measured concentration values, parameter optimization is necessary. This optimization provides a set of parameters that can be used in the model to assess TCE degradation at a field site. Prior to this optimization, a sensitivity analysis was performed, in order to assess on which parameters the optimization should be focused. Hence seven parameters are considered in the optimization, the maximum growth rates (µTCE, µDCE and µVC), the specific yield (Y), the initial concentration of biomass 2 (X20), the decay constant of biomass 2 (kd2) and the half-velocity constant of DCE (KDCE). The details of the sensitivity analysis can be found in Appendix D.
3.4.1 Optimization on Friis et al. [2007] experimental data
Optimization is performed on experiments results with lactate as the electron donor at 10 and 15°C, allowing parameters to vary between the ranges found in literature. The resulting values are shown in Table 3.1 and the resulting curves in Figure 3.3. A good fit between experimental and simulated values is obtained. As expected, the maximum growth rates increase with temperature; this is in agreement with the conclusions of Friis et al [2007], except concerning TCE.
Table 3.1 - Final values for lactate-amended culture (in yellow, parameters which have been optimized). References for literature values are found in Appendix A.
| Units | Final values | Range in literature |
|
| µTCE 10°C | d-1 | 2.15 | 0.013 – 4.3 |
| µDCE 10°C | d-1 | 0.38 | 0.003 – 0.766 |
| µVC 10°C | d-1 | 0.14 | 0.003 – 0.737 |
| µTCE 15°C | d-1 | 1.26 | 0.013 – 4.3 |
| µDCE 15°C | d-1 | 0.66 | 0.003 – 0.766 |
| µVC 15°C | d-1 | 0.29 | 0.003 – 0.737 |
| KTCE | µmol·L-1 | 10 | 0.05 – 17.4 |
| KDCE | µmol·L-1 | 9.9 | 0.54 – 11.9 |
| KVC | µmol·L-1 | 2.6 | 2.2 – 602 |
| Ki,TCE | µmol·L-1 | 10 | 0.05 – 724 |
| Ki,DCE | µmol·L-1 | 3.6 | 1.8 – 600 |
| Ki,VC | µmol·L-1 | 7.8 | 2.6 – 602 |
| Y | cell·µmol-1 | 5.1*108 | 4.3*108 – 1.9*109 |
| kd1 | d-1 | 0.03 | 0.01 – 0.05 |
| kd2 | d-1 | 0.05 | 0.01 – 0.05 |
| X10 | cell·L-1 | 2*108 | - |
| X20 | cell·L-1 | 1*108 | - |
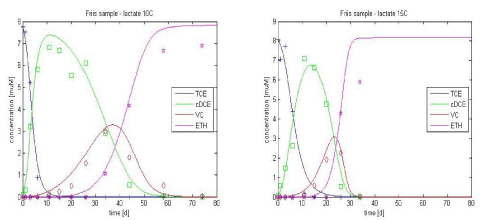
Figure 3.3 - Experimental data vs. simulated curves with optimal parameters for lactate-amended culture, at 10 and 15°C
The experimental results with propionate as the electron donor are then simulated using the optimized values from Table 3.1 with for the growth rate as independent parameter that is optimized. As complete degradation down to ethene is not observed at 10°C, the optimization is performed on the results at 15°C only. The resulting maximum growth rate values are shown in Table 3.2. As expected, the maximum growth rates are lower than for lactate, except for TCE. Furthermore, the fit for propionate is poorer than for lactate. This may be due to the fact that propionate-amended system does not adhere to the model assumption of unlimiting substrate [Friis et al., 2007]. Nevertheless the time scale of TCE degradation in a propionate-amended culture is well simulated by the given parameters.
Table 3.2 - Final values for propionate-amended culture (in yellow, parameters which have been optimized). References for literature values are found in Appendix A
| Units | Final values | Range in literature |
|
| µTCE 15°C | d-1 | 2.1 | 0.013 – 4.3 |
| µDCE 15°C | d-1 | 0.4 | 0.003 – 0.766 |
| µVC 15°C | d-1 | 0.1 | 0.003 – 0.737 |
| KTCE | µmol·L-1 | 10 | 0.05 – 17.4 |
| KDCE | µmol·L-1 | 9.9 | 0.54 – 11.9 |
| KVC | µmol·L-1 | 2.6 | 2.2 – 602 |
| Ki,TCE | µmol·L-1 | 10 | 0.05 – 724 |
| Ki,DCE | µmol·L-1 | 3.6 | 1.8 – 600 |
| Ki,VC | µmol·L-1 | 7.8 | 2.6 – 602 |
| Y | cell·µmol-1 | 5.1*108 | 4.3*108 – 1.9*109 |
| kd1 | d-1 | 0.03 | 0.01 – 0.05 |
| kd2 | d-1 | 0.05 | 0.01 – 0.05 |
| X10 | cell·L-1 | 2*108 | - |
| X20 | cell·L-1 | 1*108 | - |
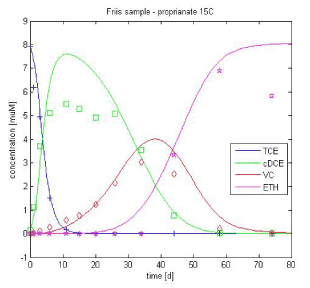
Figure 3.4 - Experimental data vs. simulated curves for propionate-amended culture at 15°C
3.4.2 Simulation of treatability study data– sand samples
As verification, the model is used to simulate laboratory experiments where sand and groundwater from Rugårdsvej field site are added. These conditions are closer to field conditions. In these experiments, electron donor (lactate or propionate) is added at day 0, while the dechlorinating biomass (KB-1 culture) is added at day 57. The details concerning the experimental set-up can be found in [Jørgensen et al., 2007b].
The initial bacteria concentration in the sample is not known and no prior information is available. However, it seems that this parameter is not very sensitive in the model (see Appendix D) so X10 (initial concentration of biomass population 1) is set to 8*104 cells/L in samples K and M and to 8*107 cells/L in sample L, as it is observed that TCE degrades much faster in this sample (see Figure 3.5). A rough estimate of the added dechlorinating biomass is performed. The culture is diluted 1000 times, resulting in an initial Dehalococcoides concentration between 107 and 108 cells/L.
Lactate as electron donor
Taking the optimized parameters from Table 3.1, only the initial concentration of biomass population 2, X20 is optimized for the samples K, L and M, given a value of 4.5*107 cell/L. The resulting curves are shown Figure 3.5. A reasonable fit is obtained for the different samples, indicating that the model describes these data sets well.
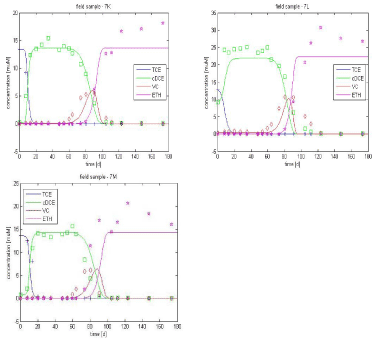
Figure 3.5 - Experimental data vs. simulated curves for lactate-amended culture, optimization only on X20
Propionate as electron donor
Taking the optimized parameters from Table 3.2, with an initial biomass value X20 of 3*107 cell/L is used for the samples K, L and M. The resulting curves are shown in Figure 3.6. The simulation gives a reasonable fit for samples K and M but the result with sample L is not satisfying with respect to cis-DCE degradation to VC (slower in the experiment).
Based on the lactate and propionate results, it appears that simulations are poorest for sample L. This can be due to the presence of competitive bacteria populations in high concentration, leading to limiting substrate conditions for dechlorination, which is not included in the model processes; so this sample does not correspond to the model assumptions.
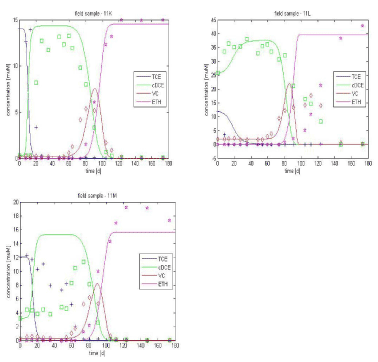
Figure 3.6 – Experimental data vs. simulated curves for lactate-amended culture, optimization only on X20 (initial biomass population)
3.5 Coupling to the transport model
The laboratory experiment “sub-model” allows definition of a set of differential equations to simulate the sequential dechlorination from TCE to ethene. This mathematical model can be combined with a transport model, in order to characterize TCE degradation and transport in the fractured clay system. To sets of kinetic parameters are defined depending on the electron donor characteristics (lactate or propionate).
Version 1.0 July 2009, © Danish Environmental Protection Agency