Fuel use and emissions from non-road machinery in Denmark from 1985-2004 - and projections from 2005-2030
3 Stock and operational data
3.1 Agriculture
3.1.1 Tractors
Stock
For each inventory year, the distribution of agricultural tractors into numbers per new sales year has been established using information from Statistics Denmark, The Association of Danish Agricultural Machinery Dealers (Dansk Maskinhandlerforening) and Danish Agricultural Advisory Service (Dansk Landbrugsrådgivning - Landscentret).
The total number of tractors from 1985 to 2000 in agriculture and forestry is given by Statistics Denmark (2005), based on information from questionnaires and registers of crop subsidy application kept by the Ministry of Agriculture. To obtain the number of agricultural diesel tractors, the number of gasoline tractors and forestry tractors (diesel) are subtracted from the overall totals. The latter sector’s fleet numbers are obtained from KVL (2005).
Figures for the total number of gasoline tractors exist for 1974 (Statistics Denmark, 1974), and 1990 (Teknologisk Institut, 1992). Since no new sales has occured since the beginning of the 1970’s, a linear decrease in stock numbers between 1974 and 1990, and a gradual phasing out of gasoline tractors after 1990 (using same increment) is assumed (Høy, 2005).
For each year in the inventory period, the number of diesel tractors in agriculture is distributed into size classes, using new sale figures from The Association of Danish Agricultural Machinery Dealers (2005a), and a tractor lifetime of 30 years (Teknologisk Institut, 1992). The 1982 new sales distribution is used for the years before 1982, and for 2004, the figures for 2003 is used. For each inventory year the ratio between total stock (Statistics Denmark) and estimated stock (from new sales/lifetime) is used to adjust the stock-engine size distribution, in order to end up with the total stock numbers given by Statistics Denmark. For 2001-2004 the adjustment ratio for 2000 is used.
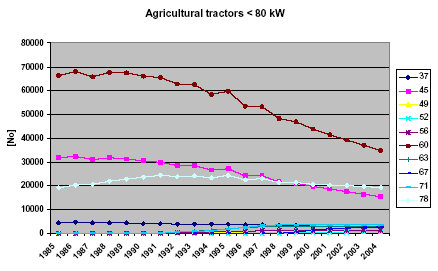
Figure 1 Total numbers in kW classes (< 80 kW) for tractors from 1985 to 2004
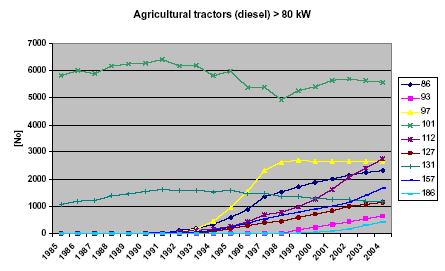
Figure 2 Total numbers in kW classes (> 80 kW) for tractors from 1985 to 2004
The total number of agricultural tractors per year are shown in the Figures 1 and 2, for engine sizes < 80 kW and > 80 kW, respectively. The Figures clearly show a decrease in the number of small tractors, being replaced by tractors in the large engine size ranges. The overall development towards smaller tractor numbers and increasing engine sizes is also visible from Figure 3. The number of vehicles decreases with 20% from 1985 to 2004, whereas the average engine size increase around 16% in the same time period.
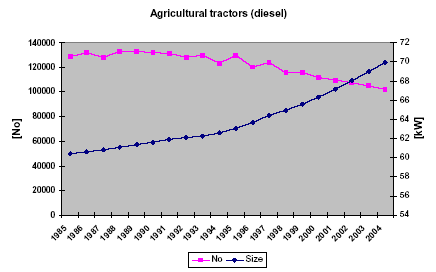
Figure 3 Total numbers and average engine size for tractors from 1985 to 2004
The emission level shares for the Danish stock of diesel tractors are shown in Figure 4. The specific stage I and II implementation years rely on engine size (see Chapter 1), and therefore individual size segment shares differ slightly from the Figure 4 overall country shares.
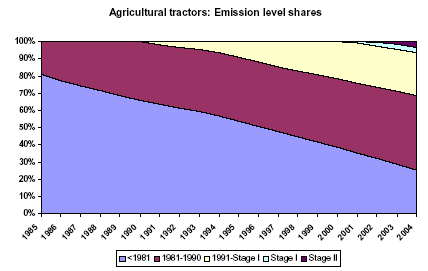
Figure 4 Emission level shares for tractors from 1985 to 2004
The number of gasoline fuelled tractors is shown in Figure 5, distributed into certified and non certified tractors. The split between certified and non certified tractors is given by Høy (2005) and Teknologisk Institut (1992).
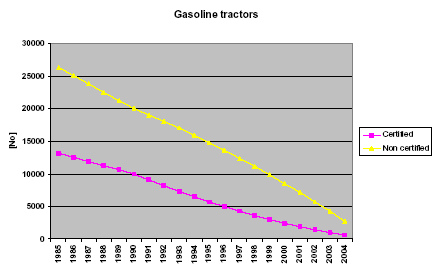
Figure 5 Total numbers of gasoline fuelled tractors from 1985 to 2004
The stock distribution of diesel tractors into engine size and emission levels, and the number of gasoline tractors used in the inventory from 1985-2004 are given in Annex 1.
Operational data
For 0-7 year old diesel tractors the number of annual working hours is assumed to be 500. For 7-16 year old tractors the annual working hours gradually decrease from 500 to a level of 100, which is also used for tractors older than 16 year (Bak et al., 2003).
The load factor for diesel tractors is assumed to be 0.5 (Bak et al., 2003). A similar load factor was calculated in the present project as a part of an assessment of the inventory operational data. The calculations were based on figures for engine loads and annual hours for different types of tractor usage provided by Sørensen (2005), for three different farm types (see also Iversen et al., 1987).
An overview of annual working hours and load factors used for agricultural tractors in all inventory years is given in Table 15.
Table 15 Annual working hours, load factors and lifetimes for agricultural tractors
| Tractor type | Annual working hours | Load factor | Lifetime (yrs) |
| Diesel | 500 (0-7 years) 500-100 (7-16 years) 100 (>16 years) |
0.5 | 30 |
| Gasoline (certified) | 100 | 0.4 | 37 |
| Gasoline (non certified) | 50 | 0.4 | 37 |
3.1.2 Harvesters
Stock
As for tractors, the total number of harvesters from 1985 to 2000 is given by Statistics Denmark (2005). For each year in the inventory period, the number of harvesters is distributed into new sales year and size classes, using new sale figures from The Association of Danish Agricultural Machinery Dealers (2005b), and a harvester lifetime of 25 years (Høy, 2005). The 1982 new sales distribution is used for the years before 1982, and for 2004, the figures for 2003 are used.
New sales figures are given in numbers per harvester platform width (ft), and to transform these into actual engine sizes a kW:ft ratio is assumed based on information from Høy (2005). The latter source assume a kW:ft ratio of 5 in 1985 and 10 in 2004. A linear interpolation is used to produce the kW:ft ratio’s for the years in between.
In order to end up with the total stock numbers given by Statistics Denmark, an adjustment ratio between total stock (Statistics Denmark) and estimated stock (from new sales/lifetime) is used to correct each inventory year’s stock-engine size distribution. Due to lack of data, the adjustment ratio for 2000 is used also for 2001-2004.
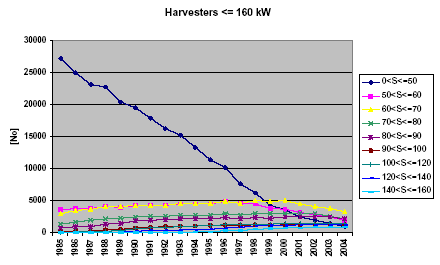
Figure 6 Total numbers in kW classes (<= 160 kW) for harvesters from 1985 to 2004
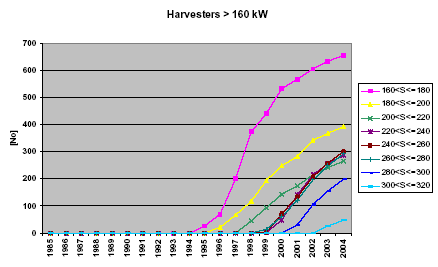
Figure 7 Total numbers in kW classes (> 160 kW) for harvesters from 1985 to 2004
The total number of harvesters per year are shown in the Figures 6 and 7, for engine sizes < 160 kW and > 160 kW, respectively. The figures clearly show a decrease in the number of small harvesters, being replaced by harvesters in the large engine size ranges.
The harvester development towards fewer vehicles and larger engines shown in Figure 8, is very clear. From 1985 to 2004 the number of vehicles decreases with around 50% whereas the average engine size increases more than 100%.
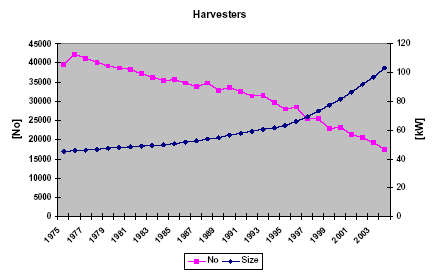
Figure 8 Total numbers and average engine size for harvesters from 1985 to 2004
The emission level shares for harvesters are shown in Figure 9. As for tractors, the Stage I and II implementation years rely on engine size, and therefore specific size segment shares will differ slightly from the picture shown in Figure 9.
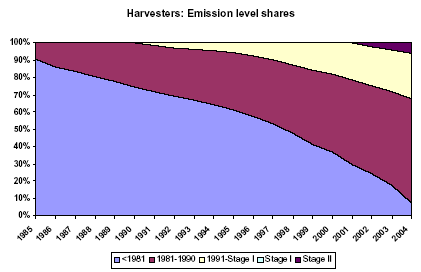
Figure 9 Emission level shares for harvesters from 1985 to 2004
The engine size-emission level distribution of the harvester stock used in the inventory from 1985-2004 is given in Annex 1.
Operational data
Based on information from Høy (2005), the annual working hours are expected to decrease linearly from 200 to 50, during the harvester lifetime period of 25 years. The load factor at 0.8 is obtained from Bak et al. (2003).
3.1.3 Machine pools
Stock
Different machinery data for machine pools is obtained from the Association of Danish Machine Pools (Danske Maskinstationer), see Association of Danish Machine Pools (2005). The 1985-2004 development in machinery stock is shown in Figure 10 from 1985-2004. Due to lack of data the engine size for tractors is assumed to be the same as the average engine size for agricultural diesel tractors in a given inventory year. More detailed data for the machinery stock is shown in Annex 1 for all inventory years.
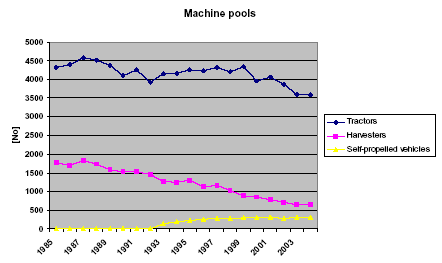
Figure 10 Machinery stock for machine pools from 1985 to 2004
Operational data
An overview of annual working hours and load factors used for machine pool machinery is given in Table 16 for all inventory years. Annual working hours and lifetime figures come from Kjelddal (2005), and load factors are from Bak et al. (2003).
Table 16 Annual working hours, load factors and lifetime for machine pool machinery
| Tractor type | Hours/yr | Load factor | Lifetime (yrs) |
| Tractors | 750 | 0.5 | 7 |
| Harvesters | 100 | 0.8 | 11 |
| Self-propelled vehicles | 500 | 0.75 | 6 |
3.1.4 Other machinery
Stock
Other machinery in agriculture mainly consists of units with small levels of activity. Stock numbers are from Teknologisk (1992). For bedding machines, fodder trucks and sweepers, today’s stock is assumed to be 50% of the stock in 1990 (Høy, 2005).
All terrain vehicles (ATV) is however a fast growing segment of gasoline machinery. ATV’s entered into use in 1992 and 2000 for professional and private purposes, respectively (Importørforeningen, 2005).
Table 17 Stock numbers for other machinery types in agriculture in selected years
| Machinery type | Fuel type | 1985 | 1990 | 1995 | 2000 | 2004 |
| ATV private | Gasoline | 1000 | 5000 | |||
| ATV professional | Gasoline | 1204 | 4342 | 6924 | ||
| Bedding machines | Gasoline | 1100 | 955 | 811 | 666 | 550 |
| Fodder trucks | Gasoline | 11000 | 9553 | 8105 | 6658 | 5500 |
| Other (gasoline) | Gasoline | 100 | 100 | 100 | 100 | 100 |
| Scrapers | Gasoline | 750 | 750 | 750 | 750 | 750 |
| Self-propelled vehicles | Diesel | 1100 | 1100 | 1100 | 1100 | 1100 |
| Sweepers | Gasoline | 2500 | 2171 | 1842 | 1513 | 1250 |
Operational data
Figures for load factors, lifetime, annual working hours and engine size are given in Table 18 for other machinery in agriculture (Teknologisk, 1992). No data is shown for ATV load factors and engine size. For ATV's, the fuel use and emission calculations use figures for fuel use per hour, and fuel related emission factors for conventional motor cycles.
Table 18 Operational data for other machinery types in agriculture
| Machinery type | Fuel type | Load factor | Lifetime (yrs) | Hours | Size (kW) |
| ATV private | Gasoline | - | 6 | 250 | - |
| ATV professional | Gasoline | - | 8 | 400 | - |
| Bedding machines | Gasoline | 0.3 | 10 | 50 | 3 |
| Fodder trucks | Gasoline | 0.4 | 10 | 200 | 8 |
| Other (gasoline) | Gasoline | 0.4 | 10 | 50 | 5 |
| Scrapers | Gasoline | 0.3 | 10 | 50 | 3 |
| Self-propelled vehicles | Diesel | 0.75 | 15 | 150 | 60 |
| Sweepers | Gasoline | 0.3 | 10 | 50 | 3 |
3.2 Forestry
Stock and operational data for forestry machinery are provided by KVL (2005) for all types of machinery.
Stock
In Table 19, stock numbers and engine sizes are given for forestry machinery in selected years.
Table 19 Stock and engine size for forestry machinery in selected years
| Machinery type | Fuel type | 1985 | 1990 | 1995 | 2000 | 2004 | |
| Chippers | Diesel | [No] | 120 | 123 | 125 | 130 | 134 |
| Tractors (other) | Diesel | 750 | 650 | 550 | 511 | 480 | |
| Tractors (silvicultural) | Diesel | 20 | 25 | 30 | 30 | 30 | |
| Harvesters | Diesel | 20 | 33 | 45 | 48 | 50 | |
| Forwarders | Diesel | 45 | 50 | 55 | 58 | 61 | |
| Chain saws (forestry) | Gasoline | 8000 | 8000 | 5857 | 3714 | 2000 | |
| Chippers | Diesel | [kW] | 47 | 51 | 56 | 64 | 71 |
| Tractors (other) | Diesel | 45 | 53 | 61 | 69 | 75 | |
| Tractors (silvicultural) | Diesel | 105 | 123 | 142 | 160 | 175 | |
| Harvesters | Diesel | 60 | 71 | 81 | 92 | 100 | |
| Forwarders | Diesel | 60 | 71 | 81 | 92 | 100 | |
| Chain saws (forestry) | Gasoline | 5 | 5 | 5 | 5 | 5 |
Operational data
Annual working hours, load factors and lifetimes for forestry machinery are given in Table 20 for selected years. The annual working hours for other tractors are expected to increase linearly from 100 to 400 from 1990 to 2004. For 1985-1989 the figures for 1990 are used.
Table 20 Annual working hours, load factors and lifetimes for forestry machinery
| Machinery type | Hours | Load factors | Lifetime |
| Chippers | 1200 | 0.5 | 6 |
| Tractors (other) | 100 (1990) 400 (2004) |
0.5 | 15 |
| Tractors (silvicultural) | 800 | 0.5 | 6 |
| Harvesters | 1200 | 0.5 | 8 |
| Forwarders | 1200 | 0.5 | 8 |
| Chain saws (forestry) | 800 | 0.4 | 3 |
3.3 Industry
3.3.1 Fork lifts
Stock
The fork lift stock distribution into new sales year, fuel type and size classes is made by using 1976-2004 new sale figures from IFAG (Brancheforeningen for Importører og Fabrikanter af Gaffeltrucks i Danmark), see Teknologisk (2005) and IFAG (2005), and a lifetime of 20 years (Bak et al., 2003). For years before 1976, the 1976 new sales distribution is used.
New sales figures are given in groups per lifting capacity (tons). A transformation into engine size classes (kW) is made using a kW:tons ratio from Bak et al. (2003).
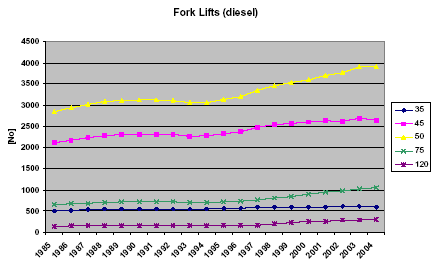
Figure 11 Total numbers of diesel fork lifts in kW classes from 1985 to 2004
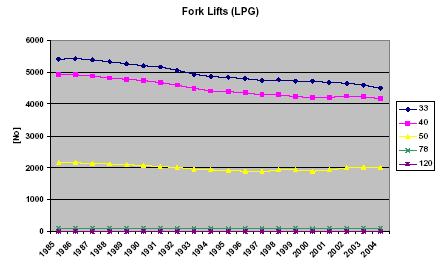
Figure 12 Total numbers of LPG fork lifts in kW classes from 1985 to 2004
The total numbers of fork lifts per year are shown in the Figures 11 and 12, for diesel and LPG fuelled types, respectively. In general the number of diesel fork lift increases from 1985 to 2004 for all engine size groups. In this period the overall stock increase is 36% for diesel, whereas for LPG there is a stock decrease of 14%, mainly driven by the stock decline for smaller fork lifts.
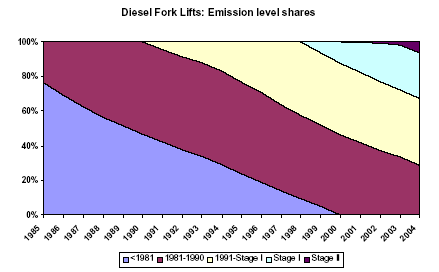
Figure 13 Emission level shares for diesel fork lifts from 1985 to 2004
The emission level shares for diesel trucks are shown in Figure 9. The Stage I and II implementation years rely on engine size, and therefore specific size segment shares will differ slightly from the picture shown in Figure 9. For LPG, no development in emission factors is taken into account in the emission calculations.
Annex I includes the number-engine size distribution of fork lifts used in the inventory from 1985-2004.
Operational data
The data for annual working hours, load factors and lifetime shown in Table 21 are based on information from Bak et al. (2003). The annual working hours for engine sizes larger than 50 kW are expected to decrease linearly from 1200 to 650 for vehicles between 0 and 10 years of age. For engines smaller than 50 kW the annual working hours are expected to be 650, irrespective of age.
Table 21 Annual working hours, load factors and lifetime for fork lifts
| Hours/yr | Load factor | Lifetime (yrs) |
| 1200 (>=50 kW and <=10 years old) 650 (>=50 kW and >10 years old) 650 (<50 kW) |
0.27 | 20 |
3.3.2 Construction machinery
Stock
New sales figures covering the period 1996-2004 period is obtained from The Association of Danish Agricultural Machinery Dealers (2005c) for the construction machinery types shown in the Figures 14 and 15. Using the machinery lifetimes (see Table 8) and assumptions for machinery new sales for years before 1996, a set of stock numbers are estimated for 2004. These latter stock figures are used together with the 1990 stock figures given by Teknologisk (1992), to interpolate the 1991-2003 machinery stock.
Due to lack of data from 1985 to1989, the 1990 stock numbers are used for these years. Moreover, for a given inventory year and machinery type it is assumed that all ages of machinery have the same percentage share of the total stock. The described approach of stock estimation has been discussed with The Association of Danish Agricultural Machinery Dealers (Pedersen, 2005; Stjernqvist, 2005).
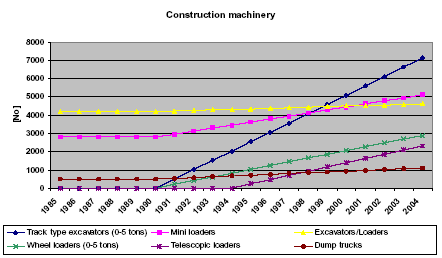
Figure 14 1985-2004 stock development for specific types of construction machinery
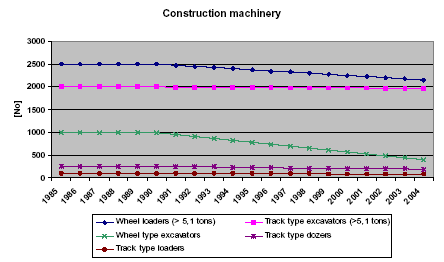
Figure 15 1985-2004 stock development for specific types of construction machinery
Figure 14 shows the 1985-2004 stock development for specific types of machinery with increasing stock numbers after 1990. The inventory assumes that track type excavators/ wheel type loaders (0-5 tons), and Telescopic loaders first enter into use in 1991 and 1995, respectively (Stjernqvist, 2005). In Figure 15 the 1985-2004 stock development is shown for machinery types with declining stock numbers after 1990.
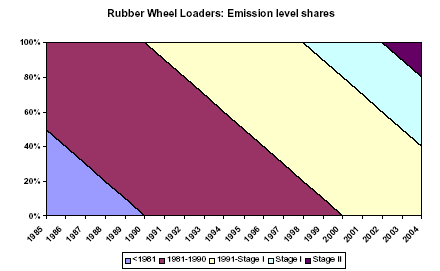
Figure 16 Emission level shares for wheel type loaders from 1985 to 2004
The emission level shares for each construction machinery type follow the pattern shown in Figure 16 for wheel type loaders. The emission level penetration rates are linear, and reflect the machinery age distribution assumptions explained in the above text.
The engine size-emission level distribution of the construction machinery stock from 1985-2004 is given in Annex 1.
Operational data
The data for annual working hours, load factors, lifetimes and engine sizes shown in Table 22 are provided by Stjernqvist (2005). Both annual working hours and engine sizes for dump trucks are expected to increase linearly from 1990 to 2004. Also for track type loaders an increase in the average engine size is expected in the same time interval, as given in Table 8.
Table 22 Operational data for construction machinery
| Machinery type | Load factor | Lifetime | Hours | Size |
| Track type dozers | 0.5 | 10 | 1100 | 140 |
| Track type loaders | 0.5 | 10 | 1100 | 100 (1990) 150 (2004) |
| Wheel loaders (0-5 tons) | 0.5 | 10 | 1200 | 20 |
| Wheel loaders (> 5,1 tons) | 0.5 | 10 | 1200 | 120 |
| Wheel type excavators | 0.6 | 10 | 1200 | 100 |
| Track type excavators (0-5 tons) | 0.6 | 10 | 1100 | 20 |
| Track type excavators (>5,1 tons) | 0.6 | 10 | 1100 | 120 |
| Excavators/Loaders | 0.45 | 10 | 700 | 50 |
| Dump trucks | 0.4 | 10 | 900 (1990) 1200 (2004) |
60 (1990) 180 (2004) |
| Mini loaders | 0.5 | 14 | 700 | 30 |
| Telescopic loaders | 0.5 | 14 | 1000 | 35 |
3.3.3 Other
For industrial non road, a large group of individual machinery types exists for which stock and operational data are very scarce and for which fuel use and emission contributions are small. Due to project limitations it has therefore been decided for these types of equipment to use only the data from the Teknologisk (1992 and 1993) studies for all inventory years.
Table 23 Stock and operational data for other machinery types in industry
| Sector | Fuel type | Machinery type | Size (kW) | No | Load Factor | Hours |
| Construction machinery | Diesel | Tampers/Land rollers | 30 | 2800 | 0.45 | 600 |
| Construction machinery | Diesel | Generators (diesel) | 45 | 5000 | 0.5 | 200 |
| Construction machinery | Diesel | Kompressors (diesel) | 45 | 5000 | 0.5 | 500 |
| Construction machinery | Diesel | Pumps (diesel) | 75 | 1000 | 0.5 | 5 |
| Construction machinery | Diesel | Asphalt pavers | 80 | 300 | 0.35 | 700 |
| Construction machinery | Diesel | Motor graders | 100 | 100 | 0.4 | 700 |
| Construction machinery | Diesel | Refuse compressors | 160 | 100 | 0.25 | 1300 |
| Construction machinery | Gasoline | Generators (gasoline) | 2.5 | 11000 | 0.4 | 80 |
| Construction machinery | Gasoline | Pumps (gasoline) | 4 | 10000 | 0.4 | 300 |
| Construction machinery | Gasoline | Kompressors (gasoline) | 4 | 500 | 0.35 | 15 |
| Industry | Diesel | Refrigerating units (distribution) | 8 | 3000 | 0.5 | 1250 |
| Industry | Diesel | Refrigerating units (long distance) | 15 | 3500 | 0.5 | 200 |
| Industry | Diesel | Tractors (transport, industry) | 50 | 3000 | 0.4 | 500 |
| Airport GSE and other | Diesel | Airport GSE and other (light duty) | 100 | 500 | 0.5 | 400 |
| Airport GSE and other | Diesel | Airport GSE and other (medium duty) | 125 | 350 | 0.5 | 300 |
| Airport GSE and other | Diesel | Airport GSE and other (Heavy duty) | 175 | 650 | 0.5 | 200 |
| Building and construction | Diesel | Vibratory plates | 6 | 3500 | 0.6 | 300 |
| Building and construction | Diesel | Aereal lifts (diesel) | 30 | 150 | 0.4 | 400 |
| Building and construction | Diesel | Sweepers (diesel) | 30 | 200 | 0.4 | 300 |
| Building and construction | Diesel | High pressure cleaners (diesel) | 30 | 50 | 0.8 | 500 |
| Building and construction | Gasoline | Rammers | 2.5 | 3000 | 0.4 | 80 |
| Building and construction | Gasoline | Drills | 3 | 100 | 0.4 | 10 |
| Building and construction | Gasoline | Vibratory plates (gasoline) | 4 | 2500 | 0.5 | 200 |
| Building and construction | Gasoline | Cutters | 4 | 800 | 0.5 | 50 |
| Building and construction | Gasoline | Other (gasoline) | 5 | 1000 | 0.5 | 40 |
| Building and construction | Gasoline | High pressure cleaners (gasoline) | 5 | 500 | 0.6 | 200 |
| Building and construction | Gasoline | Sweepers (gasoline) | 10 | 500 | 0.4 | 150 |
| Building and construction | Gasoline | Slicers | 10 | 100 | 0.7 | 150 |
| Building and construction | Gasoline | Aereal lifts (gasoline) | 20 | 50 | 0.4 | 400 |
3.4 Household and gardening
For gasoline fuelled equipment used for household and gardening purposes the statistical information available is generally scarce. In the present project the data for stock and operational data are based on the reports Teknologisk (1993), Bak et al. (2003) and specific information from two manufacturers of working machinery with large Danish market shares (Petersen, 2005 and Hermansen, 2005). To obtain a sufficient degree of data consensus for household and gardening equipment, the listed figures for stock and operational data are validated by KVL (Kristoffersen, 2005).
3.4.1 Stock
Figure 17 shows the 1985-2004 stock development for which specific data have been gathered in the present project. For lawn movers and cultivators the machinery stock remain the same for all years, whereas the stock figures for riders, chain saws, shrub clearers, trimmers and hedge cutters increase from 1990 and onwards. According to the sources behind stock data, the yearly stock increase in most cases becomes larger after 2000, as shown in Figure 17.
Figure 17 Stock development 1985-2004 for the most important household and gardening machinery types
The emission level distribution of household and gardening equipment numbers used in the inventory from 1985-2004 is given in Annex 1.
3.4.2 Operational data
The data for engine size, load factors, annual working hours and lifetimes listed in Table 24 are based on information from Petersen (2005), Hermansen (2005) and Kristoffersen (2005). The operational parameters are regarded as constant throughout the 1985-2004 time period, except for lawn movers. In the latter case the average engine size is assumed to increase during the latest years, and this is reflected in the calculations from 2000 and onwards.
Table 24 Operational data for the most important types of household and gardening machinery
| Machinery type | Engine | Size (kW) | Hours | Load factor | Lifetime (yrs) |
| Chain saws (private) | 2-stroke | 2 | 5 | 0.3 | 10 |
| Chain saws (professional) | 2-stroke | 3 | 270 | 0.4 | 3 |
| Cultivators (private-large) | 4-stroke | 3.7 | 5 | 0.6 | 5 |
| Cultivators (private-small) | 4-stroke | 1 | 5 | 0.6 | 15 |
| Cultivators (professional) | 4-stroke | 7 | 360 | 0.6 | 8 |
| Hedge cutters (private) | 2-stroke | 0.9 | 10 | 0.5 | 10 |
| Hedge cutters (professional) | 2-stroke | 2 | 300 | 0.5 | 4 |
| Lawn movers (private) | 4-stroke | 2.5 (2000) 3.5 (2004) |
25 | 0.4 | 8 |
| Lawn movers (professional) | 4-stroke | 2.5 (2000) 3.5 (2004) |
250 | 0.4 | 4 |
| Riders (private) | 4-stroke | 11 | 50 | 0.5 | 12 |
| Riders (professional) | 4-stroke | 13 | 330 | 0.5 | 5 |
| Shrub clearers (private) | 2-stroke | 1 | 15 | 0.6 | 10 |
| Shrub clearers (professional) | 2-stroke | 2 | 300 | 0.6 | 4 |
| Trimmers (private) | 2-stroke | 0.9 | 20 | 0.5 | 10 |
| Trimmers (professional) | 2-stroke | 0.9 | 200 | 0.5 | 4 |
3.4.3 Other
For a few types of machinery with very small fuel use and emission contributions no stock and operational data has been gathered in the present project. Instead the data from the Teknologisk (1992 and 1993) studies have been used for all inventory years.
Table 25 Stock and operational data for other machines in household and gardening
| Machinery type | Engine | No. | Size (kW) | Hours | Load factor | Lifetime (yrs) |
| Chippers | 2-stroke | 200 | 10 | 100 | 0.7 | 10 |
| Garden shredders | 2-stroke | 500 | 3 | 20 | 0.7 | 10 |
| Other (gasoline) | 2-stroke | 200 | 2 | 20 | 0.5 | 10 |
| Suction machines | 2-stroke | 300 | 4 | 80 | 0.5 | 10 |
| Wood cutters | 4-stroke | 100 | 4 | 15 | 0.5 | 10 |
3.5 Inland waterways
In the present project stock and operational data for recreational craft are based on Søsportens Brancheforening (1986), IFEU (2004), and Højenvang (2005).
3.5.1 Stock
Figure 18 shows the 1985-2004 stock and engine size developments for diesel boats and gasoline 2-stroke and 4-stroke vessels.
Figure 18 1985-2004 Stock and engine size development for recreational craft
For diesel boats, increases in stock and engine size are expected from 1986 to 2004, except for the stock of motor boats (< 27 ft.) and the engine sizes for sailing boats (<26 ft.) where figures remain unchanged (Højenvang, 2005). Based on the same source of information, a decrease in the total stock of sailing boats (<26 ft.) by 21%, and increases in the total stock of yawls and cabin boats, and other boats (<20 ft.) by around 25% are expected. Due to lack of specific Danish information the shifting rate from 2-stroke to 4-stroke gasoline engines is based on a German non road study (IFEU, 2004).
The type specific boat numbers used in the inventory from 1985-2004 is given in Annex 1.
3.5.2 Operational data
Table 26 Operational data for recreational craft
| Fuel type | Vessel type | Engine type | Stroke | Hours | Lifetime | Load factor |
| Gasoline | Other boats (<20 ft) | Out board engine | 2-stroke | 30 | 10 | 0.5 |
| Gasoline | Other boats (<20 ft) | Out board engine | 4-stroke | 30 | 10 | 0.5 |
| Gasoline | Yawls and cabin boats | Out board engine | 2-stroke | 50 | 10 | 0.5 |
| Gasoline | Yawls and cabin boats | Out board engine | 4-stroke | 50 | 10 | 0.5 |
| Gasoline | Sailing boats (<26ft) | Out board engine | 2-stroke | 5 | 10 | 0.5 |
| Gasoline | Sailing boats (<26ft) | Out board engine | 4-stroke | 5 | 10 | 0.5 |
| Gasoline | Speed boats | In board engine | 4-stroke | 75 | 10 | 0.5 |
| Gasoline | Speed boats | Out board engine | 2-stroke | 50 | 10 | 0.5 |
| Gasoline | Speed boats | Out board engine | 4-stroke | 50 | 10 | 0.5 |
| Gasoline | Water scooters | Built in | 2-stroke | 10 | 10 | 0.5 |
| Gasoline | Water scooters | Built in | 4-stroke | 10 | 10 | 0.5 |
| Diesel | Motor boats (27-34 ft) | In board engine | 150 | 15 | 0.5 | |
| Diesel | Motor boats (>34 ft) | In board engine | 100 | 15 | 0.5 | |
| Diesel | Motor boats (<27 ft) | In board engine | 75 | 15 | 0.5 | |
| Diesel | Motor sailors | In board engine | 75 | 15 | 0.5 | |
| Diesel | Sailing boats (<26ft) | In board engine | 25 | 15 | 0.5 |
Version 1.0 June 2006, © Danish Environmental Protection Agency