[Front page] [Contents] [Previous] [Next] |
Economic Instruments in Environmental Protection in Denmark
11. A case study of the Danish energy sector
11. A case study
of the Danish energy sector
11.1. Introduction
11.2. The environmental issues
11.3. Overview of the Danish
energy sector
11.3.1. Danish energy supply and
consumption
11.3.2. Energy markets and structure
11.4. Danish Energy Policy
11.4.1. Developments in Energy Policy
11.4.2. Environmental objectives
11.5. Taxes and charges
11.5.1. Historical developments
11.5.2. Structure and
levels of taxation on energy
11.5.3. Fiscal effects of taxes
11.5.4. Assessment of taxes
11.6. Subsidies
11.6.1. Subsidies to promote CHP
11.6.2. Subsidies
to promote the utilisation of renewable energy sources
11.6.3. Promotion of
energy savings/reduction of CO2
11.6.4. Fiscal effects of subsidies
11.6.5. Assessment of Subsidies
11.7. The
role of economic instruments in achieving environmental goals in the energy sector
11.7.1. Overall
environmental results
11.7.2. Measures to
reduce total energy consumption
11.7.3. Measures to influence
fuel choice
11.7.4. Measures
to promote emission abatement technologies
11.7.5. Overview
and assessment of the role of various types of instruments
11.8. Administrative aspects
11.8.1. Payment of energy and
environmental taxes
11.8.2. Assessment of
administrative requirements
11. A case study of the Danish energy sector
11.1. Introduction
Background
This chapter presents a thorough analysis of the use of economic instruments for environmental protection in the Danish energy sector. The analysis aims to investigate the use of economic instruments in a sectoral context, rather than at the level of individual economic instruments. In this sense, it complements the reviews of individual instruments presented in the previous chapters.
Energy is used in all sectors of the economy, it is used for a number of different purposes and it comes in various partly substitutable forms. These complexities call for a sectoral approach when looking at the use of economic instruments for reducing environmental impact from energy production and consumption. For example, the use of economic instruments can not properly be assessed without looking at the use of other regulatory measures, or without looking at the consistency of environmental regulation across uses and energy forms.
Focus of the case study
The chapter focuses primarily on the following:
| The provision of a general overview of the types of economic instruments that are used in the Danish energy sector and of the structure of financial incentives created by these instruments. | |
| The investigation of the extent to which economic instruments have been used in the energy sector vis-ŕ-vis other forms for environmental regulation, i.e. mainly administrative regulations. | |
| A discussion of key administrative issues in relation to the way economic instruments has been used in the Danish energy sector. |
Delimitation:
The chapter considers only stationary sources of air pollution caused by energy use, i.e. the transport sector is not considered in this chapter.
The discussion of environmental problems in the energy sector will be limited to air emissions of CO2, SO2, and NOx, because it is mainly in connection with these emissions that economic instruments have been used or contemplated.
Outline
The chapter is organised as follows:
Section 11.2 contains a short description of the relevant environmental issues. The chapter discusses, among other things, the main environmental problem, and the technical options for addressing the problems.
Section 11.3 provides an introduction to the Danish energy sector. It presents key figures for production and consumption of energy as well as the overall structure and organisation of the various subsectors.
Section 11.4 provides the policy framework within which economic instruments are used, by means of presenting the main orientations of Danish energy policy.
In section 11.5 and 11.6, the various economic instrument (i.e. environmental taxes, charges and subsidies) that are used in the energy sector are reviewed. Further, their purpose and function is discussed, and the fiscal impact of the instruments is summarised.
A reduction of harmful emissions from the energy sector can principally be brought about in three distinct ways: 1) reduction of the energy consumption; 2) switching to cleaner fuels; or 3) installation of various abatement techniques. Section 11.7 provides an overview of how environmental taxes, charges, and subsidies – and other forms of regulations – have been used to pursue these aims.
In section 11.8, key administrative issues of relevance to environmental taxes and charges in the energy sector are discussed.
11.2. The environmental issues
This section provides a brief overview of the main environmental issues related to CO2, SO2 and NOx emissions form the energy sector. The nature of the environmental problems, the options for reducing the problems, and the core features of the relevant sectors or actors are important factors that influence the proper design of regulatory instruments.
Emissions of carbon dioxide
Fossil fuels contain carbon. When these fuels are combusted, CO2 is the inevitable end-product. CO2 is the most important contributor to the greenhouse effect, which is generally believed to cause global warming and climate changes.
The content of carbon per energy unit varies for various fossil fuels and the emissions of CO2 per unit of energy produced will thus also vary. Coal is among the fuels with the highest relative CO2 emissions, and natural gas is the fossil fuel with the lowest. Fuels such as straw and wood chips also contain carbon and will therefore emit CO2 when combusted. However, in these cases, a similar amount of CO2 was retained during the growth of these energy sources. Therefore, they are normally considered to be CO2 neutral, i.e. zero net emission. The table below shows the emissions of CO2 per GJ energy for selected fuels.
Table 11.1
Emissions of CO2 per GJ for selected fuels
Coal |
95 kg CO2/GJ |
Fuel oil |
78 kg CO2/GJ |
Gas oil |
74 kg CO2/GJ |
Natural Gas |
57 kg CO2/GJ |
Straw (net emission) |
0 kg CO2/GJ |
There are no economically feasible ways to remove or reduce the CO2 emissions for a given fuel, therefore, the only options for reducing emissions is either a general reduction in the energy consumption, or a replacement of fuels with relatively high emissions with fuels with lower emissions. This could, for example, be the replacement of coal and oil with natural gas and renewable forms of energy.
In 1997, total Danish energy related emissions of CO2 amounted to 63 million tons or about 12.5 tons per capita. This places Denmark well above the EU average of around 9 tons per capita. Electricity production, which predominantly is based on coal, is the largest source of CO2 emission in Denmark, accounting for 46% of the total energy related emissions in 1997; the transport sector represented 22%; and the industrial sector 13%[1].
Emissions of sulphur dioxide
Certain fuels, mainly crude oil and coal, contain sulphur, which when combusted, will be converted into SO2. The sulphur content of coal and crude oil can exhibit great variation depending on the origin of the fuel.
When SO2 that is emitted into the air reacts with water, sulphuric acid is created. This acid contributes to the regional acidification of soil, lakes and water courses, and may cause damage to forests.
Compared to CO2, there is a wider range of options for reducing the SO2 emissions. In addition to the option to reduce the consumption of fuels that contain sulphur and switch to fuels with lower sulphur content, large parts of the SO2 can also be either removed from the flue-gas, or be retained in the ash in certain combustion techniques. The residues might come in the form of useful end products, such as gypsum or sulphuric acid. The installation of flue-gas cleaning equipment is, however, only economically feasible in large combustion plants. In the case of certain industrial processes, some of the sulphur is retained in the end-product, whereby it is not emitted to the atmosphere.
The sulphur content of the refined oil products is mainly determined by the sulphur content of the crude oil and of the applied refinery technology. Through cracking of the carbon chains in the crude oil, the sulphur can be concentrated in the heavy residues, and thus there will be less sulphur in the lighter oil products.
By far the largest source of SO2 emissions in Denmark is the burning of coal in the power sector. In 1995, the power plants represented two thirds of the total emissions.
Nitrogen oxides
During the combustion of fuels, NOx can be formed by nitrogen in the fuels or nitrogen from the air reacting with oxygen. The formation of NOx is mainly determined by the combustion temperatures and the design of the combustion chamber.
Emissions of NOx contribute, like SO2, to acidification. It results also in depositions of nitrogen. This has a negative impact in nitrogen poor environments where it may disturb the ecological balance.
As with SO2, NOx can be removed from the flue-gas. It is, however, only economically feasible in connection with combustion plants above a certain size. Furthermore, NOx emissions can be influenced through the operation of the combustion unit and through the installation of low-NOx burners.
NOx emissions originate from many sources. The main sectors responsible for the emissions are the transport sector, accounting for around 40%, and the power sector that contributes 30%.
11.3. Overview of the Danish energy sector
This section provides a brief overview of the Danish energy sector. It describes the development and composition of energy supply and demand, and the organisation and structure of the various subsectors
11.3.1. Danish energy supply and consumption
The total Danish primary energy consumption has remained fairly constant over the last decades; in 1997 it amounted to 837 PJ (20 million tons of oil equivalents), compared to 825 GJ in 1972, which was the year before the first oil crisis. During the 1990s the total energy consumption has increased by only 0.3% p.a.
Although total energy consumption has remained fairly constant, the share of various primary energy sources has changed markedly. Denmark has gone from being nearly totally dependent on imported oil, which accounted for 92% of the energy supply in 1972, to the present situation with a diversified energy supply based on oil (45%), coal (26%), natural gas (20%), and renewables (9%). Nuclear energy is not an option in Denmark according to a decision of the parliament in 1985.
Over the past decades, Denmark has developed a substantial production of oil, natural gas, and renewable energy sources. In 1997, Danish energy production exceeded for the first time in recent times the total consumption. Production of oil amounted to 11.4 mtoe, gas production to 7 mtoe, and renewables accounted for 1.8 mtoe. Oil and gas is produced offshore in the Danish part of the North Sea. Renewables comprise mainly of waste, straw, wood, and wind. Solar heating only make up 0.4%.
Denmark is a net exporter of natural gas and oil, whereas all its requirements for coal are covered through imports. Electricity is traded extensively (both imports and exports), primarily with Norway and Sweden. Both countries have large shares of hydro electricity, whereas the Danish system is nearly totally based on fossil fuels. Trade flows are therefore very much influenced by the amount of precipitation, and large fluctuations can be observed from one year to the other.
11.3.2. Energy markets and structure
The Danish energy sector consists of several subsectors that exhibit quite different features with regard to market structure and organisation. These range from a fairly competitive oil market, to a centralised monopoly structure of the natural gas market.
Electricity
The Danish electricity sector is divided into two independent areas, each of which is organised into regional associations that are responsible for overall power planning, load dispatching, and operation of their respective transmission nets. There is no direct cable connection between the two systems that cover the eastern and the western part of the country, respectively.
Eight regional power production companies provide around 75% of the total production. The remaining 25% of the electricity is produced mainly by small-scale combined heat and power plants (CHP) and windmills, which accounted for 5% in 1997.
There are, in total, around 100 distribution companies in Denmark. Each of those has a local supply monopoly in the specific area that they cover. The distribution companies are predominantly owned by the municipalities or consumers co-operatives. The distribution companies own the regional power companies, and they, in turn, own the two above-mentioned regional associations.
In January 1998, the electricity market was opened for competition. Industry with an annual consumption exceeding 100 GWh and distribution companies with annual sales in excess of 100 GWh, may now purchase electricity from foreign or Danish producers. The market opening is relevant to 7 industrial enterprises representing 5% of the total consumption, and to 50% of the distribution companies representing 90% of the total sales.
Electricity production is mainly based on coal, which accounted for 61% of the total fuel consumption for electricity production and CHP in 1997. Natural gas accounted for 15%, oil for 12%, and renewables and others for 12%. The share of natural gas will increase markedly in the future as a result of the phase-in of additional large and small-scale gas fired CHP plants.
Electricity prices are regulated. They should be set to reflect the actual costs of production and distribution. This includes a reasonable surplus to finance capital expenditure. Electricity prices must be approved by the Electricity Price Commission each year.
In March 1999, a majority in Parliament agreed upon a major restructuring of the power sector. This agreement involves a further opening of the electricity market for competition, and by the year 2002, all consumers will be allowed to freely choose their supplier of electricity. The agreement also introduces some new mechanisms for environmental protection. A market for “green electricity” will be created, and by the year 2003, all consumers must obtain at least 20% of their electricity production through “green electricity”. Another new mechanism is that the large power producers will be subject to quotas for CO2 emissions, and a payment to the state will be applied when realised emissions are in excess of the quota.
District heating
The development of combined heat and power production has been one of the most important policy objectives in Danish energy policy. Extensive district heating networks were established in the largest eight cities mainly during the 70s and 80s in order to utilise the surplus heat from the large power plants.
During the same period, district heating networks were also established in a large number of small and medium sized cities. During the 1990s, the district heating plants that supply these networks were converted to decentralised CHP. This development has been promoted through various support schemes such as subsidies for investments and to electricity production.
Today, there are about 400 heat distribution companies. Many of those cover both production and distribution while others buy the heat from CHP plants that are owned by the power companies. The heat distribution companies are either owned by municipalities or organised as consumer co-operatives.
Prices for heat are regulated to follow costs. Each year, they must be approved by the Heat and Gas Price Commission. Due to the cost based pricing and to the fact that heat networks are not connected, a wide disparity is found when comparing prices of district heating across the country.
Natural gas
Total remaining Danish reserves of natural gas are estimated at 157 billion Nm3, with a present rate of production of 6.6 billion Nm3 per year (1998 figure). This corresponds to 24 years of production. Gas production takes place offshore in the Danish North Sea by Mćrsk Olie og Gas AS, which operates on behalf of the partners, Shell and Texaco, in DUC (Danish Underground Consortium). DUC sells all the gas to the state-owned company DANGAS, who has a monopoly over transport, storage, and trading of natural gas in Denmark.
DANGAS sells the gas to five regional distribution[2] companies owned by the municipalities in their respective area of supply. DANGAS also sells gas to the large power plants, and exports to Sweden and Germany. In June 1999, an agreement on a restructuring of the gas sector was concluded between the state and two of the distribution companies. The agreement concerned the future structure of the sector, and will, among other things, place the responsibility with DANGAS for the supply of gas to the consumers that will be included in the opening of the gas market.
Of the total gas production in 1997, 42% was exported to Germany and Sweden, 22% was used for heat and power production, 18% went to industry and service, and 10% was used for heating in households. The remaining 8% was stored[3].
The type of end-user largely determines the gas prices in Denmark, because gas prices are set in view of the price of the competing oil product, including possible energy taxes. End-user prices for the various market segments are laid down in the agreement between DANGAS (the supplier) and the distribution companies, to ensure homogenous pricing all over the country. Gas prices must be approved by the Heat and Gas Price Commission, they may neither exceed the cost of supply, which includes a reasonable return on investments, nor the end-user price for gas oil including taxes.
Oil
Remaining oil reserves in Denmark are estimated to be nearly 200 million tons or around 17 years of production at the current rate of production. Licenses for exploration and production are granted to private companies, but up to now DUC has been the sole producer. In 1997, the oil production exceeded the Danish consumption of oil products by 25%.
There are two refineries in Denmark; one is supplied with oil through a pipeline from the Danish fields, and the other is supplied by tankers.
Refining and marketing of oil products are competitive activities and no price regulations apply to these sectors. Prices are typically closely related to the Rotterdam quotations for oil products.
More than 50% of the oil consumption in Denmark is used for transport purposes; refining and power plants consume 19%, industry & service 18%, and heating in households accounts for 12%.
11.4. Danish Energy Policy
This section provides an overview of the main orientations in Danish energy policy, and the main environmental targets and priorities that have been set with regard to the energy sector.
11.4.1. Developments in Energy Policy
The first Danish energy policy was formulated in 1976 in the wake of the first oil crisis in 1973. Later, comprehensive policies were formulated in 1981 in response to the second oil crisis in 1979-80, and again in 1990 and 1996. The orientations of Danish energy policy have changed from originally being mainly concerned with the security of supply issues and the desire to reduce dependency on imported oil, towards being more oriented towards sustainability issues, especially reductions of CO2 emissions.
1970s and 1980s
The first two energy policy documents were Danish Energy Policy (1976) and Energy Plan 81 (1981). Their contents were mainly a reaction to the oil crises, and they focused on the reduction of import dependency through replacing oil, the reduction of energy consumption, and the promotion of Denmark’s own production of oil and gas.
Key orientations of these policies were directed towards the establishment and further development of large infrastructure projects – district heating networks and the natural gas project – which would facilitate a switch from the use of oil in individual households and enterprises. District heating networks were established in the major cities utilising the surplus heat from the large coal-fired power plants, and a nation-wide natural gas supply system was created, which used the natural gas that had been discovered in the Danish part of the North Sea. The implementation of these projects was, to a large extent, a centrally planned process, where the geographical areas to be supplied by district heating and natural gas were laid down by the central energy authorities. The municipalities elaborated detailed heat plans within this overall framework.
1990s
The document Energy 2000 was published in 1990. It introduced the concept of sustainability into Danish energy policy. The key objective of this plan was to reduce emissions of CO2. This should be attained mainly through a number of initiatives that concerned energy conservation and efficiency, further conversion of the supply system, and more focus on renewable sources of energy.
Contributions to energy savings should come from, for example, standards for the insulation of new buildings, and for energy consumption by household appliances.
To further expand the co-production of heat and power, and as the central power plants had been converted to CHP production, the energy plan aimed at establishing decentralised CHP plants supplying heat to district heating networks which already existed in many small and medium sizes cities.
The plan also aimed to further expand the use of natural gas and of indigenous fuels such as straw and waste. This was, among other things, accomplished through mandatory fuel use in the above-mentioned decentralised CHP plants and through various subsidies.
The latest energy policy document, Energy 21, is a response to the need for Denmark to strengthen its efforts to achieve its goals of CO2 reduction in the light of the fact that energy demand had increased more than was foreseen in Energy 2000. The plan was adopted in 1996 and it has the goal of “contributing to Denmark by maintaining and developing its pioneering role in the achievement of sustainable global development”. Key objectives of Energy 21 include developing renewable energy, improving energy efficiency, and adapting the energy sector to more open market conditions.
11.4.2. Environmental objectives
Through various energy policies and international agreements, Denmark has adopted specific goals relating to the environmental performance of the energy sector, including goals of reducing emissions of CO2, SO2, and NOx.
For CO2, the latest energy policy document, Energy 21, confirms the national objectives to stabilise emissions by year 2000 at the 1990 level, and to reach a level by year 2005, where emissions are 20% lower than those that were observed in 1988.
In the Kyoto Agreement of 1997, the EU countries agreed to reduce their emissions of greenhouse gasses to 92% of the 1990-level for the period of 2008-2012. Subsequently, the EU has agreed on a burden sharing between member states. The agreement determines how the reduction targets are to be distributed between member states. According to this, Denmark must reduce its emissions of greenhouse gasses by 21%, instead of the 8% agreed in Kyoto.
Denmark has also entered international agreements on the reduction of SO2 and NOx emissions under the auspices of UN-ECE Convention on Long Range Transboundary Air Pollution. According to these agreements, Denmark is obligated to have reduced SO2 emissions by 80% of the 1980 level in year 2000, and NOx emissions by 30% of the 1986 level in year 1998.
11.5. Taxes and charges
The economic instruments applied in the energy sector comprise of various forms of taxes and subsidies. This section will review the taxes and charges (hereafter taxes), whereas the next section reviews the various subsidy schemes.
The relevant taxes in the energy sector are: the general energy tax and the CO2 and SO2 taxes on emissions.
11.5.1. Historical developments
Introduction of taxes on oil
The first energy taxes were introduced in 1977. They applied to oil products and electricity, and were implemented mainly as a response to the oil crisis of 1973. Thus, the taxes aimed to promote energy savings and substitution away from oil by means of increasing the consumer price of oil products.
To avoid a negative impact on the competitiveness of Danish companies, all VAT-registered enterprises were fully exempted of the energy taxes – a principle which has been maintained until recently.
In 1986, the energy taxes on oil products were raised significantly in the wake of the oil price collapse in the same year, where crude oil prices fell from a level of 28 USD/barrel to an average price 14 USD/barrel. The tax increase generated additional revenue, but another important purpose was also to maintain a stable (high) price of oil products for the non-industrial sector. This was motivated in a desire to maintain stable and strong economic incentives to save energy, and to support the large and capital-intensive energy infrastructure projects (the natural gas project and district heating networks). The latter had namely been implemented under the assumption of high oil prices. To secure the financial viability of these infrastructure projects it was necessary that the alternative costs of energy supply (oil) were kept at a high level.
Coal
Energy taxes were introduced on coal in 1982. They were initially set at a lower level than for oil products in order to continue to support the efforts to reduce Danish dependency on oil as a source of energy. In the beginning of the 1990s, when Danish energy policy began focusing strongly on the reduction of CO2 emissions, the energy taxes on coal were raised to levels similar to those that apply to oil.
Natural gas
Natural gas was introduced in Denmark in 1984. Until 1996, taxes were not levied on natural gas. However, natural gas was sold to end-users at prices equivalent to the consumer price (inclusive taxes) of competing fuels. Thus, natural gas was sold to households at a price equal to the price of gas oil inclusive taxes. In the case of industry, it was sold at a price equal to the price of fuel oil exclusive taxes (as industry paid no energy tax). The effect of this was that the gas companies received a de-facto subsidy as they were exempted from the tax, but were allowed to charge prices equivalent to those of competing products including the taxes. In other words, the gas companies could collect a shadow tax on the gas. This subsidy or shadow tax was allocated to the gas companies to enable them to finance the large capital expenditure that had been necessary for the rapid and extensive expansion of the natural gas network.
In 1997, an energy tax was introduced for natural gas. It was equal to about 75% of the energy tax on oil products. It is the intention to increase the tax to 100% before the year 2009. The tax in itself will lead to a large reduction in the subsidies that are allocated to the gas sector. To counterbalance this, various transitional measures have been introduced to ensure the financial viability of the gas companies.
The tax on natural gas was introduced mainly for two reasons: 1) to reduce the future subsidy given to the gas companies; and 2) to prepare the sector for an opening of the Danish gas markets. The exemption of tax on natural gas constitutes, as mentioned earlier, a de-facto subsidy to the sector. If foreign gas companies are allowed to sell gas in Denmark, they will consequently also receive this subsidy, unless a tax is introduced, which ultimately eliminates the subsidy.
CO2 taxes
CO2 taxes were introduced in 1992 for households and in 1993 for industry. Initially, the levels of the CO2 taxes were rather low compared to the energy taxes. However, for industry, it was the first tax that was levied on its use of energy. For households, the energy tax on oil products was reduced accordingly, so that the CO2 tax did not imply a net tax increase. The effect was merely that a part of the total tax was being levied according to the carbon content. To limit negative effects on the competitiveness of Danish industry, reimbursement schemes were put into effect for energy intensive industries.
In 1995, the CO2 tax applying to industry was revised. Further, industrial consumption of energy for space heating became subject to energy taxes.
The introduction of the CO2 tax in 1992/93 and the subsequent revisions in 1995 were, in both cases, components of more comprehensive tax reforms that aimed to increase taxation on resource use and pollution, and to reduce income taxes and other distortionary taxes.
SO2 taxes
A SO2 tax was introduced in 1996. It is to be phased in gradually until it reaches its full level in year 2000. For certain specified energy intensive industries the tax will only take its full effect after a fairly long transitional period. The motivation for this, regard concerns over the competitiveness of Danish industry.
11.5.2. Structure and levels of taxation on energy
The energy taxes have undergone substantial changes since their first introduction in 1977. This applies both to their structure and their levels. The latest changes are not fully implemented yet. The overall energy tax structure is fairly complicated, because there are a number of taxes, and they differ according to the various types of fuels. Furthermore, the tax rates do not apply similarly for all sectors. Here, the basic tax rates are reviewed first, followed by a description of how the tax rates apply in the various sectors. The key structure of the tax rates can be presented as follows:
| In 1999, the energy taxes on most fossil fuels are around 45 to 48 DKK/GJ. The energy tax on natural gas is only 37 DKK/GJ. However, the difference up to the oil tax level is collected by the gas companies as a “shadow tax”. Fuels for electricity production are not subject to energy taxes, but to an output tax, which is 134 DKK/GJ[4]. | |
| The energy tax only applies to fossil fuels. This implies that there is no tax on straw and other forms of renewable energy, although it should be noted that waste used for energy purposes is taxed. For district heating, the tax corresponds to DKK 25/GJ, and for CHP production it amounts to DKK 20/GJ. Heat production based on waste is currently taxed with an equivalent of DKK 5/GJ. This tax will gradually increase to reach a level of DKK 13/GJ by year 2002. | |
| The CO2 tax is equivalent to approximately 100 DKK per ton of CO2, and is principally an emission tax. However, there are no feasible ways to reduce the emissions of CO2 for a given type of fuel, because emissions are only determined by the content of carbon in the fuel. Therefore, the CO2 tax has been levied on the fuel instead of the actual emissions. The tax corresponds to a level of between DKK 6/GJ and 28/GJ where the lowest value applies to refined gas and the highest value applies to electricity. All other uses are at a level of DKK 10/GJ or lower. | |
| The sulphur tax is equivalent to 20 DKK per kg sulphur in the fuel or 10 DKK per kg SO2 emitted (which implies the same price per kg S). By the year 2000, the sulphur tax will amount to 0-9 DKK/GJ. The exact value will depend on the sulphur content of the fuel in question. The highest value will apply to brown coal, whereas the tax will be zero for fuels that contain little or no sulphur such as natural gas. Similar to the CO2 tax, the sulphur tax is principally an emissions tax. The level of emission of SO2 is normally determined by the quantity of sulphur in the fuel, and consequently the tax has been set based on the content of sulphur in the fuel. Contrary to CO2 however, SO2 can be removed from the flue gas or be absorbed in certain industrial processes. Therefore, the law provides those that are liable to the tax with the possibility to choose between two options for being levied the tax. One is to be levied with a tax based on the sulphur content of the fuel, and the other is to be levied with a tax based on the actual emissions. The latter option requires the installation of equipment to measure actual emissions. For all practical purposes, it will only be relevant in few cases. |
The total taxation of fossil fuels is at a level of around 55-63 DKK/GJ (natural gas only 43 DKK/GJ). Differences are due to variations of the various fuels with regard to CO2 emissions and sulphur content. The SO2 tax applies to renewable energy sources, whereas neither the energy tax nor CO2 taxes apply. Renewables, such as straw and wood chips, contain sulphur. The energy and environmental taxes are summarised in Table 11.2.
Table 11.2
Current rates for energy and environmental taxes and rates for year 2009.
DKK/GJ |
Energy tax |
CO2 tax |
SO2 tax |
Total |
|||
Year |
1999 |
2009 |
1999- |
1999 |
2000- |
1999 |
2009 |
Fuel oil |
47 |
50 |
8 |
4 |
5 |
59 |
63 |
Gas oil |
47 |
50 |
7 |
1 |
1 |
55 |
58 |
Natural gas |
37 *) |
51 |
6 |
0 |
0 |
43 |
57 |
Coal |
45 |
51 |
10 |
6-8 |
6-9 |
61-63 |
67-70 |
Renewables |
0 |
0 |
0 |
0-2 |
1-2 |
0-2 |
1-2 |
Note: The table does not consider fuels used for transport purposes.
*) Natural gas is priced at a level equal to the price of competing oil products,
including applicable taxes, which implies that the consumer also pays a “shadow
tax” to the gas companies, that is equal to the difference between the applicable
energy taxes levied on oil and natural gas.
The above taxes are differentiated among various types of users. In some cases, differentiatiated taxes may also apply according to the purpose of the energy use. Thus, VAT-registered enterprises pay the full tax, but a part of the paid taxes are refunded afterwards. The administrative aspects of such refunds are elaborated in the section 11.7. The below only considers the net payment.
The basic rules for the net payment of the above taxes are as follows:
| All users that are not VAT registered, i.e. mainly households and the public sector, pay the full taxes (energy and environmental taxes). On top of that they pay VAT of 25%. | |||||||
For VAT-registered enterprises, various schemes for tax reductions apply. First, a
distinction is made between energy that is used for space heating and energy that is used
for process purposes. For the process purposes, a further distinction is made between
light and heavy process industries:
| |||||||
| Energy used for electricity production is not liable to the taxes, but the output i.e. electricity, is subject to the energy tax, the CO2 tax and the SO2 tax. The levels for electricity are set so that they correspond to the case where the electricity was produced in a typical coal-fired power plant. Households that use electric heating as the main source of heat, however, pay an electricity tax that is around 13% lower than the ordinary tax on electricity. | |||||||
| Energy used for production of heat in district heating plants or in CHP plants is fully taxed. In combined heat and power production, various principles are used to determine how much of the energy consumption should be allocated to the heat production, and thus be liable to the tax. The outcome of this may significantly influence the effective tax level for district heating. |
The composition of the end-user price is illustrated below for selected examples of fuels and purposes.
Figure 11.1
Examples of end-user price inclusive taxes for households and industry
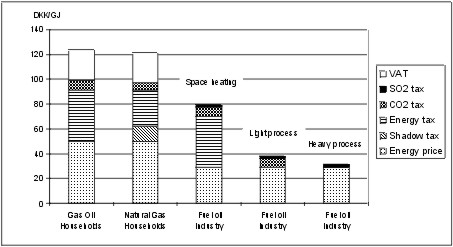
In the figure, the SO2 tax level assumes that the fuel oil contains 0.5% sulphur at the time when the tax is fully phased in. The figure demonstrates that there are large variations in the level of energy taxes when one considers the end user level. For households, taxes and VAT constitute 60% of the final price. For industry, the realised tax level is strongly dependent on the specific purpose of the use of energy. For the heavy processes, the figure assumes that the company has entered into an agreement on energy savings. In this way, the CO2 tax is reduced to 3% of the full value, whereby, the tax payment will almost only consist of the SO2 tax.
11.5.3. Fiscal effects of taxes
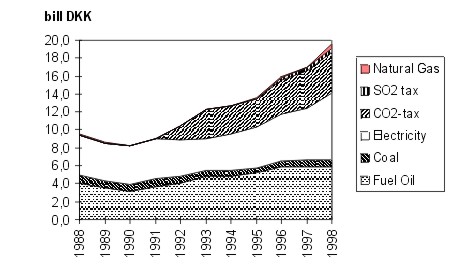
Taxes on energy and emissions provide an important source of revenue. This applies in particular to the energy tax. The figure below shows the development in the revenue from energy and environmental taxes over the last decade (the figure does not consider taxes on motor fuels).
The largest revenue contribution comes from oil and electricity. Coal is mainly used in the electricity and industrial sector and is therefore largely exempted of tax. Similarly, natural gas only provides a tiny share of the state revenue. This is, because the “tax” on natural gas is allocated mainly to the gas companies as a shadow tax.
The CO2 tax, which was introduced in 1992, contributed 23% of the total tax revenue from the energy sector in 1998. Part of the revenue from the CO2 tax is, however, recycled to the industry.
Figure 11.2
Revenue from energy and environmental taxes in the energy sector 1988 – 1998
11.5.4. Assessment of taxes
The structure and levels of the energy taxes and the environmental taxes in the energy sector presents a compromise between various goals and considerations that are, in some cases, conflicting. The taxes have been designed to contribute to the achievement of certain environmental goals, but other concerns have had an influence as well. Thus, fiscal aspects (generating revenue), distribution effects, the need to reduce the negative consequences for the competitiveness of the Danish industry, and the risk of relocation of heavy energy users to countries without CO2 taxes (carbon leakage), are all factors that have influenced the level and design of the taxes. This section will identify and assess the resulting incentives provided by the tax system to improve the environmental performance of the energy sector.
Residential sector
Energy taxes on fossil fuels are high for the residential sector, and for energy used for space heating in industry, and it is relatively high compared to European standards. By its mere size, it provides a significant incentive to general energy savings. The CO2 tax is levied on the fossil fuels in the same way as the energy tax, and thus provides a further incentive for energy savings.
The CO2 tax provides some incentive to switch to fuels that emit lower levels of CO2, such as natural gas. For households and other energy users that are subject to the full energy tax, the difference in the CO2 tax level between the various fossil fuels is, however, a very small fraction of the full price. A shift from, for example, gas oil to natural gas would only lead to a reduction in the price per energy unit of around 2% for households.
Renewables
Renewable forms of energy emit no CO2, and therefore, they do not become subject to a CO2 tax. This provides an incentive to replace fossil fuels by renewables. Furthermore, renewables are also exempted from the general energy tax. This exemption provides a much higher subsidy to the utilisation of renewable forms of energy, particularly in the sectors that have to pay the full energy tax. The high costs of utilising renewable forms of energy are, however, still a barrier for its wider adoption.
Industry
The industrial energy consumption has for many years been totally exempt of taxes. In 1993, CO2 taxes were introduced, and the general energy taxes now also apply to energy used in the industrial sector for space heating. Various schemes to reduce the CO2 tax for process industry apply, and the largest reduction schemes are applied for energy intensive industries. The level of taxes for the heaviest users of energy is fairly low, and thus provides a smaller incentive to save energy in the sectors where the opportunities probably are the greatest. Still, the total tax payment may be significant for the individual firm, and thus it may provide a significant incentive for behavioural changes in individual cases in spite of the large reductions. It should be noted that in this regard, a country such as Denmark with an open economy cannot unilaterally raise the taxes on energy for industrial uses without the risk of relocation of enterprises and losses in competitiveness. The effect of the taxes cannot be seen independently of the accompanying measures to promote energy savings in industry.
The high energy taxes, which apply to energy used for space heating purposes, do not affect the marginal cost of production, and should, therefore, have a smaller impact on the competitiveness of the industry. However, they do provide an incentive to save on these energy uses in industry.
Electricity generation
All fuels used for electricity generation are exempted of energy and environmental taxes. Instead, the taxes are levied on the electricity. Levied in this way, the taxes provide no incentives for a more efficient electricity production, for example, by promoting CHP production, or a switch to cleaner fuels. Rather, it has been sought to pursue these aims through the use of subsidy schemes. The taxes only give the end user an incentive to reduce the consumption of electricity. Taxes are not levied on the fuel, as it would increase the production costs of electricity in Denmark, and thereby also increase import and export prices, which would be harmful to the competitiveness of the Danish power companies – and the end-consumers.
The SO2 taxes makes up a very small part of the total taxes and exemption schemes exist for heavy industry, again out of competitiveness considerations. However, the tax has improved the competitiveness of natural gas vis-ŕ-vis fuel oil and coal. Furthermore, by decreasing the relative price of low sulphur grades of fuel oil and coal, the tax has provided an incentive for energy suppliers to bring such low sulphur products on the market.
11.6. Subsidies
Subsidies are – and have been – used extensively in the Danish energy sector to promote policy goals. The first subsidy scheme was introduced in 1977 where energy savings in the residential sector were promoted through partly financing (subsidising) the costs of insulation of houses. The overall aim of the subsidies have, in line with changing goals of the energy policy, shifted from focusing on reducing the dependency on imported oil, to now mainly focusing on reducing CO2 emissions. Various subsidy schemes in the energy sector have also supported other goals such as employment, for example, by supporting installations and energy savings measures that had to be installed by professional craftsmen.
At present, there are more than 10 different subsidy schemes in force in Denmark. The aim here is not to review all these various subsidy schemes, but to outline the main types of activities that have been subsidised and the ways in which such subsidies have been given. The subsidies in the Danish energy sector can be grouped in three main categories according to their aim:
| subsidies to promote CHP; | |
| subsidies to promote utilisation of renewable energy sources; and | |
| subsidies to promote energy savings/reduced CO2 emissions. |
The presentation of the subsidies below will not follow the individual subsidy schemes, but focus on the activities for which subsidies are given.
11.6.1. Subsidies to promote CHP
One of the cornerstones in Danish energy policy has been to increase the combined heat and power production. The combination of heat and power production provides higher overall energy efficiency, and thus energy consumption and CO2 emissions can be reduced.
During the 1990s, a number of subsidies have been introduced to improve the financial position of combined heat and power production vis-á-vis other forms of energy. The combined heat and power production is promoted in various ways. Some of the subsidy schemes are fairly general, such as the subsidy to electricity production and industrial CHP, whereas other schemes are trying to target specific aims such as marginal expansions of networks or connection of specific types of customers.
Subsidy to electricity production
The largest of the subsidy schemes is the payments to electricity produced from decentralised CHP plants, based on renewable forms of energy or natural gas. For each kWh electricity produced, the CHP plant received a payment equal to the CO2 tax on electricity, i.e. 0.1 DKK/kWh. In 1996 this payment was, however, reduced for natural gas fired CHP plants and for industrial CHP plants to 0.07 DKK/kWh, as the former level was considered to be too generous. Furthermore, electricity from CHP based on renewable forms of energy receives an additional payment of 0.17 DKK/kWh.
This subsidy applies to all CHP plants except for the CHP production at the large power plants. The subsidy in not limited in time, except for industrial plants where the subsidy is only paid for a period of six years.
The rationale for the subsidy is that fuels used for electricity production is exempted CO2 tax, as it is levied on the electricity. As the CO2 tax levied on electricity is determined based on the emissions from electricity produced from coal, the subsidy of 0.1 DKK/kWh can be said to constitute a refund of the CO2 tax levied on electricity.
Industrial CHP
To further increase the co-production of heat and power, the establishment of industrial CHP plants have been a policy objective. This has been promoted through the above-mentioned subsidy to electricity production and through additional subsidies to investments in industrial CHP-plants. Within the scheme for repayment of the CO2 tax to industry, investments in industrial CHP plants can receive a subsidy of 40% of the total capital expenditure.
Subsidy to conversion of district heating plants
In 1990, it was decided to convert the majority of the district heating plants in Denmark to CHP. To facilitate this conversion and to promote bio-fuels, subsidies were offered to the conversion of a number of identified district heating plants based on coal, and to the establishment of CHP plants based on bio-fuels.
The subsidies to the conversion of the coal fired district heating plants had an element of compensation. It was politically mandated that the plants, some of which were rather new, had to convert to CHP plants based on the natural gas or bio-fuels, depending on whether they were located in the natural gas supply area or not.
Subsidies to extension of district heating networks
Subsidies are given to the extension of networks for distribution of heat, so that the use of district heating based on CHP can be extended. One important criterion for giving these subsidies is, whether the subsidies result in an acceleration in time of planned expansions.
11.6.2. Subsidies to promote the utilisation of renewable energy sources
Subsidies to promote the utilisation of renewable energy are among the earliest subsidy schemes. Today, subsidies to renewable energy come in two forms:
| subsidies for investments, installation, and development of renewable energy solutions. This type of subsidy is given to households, industries, and institutions. The main receivers are solar heating, and biomass solutions. The subsidy scheme has been in force since 1981 but has been regularly adjusted to reflect the technological development and the economic conditions for various forms of renewable energy; and | |
| electricity produced by renewable sources of energy receives a subsidy of 0.27 DKK/kWh. This concerns electricity production from CHP plants, based on, for example, straw and refuse, which is mentioned in the above section, as well as electricity from private windmills. Windmills installed by the power companies are not entitled to the subsidy. |
11.6.3. Promotion of energy savings/reduction of CO2
The last major group of subsides are schemes to promote general energy savings or reduction in CO2 emissions. Subsidies are given to promote investments leading to energy savings. The schemes are mainly directed toward households or industry.
Energy savings in households
Earlier, general subsidies were offered to promote investments resulting in reduced energy consumption in households, e.g. insulation. Today, most houses are well insulated and insulation in new houses is regulated through building standards. Subsidies are, however, given to promote energy savings in pensionists’ households, as it was discovered that the energy consumption in these households was relatively high.
Furthermore, various subsidies are given to the conversion of heating systems in certain types of households. This concerns mainly the conversion of electricity heated houses to district heating, natural gas, or oil burners, and connection of old houses to district heating networks. In Denmark there are still quite a number of households that are heated by electricity. Due to the low overall thermal efficiency of electricity heating compared with other forms of heating, the conversion of electricity heated households presents an important options for further reducing the CO2 emissions. However, such a conversion involves a substantial initial investments, which has acted as a barrier in spite of considerable potential savings in the total energy costs.
Energy savings in the industry
In 1993, a CO2 tax was introduced for the industry. As a part of the repayment of the proceeds from this CO2 tax to the industry, investments aiming at energy saving can receive a subsidy of 30% of the costs. This concerns the previously mentioned investments in industrial CHP plants, but subsidies are also available for other activities including consultancy services, and investments in equipment with high energy efficiency.
11.6.4. Fiscal effects of subsidies
Total subsidies to the energy sector amounted to 1.8 billion DKK in 1996, and are set to increase to around 2.1 billion by the year 2000. The total payments under the subsidy schemes equalled around 10% of the total revenue from the energy and environmental taxes in 1996.
Subsidies to electricity production from small scale CHP or renewables are, by far, the largest scheme, and it accounts for around half of the total subsidy payments.
11.6.5. Assessment of Subsidies
Subsidies have been used extensively to promote policy goals in the Danish energy sector. There seems to be various reasons for using the subsidy instrument instead of e.g. taxation:
| Some subsidies are given to provide incentives that are absent, because of the way the energy taxes have been designed. This concerns the refund of the CO2 tax to CHP production and subsidies to energy savings in the industry. As it is considered damaging to the competitiveness of the industry if a full CO2 tax is applied on industrial energy consumption, energy savings are mainly promoted through subsidies. | |
| Some subsidies seem to be given as a kind of financial compensation. A number of district heating plants were instructed to convert to small scale CHP plants. Subsidies were offered to lessen the financial impact. | |
| Some subsidies are given to promote activities which otherwise would not have been undertaken. This covers, among others, subsidies to renewables, specific savings opportunities, and CHP connections. The key issue with regard to these subsidies is to ensure that subsidies are only given to activities that are; 1) socio-economically desirable; and 2) would not be implemented in the absence of subsidies. |
Energy and environmental taxes may not always be enough to achieve the desired goals (or they would have to be so high that they would have other unwanted effects, e.g. on income distribution and loss of employment). Taxes can make energy savings or switching to cleaner fuels more financially attractive, but to realise such financial gains, it is often necessary to undertake investments, for example, in insulation and/or new burners. Although the investments overall may be socio-economically advantageous, individual enterprises or households typically have very high required rates of return. In such cases subsidies for specific types of capital expenditure combined with appropriate taxes might be the best solution to achieve a certain behavioural change.
11.7. The role of economic instruments in achieving environmental goals in the energy sector
Economic instruments are typically used in combination with other forms or regulation to achieve the desired environmental outcome. The transformation of the Danish energy sector over the last decades have, to a large extent, been a centrally planned process using a combination of administrative regulations and targeted economic instruments.
The aim of this section is to investigate how economic instruments have been used in conjunction with administrative instruments in order to reduce emissions of CO2 , SO2, and NOx. For analytical purposes, the reduction in emissions can be said to be achieved through three principally different mechanisms, that are:
| the reduction in primary energy demand. The emission of harmful substances will be reduced through the general reduction in the energy consumption, and increased energy efficiency; | |
| the switching to fuels with less environmental impact. Emissions can be reduced by switching to fuels with a lower content of carbon or sulphur. This is, for example, the case for the replacement of coal and oil with natural gas; and | |
| abatement technologies. Removal of CO2 is not economically feasible, but both SO2 and NOx emissions can be reduced through cleaning or adoption of cleaner technologies. |
The present section will review in which fields economic instruments have played a role, and discuss possible explanation, for the use/non-use of economic instruments in various situations. To provide a background, the developments in the environmental performance of the energy sector will be presented first.
11.7.1. Overall environmental results
The figure below shows the development in emissions of CO2 , SO2, and NOx, compared with the development in total energy consumption.
Figure 11.3
Energy related emissions and energy consumption, 1986-1996 [5]
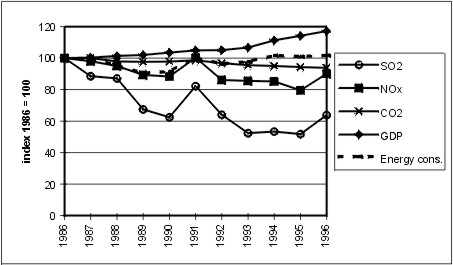
Source: Energy statistics 1997, Danish Energy Agency and Statistical ten-year review 1997, Danmarks Statistik.
As can be seen from the figure, CO2, NOx, and SO2 emissions have decreased over the last decade, in absolute terms as well as compared to the energy consumption. In spite of GDP growth of around 17% in real terms over the illustrated 10 years period, energy consumption has remained fairly constant.
The national target for CO2 emissions is to achieve a reduction of 20% by the year 2005, compared with the emissions in 1988. In 1997, CO2 emissions amounted to 94% of the level in 1988, based on the adjusted emissions. Further reductions are thus required, which also is reflected in the energy plan, “Energy 21”, of which the main aim is to address this deficiency in reduction of CO2 emissions.
The target for SO2 emissions is a 80% decline of the level in 1980 to be achieved by the year 2000. In 1996, emissions amounted to 41% of the 1980 level. In the years to come natural gas will increasingly replace coal in the electricity sector, thereby reducing SO2 emissions. The effects of SO2 tax is not included in the above figure, as it will only be fully introduced in the year 2000.
The target for NOx emissions is to achieve a reduction by 30% of the 1986 emissions by the year 1998. In 1996, emissions equalled 90% of the level in 1986. The main source of NOx emissions is the transport sector, which has increased stronger than anticipated. NOx emissions originating from power production have successfully been reduced over the last couple of years.
11.7.2. Measures to reduce total energy consumption
Reductions in the total energy consumption has been a prominent goal of the Danish energy policy since it inception; in the start, to reduce dependence on imported oil, and later, primarily to reduce the emissions of CO2.
Since 1973, the energy consumption has remained more or less constant, whereas GDP has grown with more than 50% in real terms. The implication is, that energy intensity has improved by around 35%, where energy intensity is measured as energy consumption per unit of GDP. The energy intensity is, however, not only a result of efforts to reduce energy consumption and increase energy efficiency, as factors such as the general technological development and structural changes in the economy, also affects the energy intensity.
Regulatory efforts to reduce energy consumption have mainly aimed to reduce final consumption in households, industries, and others, and to promote CHP by increasing the efficiency of energy conversion.
Final energy consumption
The figure below shows the development in final energy consumption for the main sectors in the economy. As shown, the final energy consumption has decreased in the residential sector, remains fairly constant in the industry and service sector, and has increased greatly in the transport sector.
Figure 11.4
Development in final energy demand by main sectors
1980 – 1988 – 1997
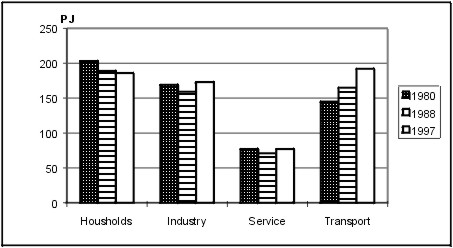
Source: Energy Statistics 1997, Danish Energy Agency
Savings in energy consumption in the residential sector have come about through a combination of high energy taxes and subsidies, which have made, e.g. insulation more financially attractive. Furthermore, norms and standards, e.g. for construction of new houses, have also contributed to lower final demand.
Due to concerns about the impact on competitiveness, energy and environmental taxes have only recently been applied in the industrial and service sector, and the full effect of these will hardly be visible in the statistics yet. Subsidies to investments in energy savings in the industrial sector were introduced in 1993 in connection with the returning of the CO2 tax to the industry. Direct regulation of industrial fuel use has seldom been used.
Promotion of CHP
By utilising the excess heat from power production in district heating networks, the overall energy efficiency of the system is increased, and the total energy consumption will be lower.
The CHP production has increased substantially over the last decade. In 1997, district heating accounted for nearly 40% of the total final energy consumption for heating purposes in the residential sector[6]. Of the total district heating production, nearly 80% came from co-production of heat and power in 1997, compared with a share of only 50% a decade ago. The large increase has mainly been caused by the earlier conversion of district heating plants to small-scale CHP plants, and by increasing the CHP production from the large CHP plants.
The promotion of small scale CHP and conversion of a large number of decentralised district heating plants have been carried out during the 1990s. Large subsidies have been available for such small scale CHP plants, but the conversion of these district heating plants were politically mandated and the plants had to convert to CHP according to plans elaborated by the central energy authorities. Furthermore, if a district heating plant was located in the natural gas area, it should use natural gas and otherwise domestic fuels, such as straw, waste, and wood chips. The subsidies have resulted in a faster, more extensive conversion than required by the energy authorities.
Industrial CHP has grown strongly since 1993, where subsidies were introduced. Subsidies concerned the earlier mentioned 0.1 DKK/kWh and 30% of the capital expenditure. For many enterprises, such subsidies meant that the payback period was only 2-3 years. By 1997, more than 100 industrial CHP plants had been installed, representing around 300 MW of electric capacity. The subsidies made these plants very financially attractive, but since the subsidy to electricity production in industrial CHP was reduced in 1996, the installation of further plants has practically stopped.
11.7.3. Measures to influence fuel choice
By switching from fuels with a high content of carbon or sulphur to fuels with a lower content, the emissions of CO2 and SO2, respectively, will be reduced. Over the last decade, the composition of the Danish energy supply has changed markedly. The share of coal, which is the fuel that emits most CO2 per GJ, has decreased from 39% in 1988 to 26% in 1997, whereas the shares of natural gas and renewable energy has increased over the same period from 8% and 6% respectively, to 20% and 9% respectively. The share of oil has remained constant at about 45%, hiding an increase in consumption of oil products in the transport sector and decrease of the share of oil in the remaining sectors. This switch away from coal and toward natural gas and renewables has had a marked effect on the emissions of CO2 and SO2.
Promotion of renewables
The share of renewable energy in various sectors in 1988 and 1997 is shown in the table below:
Table 11.3
Use of renewable energy in various sectors. 1988 and 1997
1988 |
1997 |
|||
Households |
14.2 PJ |
(7.7 %) |
15.8 PJ |
(8.5 %) |
Industry and service |
10.6 PJ |
(4.8 %) |
10.7 PJ |
(4.3 %) |
District heating and |
22.8 PJ |
(7.0 %) |
48.5 PJ |
(11.2 %) |
Note: the numbers in parentheses show the share of renewables in the sectors total energy consumption
Utilisation of renewable forms of energy has been promoted strongly through a combination of large tax differentials between fossil fuels and renewables, and through various subsidy schemes as outlined in the previous chapter. The tax differential is only relevant for the residential sector, as other sectors do not pay energy tax (except for the recent introduction of energy tax for space heating in service and industry). Renewables account for around 8% of the final energy consumption in the residential sector, but this share has remained practically unchanged over the last decade.
The whole increase in the utilisation of renewables over the last decade stems from the district heating and power production sector, where the use of renewables has more than doubled. This increase is mainly attributable to direct regulation of the sector. Coal and oil fired district heating plants have been instructed to convert to CHP plants using bio-fuels if the plants were located outside the natural gas sector. This conversion has been supported by subsidies for investments, as well as to electricity production. The central energy authorities have made agreements with the power companies on the utilisation of straw as fuel in central power plants, and on establishing the specified capacity of wind power.
Introduction of natural gas
A key contribution to the reductions of CO2 and SO2 emissions stems from the replacement of coal and oil with natural gas. The use of natural gas in the various sectors in 1988 and 1997 is shown in the table below.
Table 11.4
Use of natural gas in various sectors. 1988 and 1997
1988 |
1997 |
|||
Households |
13 PJ |
(7 %) |
28 PJ |
(15 %) |
Industry and service |
22 PJ |
(10 %) |
50 PJ |
(20 %) |
District heating and |
20.3 PJ |
(6 %) |
66 PJ |
(15 %) |
Note: the numbers in parentheses show the share of natural gas in the sectors total energy consumption
As seen from the table, the consumption of natural gas has increased strongly over the last decade, where the share of natural gas has doubled in all sectors. In the coming years the share of natural gas in the power and CHP sector is set to increase further.
Although natural gas has been favoured by lower taxation, the end-user prices have mainly been kept at the same level as the competing fuels inclusive applicable taxes. The large tax difference between gas and oil products for the residential sector has thus not been transformed into lower prices. The tax exemption of natural gas has benefited the gas companies as they could collect the “shadow tax”, which effectively equalled a subsidy offered to gas sales. This has given the gas companies incentives to a rapid and wide extension of the natural gas network. To increase connection, the gas companies have offered potential customers targeted subsidies, e.g. in the form of free installation of natural gas burners.
The sale of natural gas to industry has been done in mainly free competition with alternative fuels, typically fuel oil, and energy taxes have had little importance. Since the introduction of the CO2 tax for industry and the SO2 tax, the competitive position of natural gas has improved vis-ŕ-vis other fossil fuels in the industrial sector.
The use of natural gas for combined heat and power production has, to a large extent, been directly regulated. As mentioned earlier, small-scale CHP plants in the natural gas supply area had to use natural gas. Subsidies to electricity production are, however, also offered. For the large power plants, the general line of the energy policy since Energy 2000 from the year 1990 has been to ban new coal-fired plants, which effectively means that new plants should be gas fired. The installation of new power plants with an electricity production capacity of more than 25 MW has to be approved by the central energy authorities, and the technical design and fuel supply are a part of this approval.
Switch to low-sulphur fuels
Coal and fuel oil are especially marketed with greatly varying levels of sulphur content, e.g. in international markets. Fuel oil is typically found in a qualities with 1% or 3.5% sulphur. In Denmark, fuel oil and coal is mainly used in the industry and the power production sector.
The sulphur content of fuel oil has been regulated though a maximum allowable limit of 1%. The recently introduced sulphur tax should give an incentive to market fuel oil qualities with lower S-content. Today, fuel oil from the two Danish refineries are marketed with a S-content of 0.5% and 0.69%, respectively, compared with 1% before the introduction of the SO2 tax.
The Danish power companies are using large quantities of coal. No SO2 tax is levied on coal for power production, but the total emissions are regulated through quotas which are reduced year by year. To fulfil these quotas, the power companies have, among other measures, purchased coal with a lower sulphur content.
11.7.4. Measures to promote emission abatement technologies
Abatement technologies include processes where part of the sulphur is retained in the ash e.g. fluegas cleaning, low NOx burners. There are, as earlier mentioned, no economically feasible options for cleaning or removing CO2 .
For the electricity sector, adoption of appropriate measures to clean and remove SO2 and NOx from the fluegas are governed by quotas set by the central energy authorities for emissions. Furthermore, in all new power plants, deSOx and deNOx equipment have to be installed, i.e. equipment to remove the SOx and the NOx.
For the industry, the SO2 tax gives, in principle, an incentive to implement measures to reduce SO2 emissions. However, as heavy users of coal in a transition period are partly exempted from the tax, and as most options for cleaning or removing SO2 emissions are rather costly, it is not likely that the tax will have a significant effect in this regard in the following years.
11.7.5. Overview and assessment of the role of various types of instruments
The table below crudely attempts to summarise in which subsectors and for which purposes, the economic instruments, as opposed to administrative regulations, have been used.
Table 11.5
Overview of the use of regulatory instruments in the energy sector
Measures to promote energy savings |
Measures to influence the choice of fuel |
Measures to promote for abatement |
|
Households |
High energy taxes plus selective subsidies |
Tax differentiation between fuels Mandated connection to collective energy supply systems |
|
Industry |
Recent introduction of energy and environmental taxes combined with subsidy schemes |
Tax differentiation between fuels (SO2, CO2 taxes) Limits on maximum sulphur content |
(SO2 tax might have an impact) |
Power production |
By law, the power sector is committed to engage actively in energy savings |
Direct regulation of fuel choice |
Direct regulation and use of quotas for SO2 and NOx emissions |
District heating |
Mandated conversion to CHP. |
Mainly direct regulation of fuel choice |
Note: The economic instruments are printed in italics
Both economic instruments and direct regulation have been used extensively in the energy sector, but the relative importance of the two types of measures differs strongly between the various subsectors.
Economic instruments have been widely used to influence the level of energy consumption in the residential sector. High energy taxes, combined with various subsidy schemes, have provided incentives for energy savings through connecting to the collective supply system. However, these instruments have been used in a framework for the overall central planning of the collective energy supply systems. For example, mandated connection of individual households to the natural gas and large district heating systems has been used.
Industrial decisions on energy use have, until recently, only been very lightly influenced by regulatory instruments. With the introduction of the tax reform in 1995, the use of economic instruments are gaining importance with regard to the industrial energy consumption, where especially, the development of industrial CHP has been increased, strongly due to subsidies.
Direct regulations have been the dominant type of instrument applied in the power sector, to the extent that such regulation have involved extra cost. The electricity consumers have borne them, as the electricity prices are regulated to cover all necessary costs.
The district heating sector has largely been subject to direct regulations, especially with regard to the mandated conversion of district heating plants to CHP plants based on specified types of fuels. To compensate district heating consumers, and to facilitate the conversion, large subsidies have also been offered.
11.8. Administrative aspects
The present section aims at discussing the key administrative issues related to the implementation and use of economic instruments in the Danish energy sector. The main focus will be put on the administrative complexities introduced with the CO2 package of 1995.
11.8.1. Payment of energy and environmental taxes
The energy and environmental taxes are, as a general rule, levied as high as possible in the distribution chain, where the number of companies is typically low, and the efforts to control compliance therefore limited. For example, taxes on oil products are levied on the importer or the refinery, and electricity taxes are levied on the power producing companies.
The Department of Customs and Excise is responsible for levying, collecting and controlling, the payment of energy and environmental taxes.
When the levying of taxes are done at the level of oil imports/refining, it is not possible to differentiate taxes at the moment of levying, according to the end-users and the type of end-use, as it was outlined in section ??. Instead, the full energy and environmental taxes are paid by the oil importer or refinery, and these taxes are fully reflected in the sales prices, irrespective of the type of customer.
To achieve the earlier described differentiation of taxes between the type of end-uses, the Department of Customs and Excise reimburse the part of the paid taxes to those (VAT-registered enterprises) that should not pay the full tax. The repayments as a percentage of the full taxes are summarised in the table below. The full taxes minus these repayments correspond to the net energy taxes presented in section 11.5.
Table 11.6
Reimbursement schemes per sector (%), 1998
Households and the public sector |
Industry |
Energy sector |
|||||
Elec- |
Space heating |
Space heating |
Light process |
Heavy process |
Elec- |
Heat |
|
Energy tax |
100% |
100% |
|||||
CO2 tax |
0% |
0% |
10% |
75% |
100% |
0% |
|
SO2 tax |
0% |
0% |
|||||
Source: Based on AKF, 1997.
To simplify the system, the reimbursement of energy and environmental taxes are administratively combined with the system for the collection of VAT, which includes all relevant companies who are already registered with The Department of Customs and Excise. When reporting the VAT account, the companies also calculate the reimbursable energy and environmental taxes paid during the period in question.
To determine the repayment of taxes, the Department of Customs and Excise must know the distribution of energy consumption between process and space heating. It is the individual companies which have to report how the energy consumption is divided between these purposes. To document the energy used for process purposes, the company must install the necessary meters. In the absence of meters, the energy will be assumed to have been used for space heating and the full energy and CO2 tax will apply. Companies using energy for process purposes, thus have a strong incentive to install meters.
It is the role of the Department of Customs and Excise to control the allocation of energy on the type of end-use. Companies which submit incorrect information or suppress relevant information can be fined.
Before the introduction of differentiated tax rates depending on the end use of industrial energy consumption (space heating versus process), the repayment of energy taxes was a fairly mechanical administrative task. Now, the Department of Customs and Excise must, in principal, control all enterprises that are using energy for process purposes. First of all, this concerns a large number of enterprises, and secondly, the allocation of energy between space heating and process is not always straight forward, e.g. disputes have concerned how to tax surplus heat from industrial processes, when the surplus heat is used for space heating.
The CO2 taxation package from 1995 includes possibilities for the further reduction of the CO2 tax for energy intensive enterprises. If these enterprises enter into an agreement on implementing certain energy savings measures, the CO2 tax will be reduced to a level of 3% of the full value for energy used for heavy processes (and to a level of 68% for light processes).
The Danish Energy Agency is responsible for the entering into and the elaboration of these agreements on energy savings with the relevant enterprises. It is also the Danish Energy Agency who is responsible for the actual payments of this further reduction of the CO2 tax. The administration of this part of the CO2 package has therefore been assigned to the energy authorities, i.e. the Energy Agency.
The CO2 package from 1995 has increased the complexity of the administrative procedures substantially. In connection with the proposal for adoption of the law, it was estimated that the system would require an additional staff of 46 persons. Of these, the majority would be required in the Danish Energy Agency to implement the agreements on energy savings and to administer support to investments in energy savings.
11.8.2. Assessment of administrative requirements
The main aim of the CO2 tax package of 1995 was to strengthen the incentives for energy savings/CO2 reductions in industry, as that sector had previously been nearly exempt of all taxes. However, to avoid negative effects on the competitiveness of the Danish industry, a distinction between space heating and process energy was introduced.
This distinction adds a new dimension to the administration of energy taxes. Through the whole life of energy taxes in Denmark, there have been different tax rates for different types of end-users, but now different rates also apply for the energy consumption within the premises of individual end-users.
The Department of Customs and Excise have to control the allocation of energy among purposes within the individual companies, which demands new forms of knowledge concerning the energy flow in the companies. The complexity of the system and the need to install meters, also increases the companies’ costs.
The part of the CO2 package concerning agreements is a targeted instrument to promote savings. For each relevant enterprise, the energy authorities have to assess the energy savings potential, which, if the system is to work properly, also demands more administrative personnel with a knowledge of industrial energy consumption issues.
The aim here is not to assess the CO2 package as such, but only to point out that the increasingly targeted economic instruments also strongly increase the costs of administration, for both the authorities and industry. This is, because it demands more and better skilled personnel to ensure proper administration and that the systems function.
Notes:
In 1999, DANGAS and one of the five distribution companies were merged which changes the structure in part of the market.
The tax on electricity is calculated based on the energy taxes that would result if electricity were produced by coal, with an overall efficiency of 35% at delivery to the final consumer.
Energy consumption and CO2 emissions are temperature corrected and adjusted for net foreign trade of electricity. The SO2 and NOx emissions are actual emissions, and the increase in 1996 is due to large export of electricity.
[Front page] [Contents] [Previous] [Next] [Top] |