[Front page] [Contents] [Previous] [Next] |
Alternatives to animal experiments for eye irritation
3. The COLIPA study
3.1 Design of the study
3.2 Alternative methods
3.3 Prediction models
3.4 Test substances
3.5 Distribution of test substances and collection of in vitro results
3.6 Statistical analyses
3.7 Further analyses of the results obtained in the COLIPA study.
3.8 Discussion
In 1993, COLIPA initiated a large program on validation of alternative methods to the Draize eye irritation test. The study was concentrated on test of cosmetics ingredients and formulations.The COLIPA study was designed to build on the lessons learned from a former validation study in this field arranged by the EU Commission and British Home Office (the EU/HO study) (Balls et al., 1995), where 40 % of the participating laboratories were from the cosmetics industry. 20 test substances were common to both studies, and several alternative methods were also used in both studies.
Figure 3.1 Look here
Management chart of the COLIPA eye irritation study. The tissue model SKIN2
ZK1200 is used in the tissue equivalent assay.
The specific goal of the study was to determine whether a set of alternative methods would
be valid for the prediction of the eye irritation potential of cosmetics ingredients and
formulations. As a consequence, it was one of the specific goals of the study to evaluate
if the alternative tests could be used as replacements for animal experiments on ocular
irritancy (de Silva, 1996). Specifically, the program was designed to determine whether
data from alternative methods could provide: 1. an acceptable agreement with the Draize
test modified maximum average score (MMAS), 2. an acceptable agreement with the Draize
test individual tissue scores and time to recovery, and/or 3. a proper prediction of the
eye irritation potential in the rabbit eye according to a prediction model.
3.1 Design of the study
The study was sponsored and organized by COLIPA, but some independent research groups participated in the study. The Danish Veterinary and Food Administration, Institut of Food Safety and Toxicology, participated in the study on a grant from the Danish Environmental Protection Agency in a co-operative project. COLIPA formed a Task Force Committee, which was responsible for the overall design of the study and for establishment of the policies to be followed during its conduct, and a Management Team was appointed to oversee the day-to-day conduct of the study (see figure 3.1). Each group of laboratories had a lead laboratory, which was responsible for the contact between COLIPA and the participants, established the test protocol and prediction model for the test, and monitored the progress in other laboratories.
3.2 Alternative methods
The COLIPA study included 10 alternative methods, which already were being used in the cosmetics industry as screening tests.
SKIN2 ZK1200
In this assay, a reconstructed tissue with keratinocytes seeded on a stroma of epidermal fibroblasts from human foreskin is used. The fibroblasts were grown on a nylon mesh matrix, and a coherent stroma was produced within a month. The keratinocytes were seeded to this stroma, and a 3-4 cell layer epithelium was generated. 1 x 1 cm tissues were produced as a commercial test kit, SKIN2 ZK1200, by Advanced Tissue Sciences in California. Kits with 24 tissues were packed in trays, embedded in a nutrient agar, and transported to the participating laboratories by plane.
The test substances were applied undiluted to the epithelial surface of the tissues in fixed concentrations of 25 ml or 25 mg. After exposure to the test substances for up to 60 minutes, the tissues were washed and the viability of the cells was measured with the MTT test. MTT is a yellow tetrazolium compound, which is reduced to a purple formazan salt by cellular redox processes. The purple product was extracted with isopropanol, and the optical density was measured at 540 nm. For each test substance, a t50 value was determined. This is the exposure time, which leads to a 50% reduction of the MTT reduction. The test had a mathematical prediction model that was established on the basis of historical data for 132 ingredients and products. All ingredients and products could be accommodated with the method. The production of the model has ceased after the COLIPA study was completed.
Neutral red uptake
The neutral red uptake test was performed on 3T3 mouse fibroblasts. Neutral red is selectively retained by the lysosomes in living cells because of the differential pH of the lysosome and the cytoplasm. The amount of neutral red taken up by the cells is directly proportional to the number of viable cells present. The test substance concentration giving a 50% reduction in the neutral red uptake was determined. The test had a mathematical prediction model that could predict MMAS values up to 60. The model was established on the basis of historical data for 30 substances of which 29 were surfactants. A limitation of the method is that inorganic acids and bases can not be tested, and that only water soluble compounds can be accommodated.
Red blood cell test
Damage to the cell membrane is assessed by measuring the leakage of haemoglobin from red blood cells incubated with test substances. Protein denaturation is also measured by determining the reduction of oxyhaemoglobin. The test substance concentration causing 50% haemolysis relatively to a totally lysed sample was determined. Both the lowest concentration of the test substance causing denaturation and the maximum percentage denaturation were determined. The test had a mathematical prediction model that was established on the basis of historical data for 25 finished products, and a classification model that was established on the basis of historical data for 100 substances. A limitation of the method is that only water soluble or water miscible compounds can be accommodated.
The Predisafe test
In this assay the cell viability is assessed after a short exposure time (< 1 minute) to the test substances by measuring the neutral red release from pre-loaded SIRC cells (rabbit corneal cells). The test substance concentration giving a 50% reduction in the neutral red uptake is determined. The test had a mathematical prediction model that was established on the basis of historical data for 47 finished products. All ingredients and products could be accommodated.The silicone microphysiometer
Cultures of murine fibroblasts (L929 cells) were grown on Transwell membranes, and transferred to a sensor chamber on a CytosensorTM silicone microphysiometer. The metabolic rate was measured continuously as decreased extracellular pH. The test substance concentration causing a 50% reduction in the metabolic rate was determined. The test had a mathematical prediction model that was established on the basis of historical data for 133 surfactant and surfactant based products. Only water soluble substances can be accommodated.
The CAMVA test
In this assay, changes in the blood vessels (VAscular changes) of the chorioallantoic membrane (CAM) of fertilized hens eggs are determined. The eggs are incubated for 3 days and on day 4, a small hole is drilled into the egg and approximately 2.5 ml albumin removed. A 2 x 2 cm window is cut through the shell, and on day 10 a teflon ring is placed on the CAM and 40 ml of the test substance is pipetted into the ring. The window is sealed, and the egg is reincubated. The CAM response was evaluated after 30 minutes, and vascular haemorrhage, capillary injection and the presence of ghost vessels were considered to be a positive response. The calculated concentration theoretically producing a reaction in 50% of the eggs is determined. The CAMVA test had two different mathematical prediction models. One model for alcohols that was established on the basis of historical data for 4 substances, and one for other compounds that was established on the basis of historical data for 19 substances. The last model excludes results obtained with polyethylenglycol-fatty acids and the related fatty amide ethanolamides.
EYTEX
The EYTEX test was a commercial test kit with a plant protein that may be opacified after contact with a test substance. The turbidity was determined with a colorimeter. A set of calibrators provided a direct comparison with a Draize scale to determine an EYTEX Draize equvivalent. The EYTEX test had a mathematical prediction model that was established on the basis of historical data for a wide range of test substances. MMAS values up to 99 could be predicted. The model could not be used to predict the irritancy of products containing manganese violet, >5% urea, >3% aluminium chlorohydrate, >5% zink oxide or surfactants at >40% active ingredient. The production of the model has ceased after the COLIPA study was completed.Pollen tube growth
The assay is based on photometric quantification of pollen tube growth. Pollen grain from Tobacco plants are cultured for 18 hours in the presence of the test substance. The mass of pollen tubes produced during the incubation period was determined photometrically using the dye Alcian blue. The test substance concentration causing a 50% reduction in the production of pollen tube mass was determined. The test had a mathematical prediction model that was established on the basis of historical data for 43 finished products. All ingredients and products could be accommodated with the method.
The HET-CAM test
In this assay, changes in the blood vessels in the chorioallantoic membrane of fertilized hens eggs are determined. The test substances were applied to the CAM on day 9, and the CAM response was evaluated after 5 minutes for transparent test substances and after 30 seconds for other substances. Vascular haemorrhage, lysis and coagulation were considered to be a positive response. The result was converted to an irritation index using a computer program. 5% Texapon SVF (an anionic surfactant) was used as a positive control. The HET-CAM test had a classification based prediction model that was established on the basis of historical data for 97 substances. A limitation of the method is that substances that stick to the membrane and highly coloured compounds cannot be accommodated.
Fluorescein leakage
In this assay, confluent Madin-Darby Canine kidney cells are exposed for 15 minutes to five fixed concentrations of the test substance. The amount of damage to the cellular monolayer was determined by determination of the amount of fluorescein leaking through the cell layer. The test had a classification based prediction model that was established on the basis of historical data for 43 surfactants and formulations. Only water soluble compounds could be accommodated.
3.3 Prediction models
Prediction models were established for each alternative test in order to assess the reliability of the methods. Prediction models are algoritms that converts the results from the assays into a prediction of the in vivo toxicity. It is difficult to assess the performance of an assay which does not have a prediction model since the relationship between in vitro and in vivo data has not been defined (Bruner et al., 1996).
The prediction models used in the COLIPA study were developed on the basis of historical data for the tests. The prediction models defined four elements needed to predict in vivo toxicity from in vitro results: 1. a description of the types of test substances for which the prediction model may be used, 2. a description of the types of data provided by the assay, including which data the prediction model can accommodate, 3. an algoritm defining how to convert the results from the assay into a prediction of the in vivo toxicity, and 4. an indication of the accuracy of the predictions.
The reliability of the prediction models was evaluated by determining whether the assay results were reproducible between the laboratories, and whether the data obtained fitted within the prediction intervals of the prediction models. After the COLIPA study was completed, the relevance of the alternative methods in predicting the eye irritation potential was considered to be a separate issue (Brantom et al., 1997).
Two different types of prediction models were used in the study. One group of models were mathematical functions converting the in vitro data to a broad spectrum of Draize MMAS values. Another group was non-continuous classification models that related the in vitro data to various irritancy classes. Different statistical methods had to be used to analyse the results obtained with the in vitro methods, depending on the type of prediction model used. Additionally, the basis for the comparison of the in vitro and in vivo results was not fully standardized. The data obtained with the HET-CAM test were compared to Draize test individual tissue scores, whereas Draize test MMAS values were used for all the other in vitro systems.
3.4 Test substances
The COLIPA study included 55 test materials covering a broad spectrum of cosmetics ingredients and finished products. The test substances were not only water soluble surfactant based products, but solids, powders, cremes, coloured products and alcohol based products were also included. The 55 test substances covered the whole spectrum of the Draize test MMAS 110 point scoring scale.
The first 23 test substances were ingredients (see table 3.1). The in vivo eye irritation data for these substances were supplied from the ECETOC data bank (ECETOC, 1998). All substances in this data bank have been tested for ocular irritancy in the Draize test according to OECD guideline 405. The ECETOC eye irritancy data bank includes both MMAS values and individual tissue scores for all the individual rabbits used in the experiments. 20 of these substances were common to the COLIPA study and the EU/Home Office study.
Table 3.1
Ingredients used as test substances in the COLIPA study
| Benzalkonium chloride 1% | Propylene glycol |
| Benzalkonium chloride 5% | Sodium hydroxide 1% |
| Benzalkonium chloride 10% | Sodium hydroxide 10% |
| n-Butyl acetate | Sodium lauryl sulfate 3% |
| Cetylpyrimidinium bromide 6% | Sodium lauryl sulfate 15% |
| Cetylpyrimidinium bromide 10% | Sodium lauryl sulfate 30% |
| Ethyl acetate | Trichloroacetic acid 30% |
| Glycerol | Triton X-100 1% |
| Imidazole | Triton X-100 5% |
| Isopropanol | Triton X-100 10% |
| Methyl ethyl ketone | Tween 20 |
| Polyethylene glycol 400 |
The other 32 test substances were finished cosmetic products (see table 3.2). The products were based on formulations that had been used in a large validation study arranged by the US cosmetics industry (CTFA), and the products had formerly been tested in vivo for eye irritancy. The results from these animal experiments could, however, not be used in the COLIPA study since a different protocol using local anaesthesia had been used. For this reason, new Draize tests according to OECD guideline 405 were performed on the 32 products by Agenc� du Medicament. The in vivo experiments were performed with one to six rabbits per test substance. The experiments were only repeated for two test substances, and in these cases the average scoring values from the two experiments were used. Due to the lack of adequate data, the variation on the in vivo experiments could not be evaluated.
Table 3.2
Formulations used as test substances in the COLIPA study
| Blush | Liquid soap |
| Cleansing foam | Mascara |
| Cologne | Moisturizer with sunscreen |
| Emulsion antiperspirant | Mouth wash |
| Eye liner | Perfumed skin lotion |
| Eye make-up remover | Polishing scrub |
| Eye shadow | Pump deodorant |
| Gel cleanser | Shampoo - 2 in 1 |
| Hair conditioner | Shampoo - antidandruff |
| Hair dye base formulation 1 | Shampoo - baby |
| Hair dye base formulation 2 | Shampoo - normal |
| Hair dye base formulation 3 | Shower gel |
| Hair styling lotion | Skin cleanser |
| Hand cleanser | Sunscreen lotion |
| Hand soap | Sunscreen SPF 15 |
| Hydrofilic ointment | Tooth paste |
The COLIPA study included two phases: the first 10 test substances were tested in 1994, and the remaining 45 materials were tested in 1995. All substances were tested blind and they were coded individually in order to avoid that the participating laboratories could compare their results before the study was completed. Since hazardous compounds were tested, the participants were supplied with the telephone number of a Poison Information Centre in case of accidents.
3.5 Distribution of test substances and collection of in vitro results
BIBRA International was taking care of the distribution of test substances to the laboratories, the collection of the in vitro results, and the statistical analyses of the data. All these functions were conducted due to GLP.
The participating laboratories submitted the in vitro results on standardized data sheets directly to BIBRA. The data included information on the codes of the samples, a description of the test materials, in vitro raw data and predicted in vivo data. The quality of the submitted data was controlled by BIBRA.
3.6 Statistical analyses
BIBRA performed the statistical analyses. Different statistical methods were used to analyse the results obtained with the in vitro methods, depending on the type of prediction model for the method, e.g. mathematical function or non-continuous classification model.
For in vitro assays with mathematical prediction models, the relevance of the methods was evaluated by analyses of linear correlations between Draize MMAS values that were predicted on the basis of in vitro data and observed Draize MMAS values. In addition, it was evaluated to which extent the predicted Draize MMAS values fitted with the relevant prediction model, and an assessment of the fit of the predictions within the 95% and 99% prediction intervals was performed. BIBRA also performed a goodness-of-fit test based on the sum of squared differences between predicted and observed Draize MMAS values. In addition, the ability of the in vitro methods to predict the in vivo response was evaluated on the basis of Altman/Bland plots of the difference between predicted and observed Draize MMAS values from each laboratory.
In order to evaluate the reproducibility of the alternative methods between different laboratories means, standard deviations and coefficients of variation were calculated for all the assays. Both non-transformed and log-transformed data were used. In addition, Altman/Bland plots were made on paired differences between predicted Draize MMAS values from the participating laboratories.
Both the relevance and the reproducibility of in vitro methods with classification models were evaluated using kappa statistics. The measure of agreement in the classification, kappa (k ), has a maximum on 1 when the agreement is perfect. A kappa value of zero means that the agreement is not better than change, and negative values shows a higher disagreement. The
kappa statistics can be used with equal or different weighting of the results. By equal weighting all disagreements will be treated in a similar way. Kappa statistics with linear weighting puts more weight to effects of disagreements of more than two classifications, and quadratic weighting gives an even higher weight to effects of disagreements of more than two classifications.
3.7 Further analyses of the results obtained in the COLIPA study.
One of the conclusions of the COLIPA study was that a further, more detailed analysis of the data generated in this study and the EU/Home Office study should be carried out, and that the knowledge gained should be used to design a future definitive validation study (Brantom et al., 1997). For the SKIN2ZK1200 model, additional data was available on 20 of the test substances from a third laboratory (Procter & Gamble, Cincinnati, USA). The SKIN2ZK1200 model was not planned to be included EU/Home Office study, but the assay was used by one of the participating laboratories on coded test substances, and the results had been submitted blind to BIBRA. In the further analysis, relationships between data obtained with the SKIN2ZK1200 model and individual Draize tissue scores were studied and an additional analysis of the assay reproducibility was performed. In addition, the data obtained in the COLIPA study with the SKIN2ZK1200 model was compared to the data obtained at Procter & Gamble (Southee et al., 1999).
3.8 Results
The SKIN2ZK1200 model
The SKIN2ZK1200 model performed well in predicting the Draize test response for all test materials. The test was performed in 2 laboratories: Microbiological Associates, Scotland (laboratory 21) and Institute for Food Safety and Toxicology, Denmark (laboratory 23). The first 10 test substances were also tested in a third laboratory, Laboratory Simon, Belgium (laboratory 22), and additional data on 20 of the compounds were available from Procter & Gamble, USA.
Figure 3.2
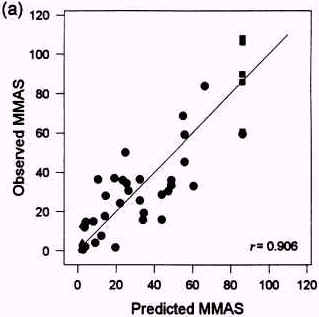
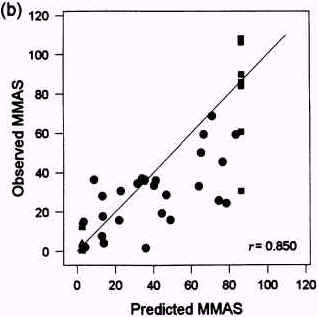
Relationships between Draize test MMAS values predicted with SKIN2 ZK1200 in laboratory 21 (a) and 23 (b) and observed MMAS values. From Brantom et al., 1997.
Very good correlations were obtained both in laboratory 21 and 23 between predicted and observed MMAS values (Brantom et al., 1997), see figure 3.2. The good correlations were maintained, when a separate analysis was performed for formulations and ingredients, see table 3.3. Good correlations between the SKIN2ZK1200 model 'core data' (t50 values) and individual Draize test tissue scores (r>0.8) were also obtained, but a relatively poor correlation (r = 0.66) was obtained to average days to clear the response in the Draize tests (Southee et al., 1999).
Table 3.3
Correlations between predicted and observed Draize test MMAS values in the
COLIPA laboratories using the SKIN2 ZK1200 model
| Lab 21 | Lab 23 | |
| All materials (n = 55) | r = 0.906 | r = 0.850 |
| Formulations (n = 32) |
r = 0.786 | r = 0.727 |
| Ingredients (n = 23) |
r = 0.896 | r = 0.826 |
The SKIN2ZK1200 model performed also well in reproducing the prediction model. No predictions fell outside the 95% and 99% prediction intervals for one laboratory (21) in the COLIPA study. For the other laboratory (23) only 5.3% of the data points did not fit the 95% prediction interval. These datapoints represented 7 test substances being slightly to moderately over predicted.
Figure 3.3
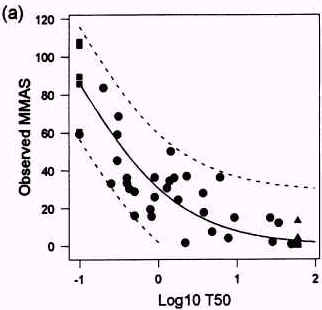
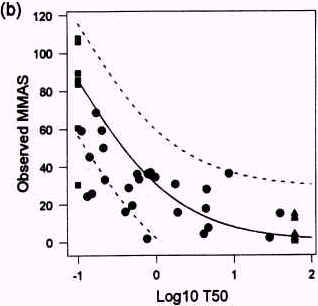
Relationship between t50 values obtained with the SKIN2 ZK1200 model in laboratory 21 (a) and 23 (b) observed Draize test MMAS values. The unbroken line shows the prediction model and the broken lines represents the 95% confidence intervals of the model. From Brantom et al., 1997.
Table 3.4
Correlations between predicted and observed Draize test MMAS values in the
COLIPA study for all test substances
| Methods | Pearsons linear correlation coefficients* | Number of tested substances ** |
| SKIN2 ZK1200 | r = 0.88 |
55 |
| Neutral red uptake | r = 0.29 |
52 |
| Red blood cell test | r = 0.68 |
32 |
| Predisafe | r = 0.65 |
55 |
| Silicone microphysiometer | r = 0.67 |
28 |
| CAMVA | r = 0.61 |
47 |
| EYTEX | r = 0.39 |
38 |
| Pollen tube growth | r = 0.43 |
55 |
*: Average of correlation coefficients obtained in the participating laboratories.
**: Average number of substances tested.
Interlaboratory reproducibility in the COLIPA study
As a supplementary test, a positive control (2% sodium lauryl sulphate, SDS) was included in all assays (see table 3.5).The mean % viability for the positive control was lower in laboratory 23 (29.4%) compared to laboratory 21 (49%) supporting the suggestion that there was a tendency to overpredictions in laboratory 23. Additionally, the mean OD540 of the untreated controls was higher in laboratory 21 than in laboratory 23, suggesting that the viability of the tissues may have been higher before the assay started in laboratory 21 than in laboratory 23. The CV's of the untreated controls were 15%.
Table 3.5
Positive and negative controls in the SKIN2 ZK1200 model
| Positive control (% viability) |
Negative control (OD540) |
|
| Lab 21 (n = 29) |
49.0 � 11.2 (CV: 22.9%) |
1.705 � 0.229 (CV: 13.4%) |
| Lab 23 (n = 14) |
29.4 � 14.2 (CV: 48.3%) |
1.404 � 0.138 (CV: 9.8%) |
CV = coefficient of variation
The % CV around the positive control was lower in laboratory 21 (22.9%) than in laboratory 23 (48.3%) suggesting that the intralaboratory variation of the assay was lower in laboratory 21. However, considerably more assays were completed in laboratory 21 than in laboratory 23, and this suggests that it is better to limit the number of materials tested at one time in the assay.
In the prediction of the Draize test response, log-transformed t50 values are used and this decreases the data variation considerably. The Altman/Bland plots of the difference between the observed and predicted MMAS values showed standard deviations of <15% i both laboratories using the SKIN2ZK1200 model. A scatterplot of the t50 values obtained with the model in laboratory 21 and 23 is presented in figure 3.3. There was a 100% interlaboratory agreement on 23 substances with t50 values of >60 minutes or <0.1 minute, and a linear correlation of r=0.92 (p<0.001) for 32 substances with t50 values falling between the cut-off points. There was a marginally significant difference (p=0.06) in the paired differences for each laboratory's core data for all the test substances. This was probably due to the tendency to over predict the in vivo response for the most reactive test substances (e.g. substances with t50< 0.1 minute) in laboratory 23. Therefore, the results obtained in the COLIPA study indicated that a good consistency in the data is obtainable with the assay (Southee et al., 1999).
Interlaboratory reproducibility in 3 laboratories
In general, the results with the SKIN2ZK1200 model obtained at Procter & Gamble under predicted the irritancy of the 20 substances tested compared to those generated in the COLIPA study (p<0.001)(Southee et al., 1999). The systematic under prediction at Procter & Gamble (USA) compared with the tendency to over predict at laboratory 23 (Denmark) relative to laboratory 21 (Scotland) suggests that the sensitivity of the SKIN2ZK1200 model may be strongly influenced by differences in the time of transportation of the tissues. During transportation the tissues were subject to unfavourable conditions as they were embedded in nutrient agar.
Another possible reason for the differences in results obtained is the use of a different dosing regimes. At Procter & Gamble the test substances were first applied to a coverslip and then applied to the tissues, whereas these substances primarily were applied directly to the tissues in the COLIPA study. Some test material may have been lost using the indirect application approach, and the toxicity of volatile substances may have been underestimated. In addition, the greatest discrepancy in results between the two laboratories participating in the COLIPA study was found for highly reactive and often solvent based substances. Subtle differences in dosing techniques with such substances may be expected to have a great influence on the results being obtained (Southee et al., 1999).
The consistency of data generated in different laboratories with the SKIN2ZK1200 model was apparent. The discrepancies seen between the laboratories suggest a high sensitivity of the SKIN2ZK1200 method to differences in application techniques, handling and time of transportation of the tissues from producer to customer. Production and sale of the SKIN2ZK1200 model have stopped, but other tissue equivalent assays that allow for topical application of test substances would be worthy of investigation for their ability to predict eye irritation (Southee et al., 1999).
Table 3.6
Correlations between predicted and observed Draize test MMAS values in the
COLIPA study for 23 formulations
| Methods | Pearsons linear correlation |
Number of tested substances ** |
| SKIN2 ZK1200 | r = 0.86 |
23 |
| Neutral red uptake | r = 0.63 |
21 |
| Red blood cell test | r = 0.81 |
11 |
| Predisafe | r = 0.54 |
23 |
| Silicone microphysiometer | r = 0.72 |
19 |
| CAMVA | r = 0.62 |
23 |
| EYTEX | r = 0.25 |
14 |
| Pollen tube growth | r = 0.53 |
23 |
*: Average of correlation coefficients obtained in the participating laboratories.
**: Average number of substances tested.
Table 3.7
Correlations between predicted and observed Draize test MMAS values in the
COLIPA study for 32 ingredients
| Methods | Pearsons linear correlation |
Number of tested substances ** |
| SKIN2 ZK1200 | r = 0.76 |
32 |
| Neutral red uptake | r = 0.21 |
31 |
| Red blood cell test | r = 0.94 |
21 |
| Predisafe | r = 0.87 |
32 |
| Silicone microphysiometer | r = 0.84 |
9 |
| CAMVA | r = 0.64 |
24 |
| EYTEX | r = 0.33 |
24 |
| Pollen tube growth | r = 0.78 |
32 |
*: Average of correlation coefficients obtained in the participating laboratories.
**: Average number of substances tested.
Other methods with mathematical prediction models
Relatively poor average correlations to Draize MMAS values were obtained with the in vitro methods with mathematical prediction models for the whole set of substances tested (see table 3.4). The full set of test substances was only tested in two of the assays (the pollen tube growth test and the Predisafe test). Therefore, the correlation coefficients obtained for the other assays are most likely overestimating their performance in predicting the Draize test response for mixed groups of chemicals and products. In general, the ability to reproduce the prediction models of the assays was modest, and all the assays had considerably more than 5% of the data points falling outside the 95% confidence interval. When a separate analysis was performed for formulations and ingredients, considerably better correlations between predicted and observed Draize MMAS values were obtained for several of the tests (see table 3.6 and 3.7).
Interlaboratory reproducibility parameters for the methods with mathematical prediction models are shown in table 3.8. The most and least reproducible tests appear to be the EYTEX system and the red blood cell test, respectively, evaluated on the basis of non-transformed CV’s. Using log-transformed CV’s, the CAMVA test appeared to be very unreproducible, while the reproducibility of the red blood cell was in the middle range of the alternative methods. Using the Altman/Bland standard deviations, the pollen tube growth test, the neutral red uptake assay and the red blood cell test appeared to have the best interlaboratory agreement.
Table 3.8
Interlaboratory reproducibility parameters for assays with mathematical
prediction models.
| Methods | CV%* |
CV% log |
Altman/Bland |
| SKIN2 ZK1200 | 25.0 � 32.4 |
9.6 � 106.6 |
13.7 |
| Neutral red uptake | 37.3 � 29.8 |
7.5 � 6.8 |
3.8-6.9 |
| Red blood cell test | 41.7 � 32.6 |
6.7 � 4.9 |
1.8-6.8 |
| Predisafe | 31.8 � 30.2 |
49.6 � 139.9 |
9.1-9.9 |
| Silicone micro- physiometer |
- |
3.0 � 4.0 |
7.5 |
| CAMVA | - |
114.0 � 480.7 |
14.7 |
| EYTEX | 9.9 � 10.3 |
- |
10.7-13.2 |
| Pollen tube growth | 23.8 � 17.9 |
3.9 � 3.4 |
3.2-4.5 |
* :Coefficient of variation
The CAMVA test and the silicon microphysiometer both had a relatively strong tendency to over predict the in vivo response, whereas the red blood cell test had a marked, but less pronounced tendency to produce false positives. A pronounced tendency to underpredict the Draize MMAS values using the EYTEX system was found in one laboratory. The other alternative tests did not markedly tend to produce either false positives or false negatives compared to the above mentioned assays (Brantom et al., 1997).
Methods with classification based prediction models
A summary of the kappa statistics on the predictive capacity of in vitro methods with classification models is shown in table 3.9.
Table 3.9
Prediction of Draize test irritation classes by in vitro methods with
classification models.
| The HET-CAM test | Fluorescein leakage test | |
| k * | 0.52 |
0.69 |
| Weightet k * (linear) | 0.65 |
0.81 |
| Weightet k * (quadratic) | 0.75 |
0.89 |
*: Average of kappa values obtained in the participating laboratories.
The predictive capacity of the HET-CAM test was evaluated to be poor. Each participating laboratory misclassified at least 7 of the 55 test substances by 2 categories. The HET-CAM test had its greatest success in identifying severe irritants, but there was an appreciable number of under predictions. The fluorescein leakage test performed better in predictive capacity, but only 40 of the 55 substances could be tested. However, only 4 test substances were classified to be moderate irritants, and this gives not enough data to evaluate the model. Additionally, the classification model does not discriminate between substances with MMAS values between 30 and 110. The interlaboratory reproducibility of the HET-CAM test was evaluated to be moderately good at the low and high end of the irritancy scale, but poorer in the middle of the scale. The fluorescein leakage test was used in 2 laboratories only, but there was a good interlaboratory agreement on the data generated (se table 3.10) (Brantom et al., 1997).
Table 3.10
Interlaboratory reproducibility of in vitro methods with classification
models.
| The HET-CAM test | Fluorescein leakage test | |
| k * | 0.41 |
0.80 |
| Weightet k * (linear) | 0.57 |
0.88 |
| Weightet k * (quadratic) | 0.57 |
0.94 |
*: Average of kappa values obtained in the participating laboratories.
3.9 Discussion
After the COLIPA study was completed, it was concluded that none of the in vitro methods could meet both the criteria of reproducibility and relevance of the study. For this reason, none of the alternative methods were considered to be valid alternatives to the Draize test. Three of the methods used, the fluorescein leakage test, the red blood cell test and the SKIN2ZK1200 system, were evaluated to be either reproducible or relevant. Further analysis of the data obtained was recommended in order to establish new prediction models that could be tested in a future validation study (Brantom et al., 1997).
Several factors may be the basis for these conclusions. The COLIPA study was planned to be conducted with at least 3 participating laboratories per test. Several of the alternative tests were, however, only conducted in 2 laboratories. After the study was completed, the participants were informed that the reproducibility of the methods would only be evaluated, if the test had been performed in 4 laboratories. 70% of the alternative tests could not meet this demand. The results obtained concerning the relevance of the tests, e.g. their ability to predict the in vivo response, were not subject to a thorough discussion, where the testing had been completed in less than 4 laboratories. In addition, no overall comparsion of the performance of the alternative tests was carried out.
A further analysis of the results of the COLIPA study using additional data, and with more weight on the relevance of the alternative methods than the reproducibility, was the basis for a more detailed evaluation. The SKIN2 ZK1200 model was demonstrated to be very good at predicting a broad spectrum of Draize test MMAS values, and the method could also predict individual tissue reaction caused by formulations and ingredients. All the 55 could be accommodated, and formerly promising results have been obtained by test of 132 materials with a very broad spectrum of irritancy potentials. The SKIN2 ZK1200 model was also the only test in the COLIPA study that fully was able to reproduce the prediction model used. Preliminary results suggest that the SKIN2ZK1200 model may also be suited to studies of recovery from ocular irritancy. The interlaboratory reproducibility of the SKIN2 ZK1200 method was relatively good, and modest reproducibility data are to be expected using methods, where tissues are exposed directly to crude test substances compared to e.g. methods using cellular monolayers being exposed to test substances dissolved in the medium. Like other in vitro systems, the SKIN2 ZK1200 method is far more reproducible than the Draize test (see table 3.11).
Table 3.11
Historical data on the intralaboratory reproducibility of in vitro methods and
the Draize test (from Bruner et al., 1996)
| Method | Positive controls |
n | CV % |
| BCOP | acetone |
119 |
12.0 |
| Microtox | phenol |
123 |
19.4 |
| Silicone micro physiometer | SLS |
163 |
15.5 |
| Neutral red uptake | SLS |
191 |
21.7 |
| CORROSITEX | NaOH |
44 |
9.5 |
| SKIN2 ZK1200 | SLS |
44 |
26.0 |
| Draize eye irritation test (Weil & Scala, 1971) |
40-60 |
||
| SLS: Sodium lauryl sulfate. | |||
None of the other alternative methods in the COLIPA studiet were suited to predict a broad spectrum of Draize MMAS values for mixed ingredients and products. Several methods did, however, give good predictions of the in vivo response of ingredients, in particular of water soluble substances as surfactants. Both tests with chorioallantoic membranes of hens eggs had a very poor interlaboratory reproducibility. The reproducility of the other alternative tests was good. The neutral red uptake test and the red blood cell test were conducted by 4 or more laboratories, and these tests were considered to have a reasonable reproducibility (Brantom et al., 1997).
[Front page] [Contents] [Previous] [Next] [Top] |