| Front page
| | Contents | | Back | | Printing instructions
|
Entomophthorales on cereal aphids
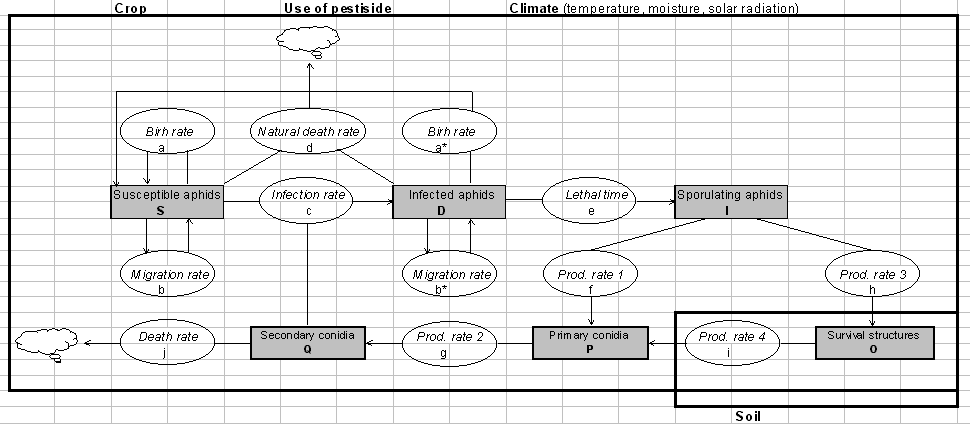
Figure 7.1
Flow diagram of an epizootiological model of the dynamics of Pandora neoaphidis
in a population of Sitobion avenae. Grey rectangles are stage variables, ovals are
developmental rates and the two large rectangles are forcing variables. |

