| Front page | | Contents | | Previous |
In Vivo Investigation of Dietary Exposure to 5 Pesticides
Appendix C:
Haematology, organ weights, macroscopic and microscopic pathology of the combined exposure study
(Study No. 02-22)
Haematology
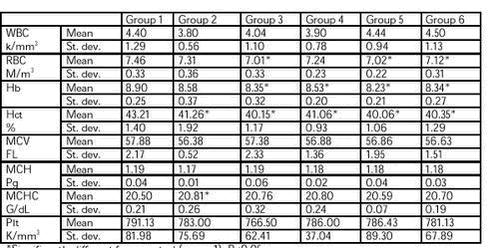
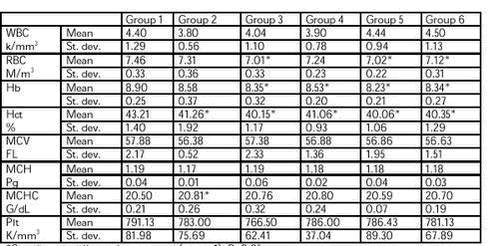
Table 1C. Group results males, mean and standard deviation (st.dev) for White blood cell count (WBC), red blood cell count (RBC), haemoglobin (hb), Haematocrit (Hct), Mean corpuscular volume (MCV), Mean corpuscular haemoglobin (MCH), mean corpuscular haemoglobin concentration (MCHC) and platelets (Plt).
Click on the table to see: ‘‘Table 1C‘‘
*Significantly different from control (group 1), P<0.05
Table 2C. Differential count of white blood cells (%), lymphocytes (L), polymorphonuclear neu-trophils (N), monocytes (M) and polymorphonuclear eosinophils (E). Group results male, mean and standard deviation (st. dev.)
Click on the table to see: ‘‘Table 2C‘‘
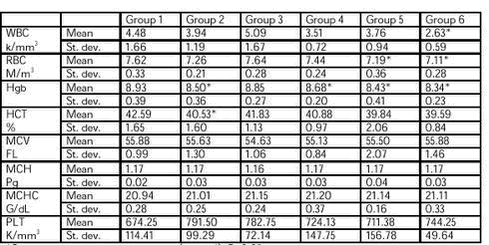
Table 3C. Group results females, mean and standard deviation (st.dev) for White blood cell count (WBC), red blood cell count (RBC), haemoglobin (hb), Haematocrit (Hct), Mean corpuscular volume (MCV), Mean corpuscular haemoglobin (MCH), mean corpuscular haemoglobin concentration (MCHC) and platelets (Plt).
Click on the table to see: ‘‘Table 3C‘‘
*Significantly different from control (group 1), P<0.05
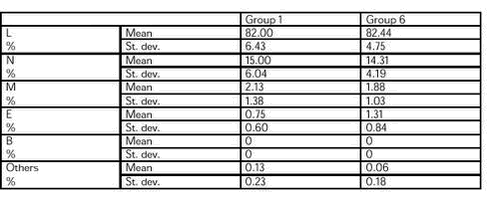
Table 4C. Differential count of white blood cells (%), lymphocytes (L), polymorphonuclear neutrophils (N), monocytes (M) and polymorphonuclear eosinophils (E). Group results females, mean and standard deviation (st. dev.)
Click on the table to see: ‘‘Table 4C‘‘
Absolute and relative organ weights
Table 5C. Absolute organ weights (g) presented as mean and standard deviation, group results males
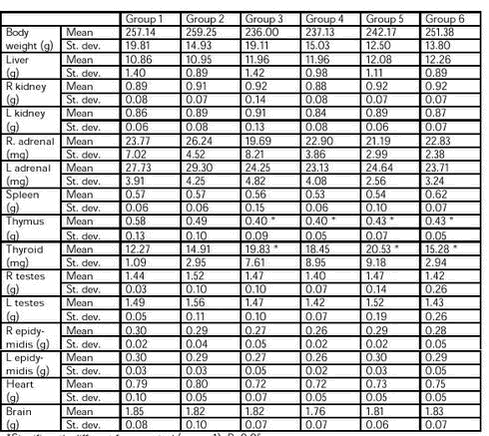
Click on the table to see: ‘‘Table 5C‘‘
*Significantly different from control (group 1), P<0.05.
Table 6C. Relative organ weights presented as (mean and standard deviation) x 100, group results males
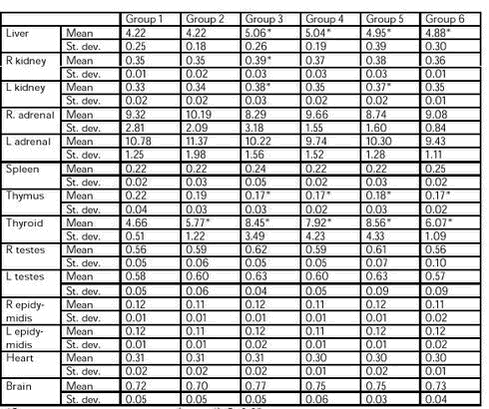
Click on the table to see: ‘‘Table 6C‘‘
*Significantly different from control (group 1), P<0.05.
Table 7C. Absolute organ weights (g) presented as mean and standard deviation, group results females
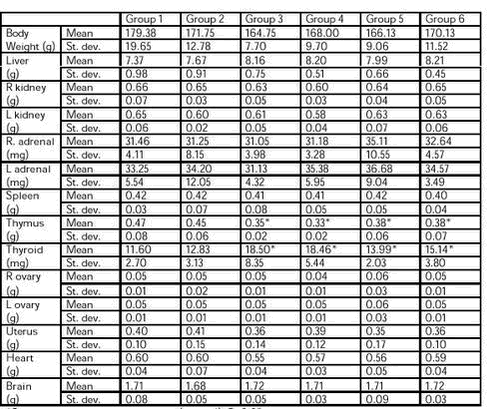
Click on the table to see: ‘‘Table 7C‘‘
*Significantly different from control (group 1), P<0.05
Table 8C. Relative organ weights presented as (mean and standard deviation) x 100, group results females
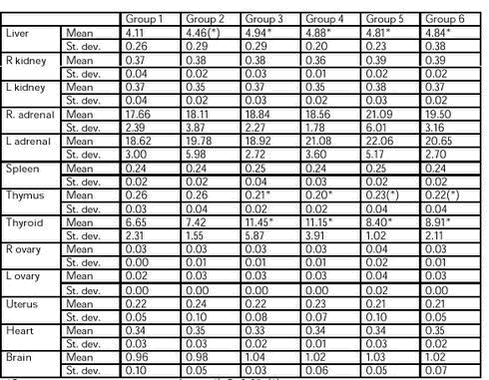
Click on the table to see: ‘‘Table 8C‘‘
*Significantly different from control (group 1), P<0.05. (*) not significant by dunnetts
Histopathology
Table 9C. Microscopic findings in control (group 1) and highest dose group (group 6). N: Normal R: remarks (see list below).
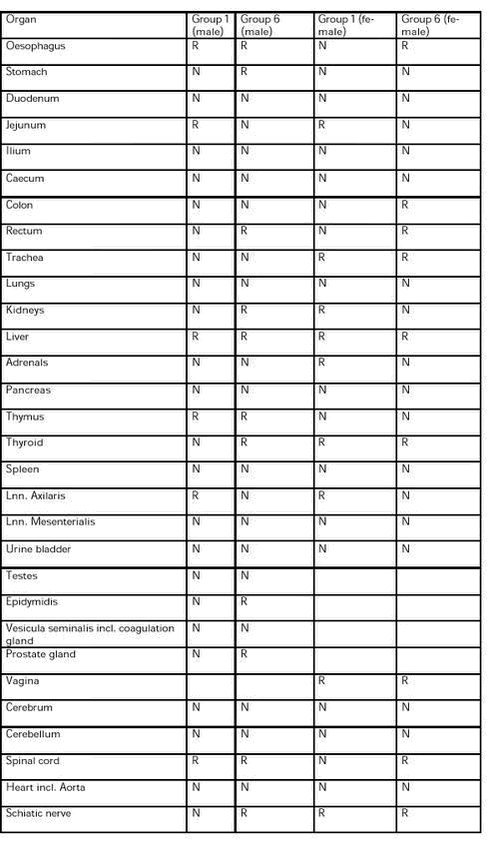
Click on the table to see: ‘‘Table 9C‘‘
N: Normal R: Remarks see below
Remarks:
Oesophagus:
Group 1, male No 6: Tissue missing
Group 6, male No 164, female No 181, 182, 183: Tissue missing
Stomach:
Group 6, male no 164: Tissue missing
Jejunum:
Group 1, male No 6, 7 and female No. 17,18: One lymphoid follicle (peyer patch) present in lamina propria.
Group 6, female No. 182: One lymphoid follicle (peyer patch) present in lamina propria.
Colon:
Group 6, female No 177: 4 lymphoid nodules in lamina propria.
Rectum:
Group 6, male No 165: Tissue missing
Group 6, female No. 183: One lymphoid follicle in tela submucosa.
Trachea:
Group 1, female No. 21: Focus of lymphocyte infiltration under the epithelium Group 6, female No. 182, 183: Tissue missing
Kidneys:
Group 1, female No 23: Pelvic inflammation grade 1 Group 6, male No165: Tubular cell regeneration
Liver:
Group 1 male No. 1, 2, 3, 5, 6, 7, 8: 1-3 foci of inflammatory cells Group 6 male 161-168: Mild degree of centrilobular cell hypertrophia Male No. 161, 162, 163, 165, 167, 168: 1-3 foci of inflammatory cells Group 1 female No. 17, 19, 20, 21: 1-2 foci of inflammatory cells Group 6 female No. 182, 183, 184: Mild degree of centrilobular cell hyper-trophia Female No. 177, 179, 181, 182, 183: 1-3 foci of inflammatory cells
Adrenal glands:
Group 1, female No. 17: Medulla missing in two sections
Thyroid gland:
Group 1, female No.24: Mild degree of follicular cell hypertrophy
Group 6, male No.161, 162, 163, 165, 166, 167, 168: Mild degree of follicular cell hypertrophy Group 6, female No. 177, 178, 179, 180, 183, 184: Mild degree of follicular cell hypertrophy
Thymus:
Group 1 male No 2: Number of macrophages in cortex increased
Group 6 male No 164, 168: Number of macrophages in cortex increased
Lnn. Axillaris:
Group 1, male No. 8, female No 23: Tissue missing
Epidymidis:
Group 6, male No. 162: Decreased amount of sperm in both caput and cauda of right epidymidis male No. 168: Vacuolarization of epithelium of Right epidymidis
Prostate gland:
Group 6, male No165: Inflammation in lateral prostate
Male No. 166: Tissue missing
Vagina:
Group 1, female No. 17, 20: Tissue missing Group 6, female No. 179: Tissue missing
Sciatic nerve:
Group 1, female No 17, 23: Tissue missing Group 6, male No. 165: Tissue missing Group 6, female No. 178: Tissue missing
Spinal cord:
Group 1, male No. 6: Tissue of cervical region missing Group 6, male No. 165: Tissue missing Group 6, female No. 181: Tissue missing No 180: Tissue of thoracal region missing No 184: Tissue of lumbar region missing
Bone marrow:
Group 6, male No. 165: Tissue missing Group 6, female No. 181: Tissue missing
| Front page | | Contents | | Previous | | Top |
|