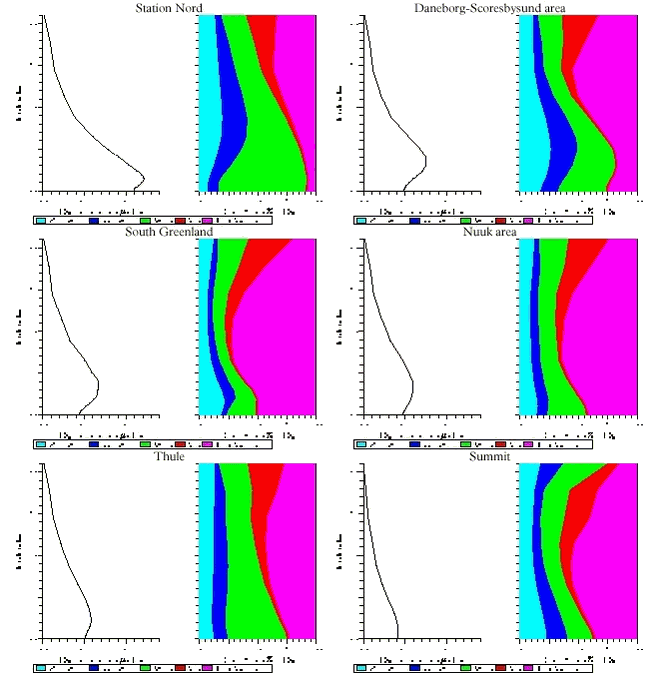
Figure 1.3.6. The vertical distribution of SOX and contributions from different sources to the vertical contributions for Station Nord (upper left), Daneborg-Scoresbysund area (upper right), South Greenland (middle left), Nuuk area (middle right), Thule (lower left) and Summit (lower right)
|