| Front page | | Contents | | Previous | | Next |
AMAP Greenland and the Faroe Islands 1997-2001
Appendix A. Cd, Hg, Se and As concentrations (mg/kg ww) in Greenland biota obtained in AMAP phase II. Mean • standard deviation.

Click on the picture to see the html-version of: ‘‘Appendix A part 1‘‘
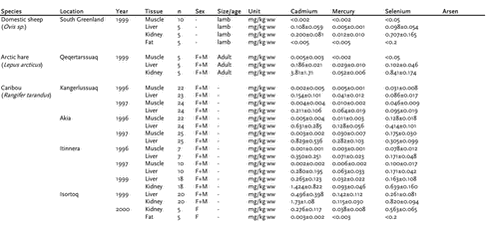
Click on the picture to see the html-version of: ‘‘Appendix A part 2‘‘
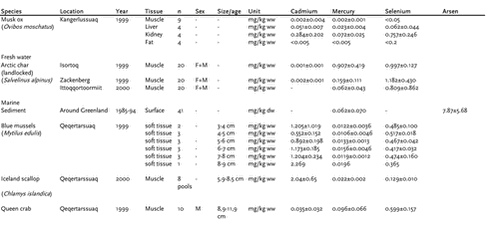
Click on the picture to see the html-version of: ‘‘Appendix A part 3‘‘
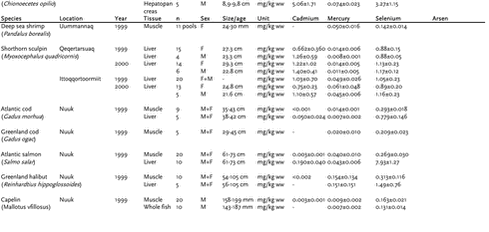
Click on the picture to see the html-version of: ‘‘Appendix A part 4‘‘
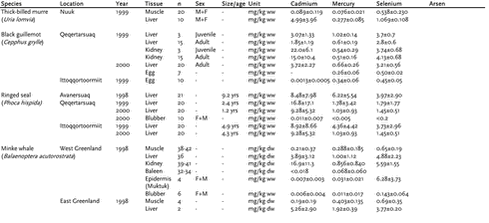
Click on the picture to see the html-version of: ‘‘Appendix A part 5‘‘
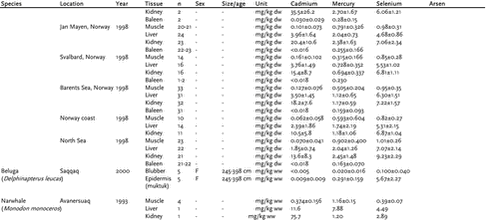
Click on the picture to see the html-version of: ‘‘Appendix A part 6‘‘
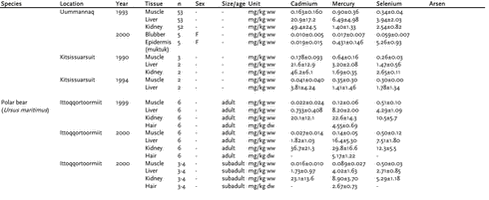
Click on the picture to see the html-version of: ‘‘Appendix A part 7‘‘
| Front page | | Contents | | Previous | | Next | | Top |
|