AMAP Greenland and the Faroe Islands 1997-20016 AMAP Faroe Islands 1999 -2001 Heavy MetalsAcknowledgementsSummary and conclusions 1 Introduction 1.1 Analytical methods 2 Myoxocephalus scorpius – Shorthorn Sculpin 2.1 Sampling 2.2 Sample treatment 2.3 Results 2.3.1 Age determination 2.3.2 Heavy metals 3 Cepphus grylle – Black Guillemot 3.1 Black Guillemot eggs 3.1.1 Collection of the samples 3.1.2 Sample treatment and analysis 3.1.3 Results 3.2 Black Guillemot liver 3.2.1 Sampling and sample treatment 3.2.2 Heavy metals 3.3 Black guillemot feathers 4 Globicephala melas – Long-finned Pilot Whale 4.1 Sample collection 4.1.1 Sampling 4.1.2 Defining groups 4.2 Heavy metal results 4.2.1 Kidney 5 Lepus timidus – Mountain Hare 5.1 Collection of samples and sample treatment 5.2 Results 6 Ovis aries – Sheep 6.1 Samples collection and pre-treatment 6.2 Heavy metal results 7 Salvelinus alpinus - Arctic char 7.1 Sampling and sample treatment 7.2 Results 7.2.1 Age determination 7.2.2 Heavy metals 8 Sediments 8.1 Marine sediments 8.1.1 Sampling and sample treatment 8.1.2 Results 8.2 Freshwater sediments 8.2.1 Sampling and sample treatment 8.2.2 Results 9 Conclusion 10 References Jóhanna Olsen Food and Environmental Agency AcknowledgementsThe project described in this report was financed by DANCEA (Danish Cooperation for Environment in the Arctic). Please note that the content of this report does not necessarily reflect the views of the Danish EPA. Responsible for the project were Jacob P. Joensen and Maria Dam. We would like to take the opportunity to thank the people who have contributed to this project by taking samples at sea, in the air, in the mountains and in the lakes, or assisted in the completion of the project in other ways: Hanus Olsen Summary and conclusionsThis report is based on results from metal analyses done as part of the Arctic monitoring and Assessment Program (AMAP) on the Faroe Islands in the period 1999-2001. Selected marine, terrestrial and freshwater species as well as sediments have been analysed. The metals which have been analaysed are: Hg, Cd and Se. The following species from the marine environment were analysed: The following species from the terrestrial and freshwater environment were analysed: In addition, marine and freshwater sediments have been analysed for Hg. The highest mercury concentrations were found in pilot whale muscle, with 3 mg/kg in a group of adult males. Next highest mercury concentrations were found in black guillemot livers, and in sculpin livers of the 2000 samples. The mercury concentrations in the three years of sculpin samples spanned a wide range from 0,1 mg/kg to almost 1,5 mg/kg varying among the age-groups but more markedly between the years. Then comes black guillemots eggs with mercury concentrations around 0,5 mg/kg, and Arctic char with a mercury level around 0,2 mg/kg. Hare livers had mercury concentrations at 0,1 mg/kg or below, while in sheep no mercury could be detected at a detection limit of 0,02 mg/kg. 1 IntroductionWhen selecting the species to be analysed, they are evaluated according to two different purposes:
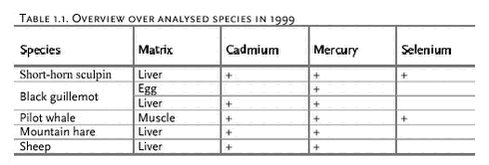
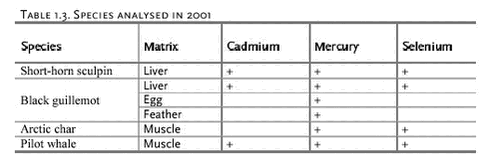
The metal analysis for AMAP phase II include mercury, cadmium and selenium, and in the tables below there is an overview over the metal analysis for 1999 2000 and 2001. Table 1.1 shows the species analysed in 1999. All the samples were collected in 1999 except for the black guillemot liver and the hare samples which were collected in 1996 and 1997 respectively. Table 1.2 shows the species analysed in 2000. All the samples were collected in 2000 exept for the mountain hare and pilot whale samples which were collected in 1999. Table 1.3 shows species analysed in 2001. The samples were collected in 2001 except for the black guillemot livers and feathers which were collected in 1995 and 1996 and the pilot whales, which were collected in 2000. As a special task in 2000 marine sediments were dated and analysed for mercury to determine the trend of mercury pollution from the past about 100 years until present. In 2001 a special task was to do the same analyses on freshwatersediments.
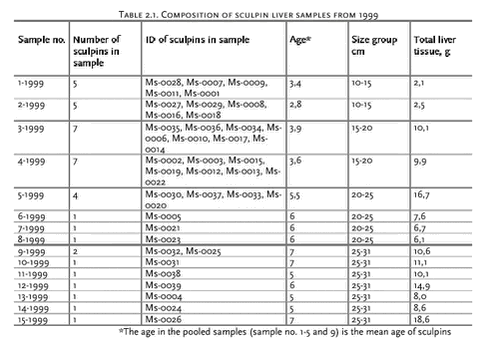
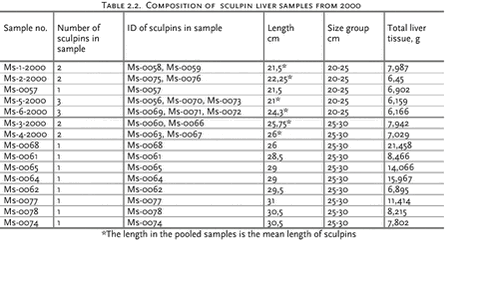
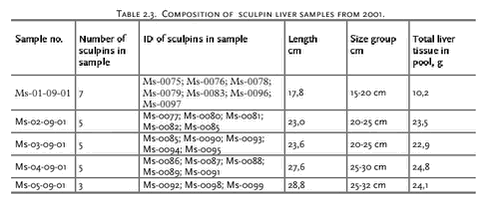
1.1 Analytical methodsFor all the species, except for the short-horn sculpins, the mercury and cadmium analysis were performed at the Food and Environmental Agency in the Faroe Islands and the selenium analysis were performed at NERI (National Environmental Research Institute, Denmark). The short-horn sculpins were analysed for mercury, cadmium and selenium at CTQ (Centre de Toxicologie du Quebec, Canada). At The Food and Environmental Agency cadmium was analysed with atom absorption spectrophotometry using either graphite (Perkin Elmer 1100B) or flame (Perkin Elmer 2380) depending on the content of the examined material. Mercury was analysed on a Perkin Elmer 2380 + MHS 10 (Mercury Hydrid System) until november 2000. Since november 2000 the mercury has been analysed with the FIMS 400 (Mercury analysis system) + amalgam system, PERKIN ELMER (AA600). The determination of the dry-weight percentage was based on the loss of mass after 10 to 20 hours at 105°C. Quality assurance: Double determinations were performed. A certified reference material and a blank sample were analysed in connection with each series. The certified reference material and the blank were destroyed in the same manner as the samples. A 4-point standard curve was always made. The laboratory participates in regular intercalibration, for example Quasimemes (quality assurance of information for marine environmental monitoring in Europe). The laboratory was accredited to the performed analyses: mercury, cadmium and dry-weight. At NERI the selenium was analysed with “Perkin Elmer FIMS” instrument coupled to the flame instrument Perkin Elmer 3030 spectrophotometer with a heated quarts tube (900°C ) mounted in the light path (see Asmund & Cleemann, 2000). At CTQ cadmium and selenium were determined by ICP-MS after sample digestion using concentrated nitric acid. Mercury was analysed on the same digest but by cold vapor atomic absorption spectrometry. 2 Myoxocephalus scorpius – Shorthorn SculpinIn AMAP the four-horn sculpin, Myoxocephalus quadricornis, is selected to be an AMAP species, because it occurs throughout the Arctic region, and because it is very stationary. However, in Iceland and the Faroe Islands Myoxocephalus quadricornis does not occur and therefore the short-horn sculpin (Myoxocephalus scorpius) is used instead. Greenland has analysed on short-horn sculpins as well. Short-horn sculpin (Myoxocephalus scorpius) is the dominant sculpin species in the Faroes, but a different species, the long-spined sculpin (Taurulus bubalis), can sometimes be mistaken with a young short-horn sculpin. In the Faroe Islands the short-horn sculpin does not reach a large size: maximum female size is 32 cm, while the male size is less. In Iceland they do become up to 40 cm (Joensen, J. S. and Vedel Tåning, Å. 1969) and in Greenland the largest reach 60 cm (Pethon, P. 1985). 2.1 SamplingIn 1999 we caught sculpins for analysis for the first time, so basically the project in 1999 must be regarded as a pilot project from the start. In 2000 there were made some changes on the sampling procedure from the experience gained in 1999. In 1999 an area from Tórshavn to Kaldbaksbotn and to Kaldbak was decided to represent one station with a number of exactly marked substations. Due to local pollution, this area is not ideal when the long-range transport of environmental pollutants is estimated. The area of fishing was very practical, mainly due to the close proximity from Tórshavn which made several field visits possible during the collection period. In 2000 the sampling area was restricted only to include the substations Kaldbak and Sund. In 2001 the samples were collected in Kaldbak, Sund and Tangafjørður Sculpins were collected with a fishing rod from land and from boat in 1999. Fish trap and hand collecting by scuba diving were used as alternative methods. In 2000 all the sculpins were collected with fishing rod, and in 2001 almost all were collected with fisk trap. The few which were not, were collected with fishing rod. The sampling periode was during July and August in 1999 and a total number of 55 sculpins were collected, of which 39 were analysed. The remaining 16 (collected in Kaldbaksbotn), which had been kept in a fibre glass tub for several weeks, were not suitable for analysis. However, these sculpins were examined for age, and the length and weight were also measured. In 2000 the sampling periode was changed to be from April to June and a total number of 23 sculpins were collected and analysed. Due to the liver size, mainly larger sculpins were collected in 2000 by which large pooled samples were avoided. In 1999 the sculpins were heavily infected with nematodes (sandmaðkur). The nematodes were found in the muscles, abdominal cavity and sometimes in the liver. This was thougth to be due to the period chosen for sampling, and this was the reason for moving the catching period to be conducted earlier in the year in 2000. However, in 2000 the sculpins were also heavily infected with nematodes. 2.2 Sample treatmentAll the sculpins were rinsed in milli-Q water and stored in PE plastic bags (Minigripâ) in a freezer (-20°C) until further preparation. When the sample preparation took place, we tried to be very careful not to handle the samples too much. We used talcum-free gloves and all the instruments, e.g. scalpel, scissors and tweezers, were thoroughly rinsed with milli-Q water. All organs (liver, muscles, gonads) were stored in heat treated glass (400°C for at least four hours) with similarly heat treated aluminium foil between glass and lid and finally stored individually in the freezer (-20°C) until shipment to CTQ1 for analysis. The samples were transported in polycarbonate boxes to the laboratory, and all the further handling of the samples (homogenization etc.) were conducted by the laboratory in Canada. At CTQ, the liver was analysed for the metals: mercury, cadmium and selenium. In addition the samples from 1999 were analysed for dry matter content. The other samples (muscles, gonads and stomachs with contents) are stored in the Faroese Environmental Specimen Bank. Because of deficient liver tissue samples some individual analysis and some pooled sample analysis have been made. The gender was registered for each individual, but because of the small size of the gonads, it was very difficult to determine the sex, so the sculpins sex shall be taken with reservation. For age determination, otoliths were extracted from all the sculpins, except for sculpin number Ms-0002, but only the otoliths from 1999 were analysed at the Faroese Fisheries Laboratory. The sample compositions are shown below in Table 2.1, Table 2.2. and Table 2.3. The composition of the samples was based on the length of the sculpins, and therefore sub-stations were not considered in this context. As mentioned before, the similarity between the short-horn sculpin (Myoxocephalus scorpius) and the long-spined sculpin (Taurulus bubalis) is great, and unfortunately in 1999 there appear to be two individuals of the long-spined sculpin in the pool presumed to be all short-horn sculpin. These two have ID numbers Ms-0008 and Ms-0028. This mix up was discovered when the otoliths were studied. The two misplaced individuals belong to the pooled samples number 1-1999 and 2-1999.
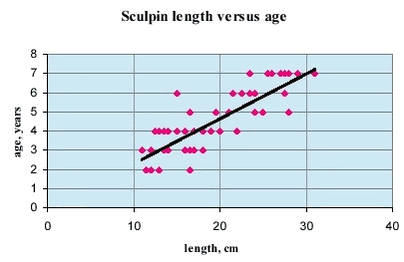
2.3 Results2.3.1 Age determinationThe age of the sculpins collected in 1999 was determined at the Faroese Fisheries Laboratory and in the figure below age is depicted against length, showing the correlation between length and age. The age ranges between two and seven years.
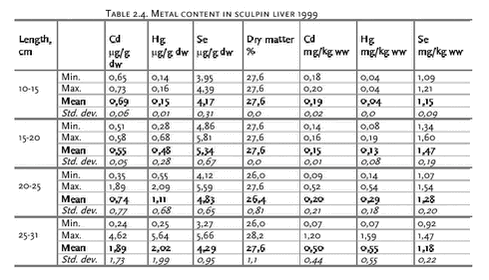
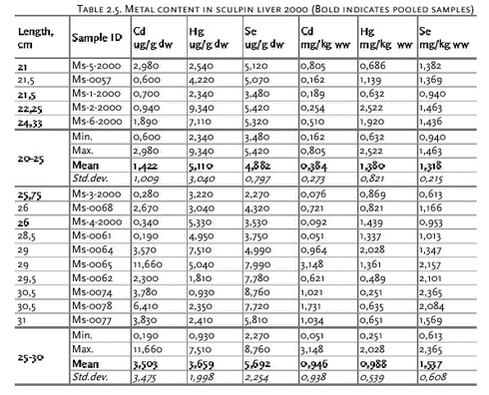
The length of the sculpins collected in 2000 ranged from 19,5 - 30,5 cm and according to Figure 2.1 the age of the sculpins is somewhere between 4-7 years. The mean length was 25,3 cm which corresponds to an age of 6 years. 2.3.2 Heavy metalsThe liver was analysed for some heavy metals and the results of the analysis is listed below in Table 2.4, Table 2.5 and Table 2.6. The metal results were presented in dry weight from the laboratory and in the tables the results have been converted into wet weight because of comparison of our results with other results, which are presented in wet weight.
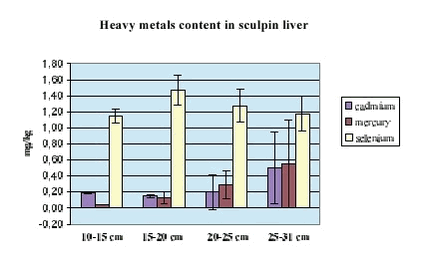
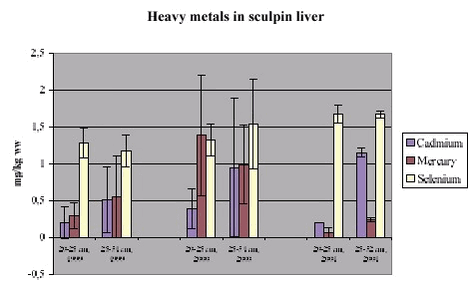
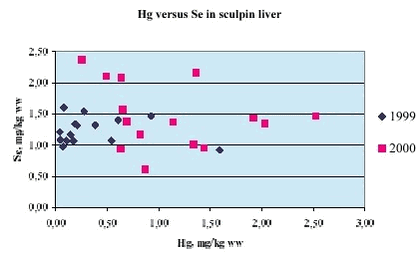
In the figure and table above the results of the heavy metal analysis in 1999 are shown, as the mean concentration of the four different size groups. There are substantial individual variations between the results leading to large standard deviations. The mean concentration of mercury and cadmium appears to be increasing with the length of the sculpins (Figure 2.2.). It is stressed that there are both individual and pooled samples in this study. In 2000 only sculpins from the two largest size groups were analysed and the heavy metal results are shown in Table 2.5. The water content was not analysed at the laboratory; instead we used the dry matter content from the 1999 samples to convert the results in to wet weight. For all the samples we used a dry matter content of 27,0 %. Figure 2.3 shows the mean concentrations of metals for the two large size groups in 1999, 2000 and 2001. It appears to be some difference between the the results from 1999 and 2000 where the content of especially cadmium and mercury seems to be higher in 2000 than in 1999. In 2001 the mercury results are much lower than in both 1999 and 2000, whereas cadmium remains high in the larger size group. It has been found that selenium may interact with mercury and other metals, and in the figure below mercury is depicted against selenium. The concentration of selenium appears to be high and quite stable in all the size groups all three years.
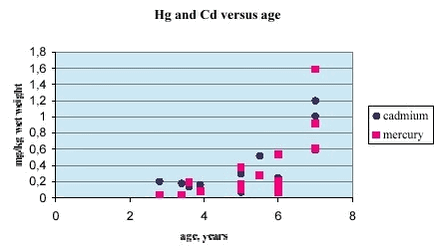
Figure 2.4 In Figure 2.5 the concentration of mercury and cadmium is depicted against the age of the sculpins from 1999.
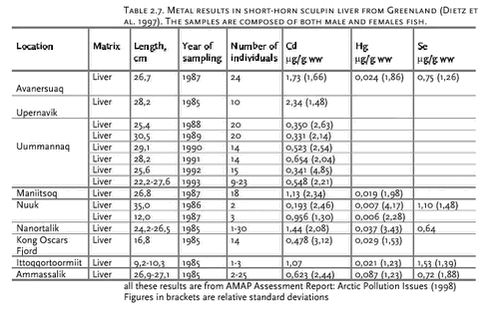
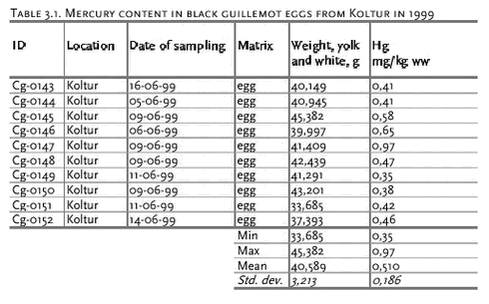
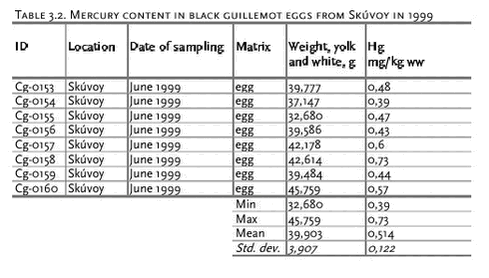
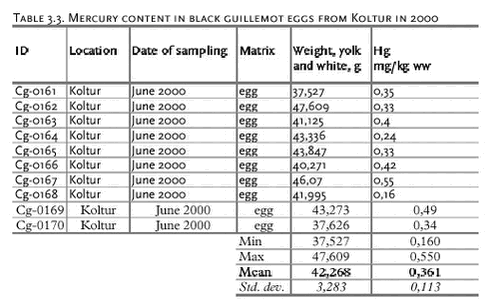
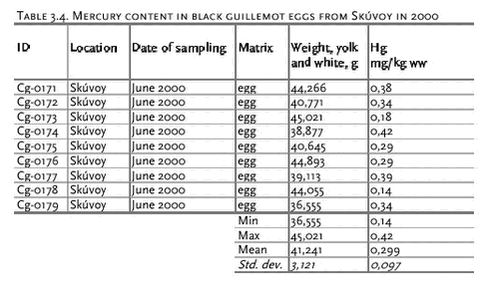
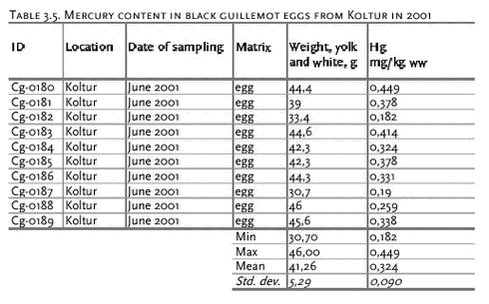
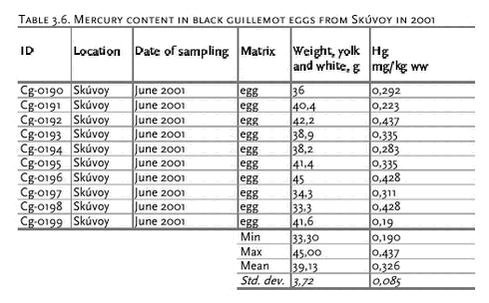
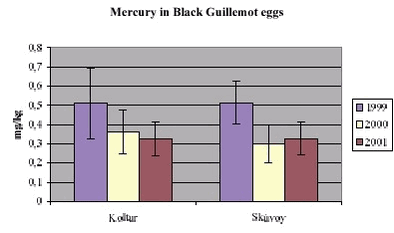
In Table 2.7 similar results from Greenland are listed for comparison to the Faroese results. It appears to be overall higher mercury concentration in the the Faroese sculpins. Part of the explanation may be that the choice of location was not optimal for avoiding local pollution. However, there are also a wide range of concentrations found in the samples from Greenland, as indicated by the magnitude of the standard deviations. 3 Cepphus grylle – Black GuillemotIn the Faroe Islands the black guillemot have been a protected species for many years. The population is estimated to 3500 breading pairs (Bloch et al.,1996). The black guillemot in the Faroe Islands belongs to subspecies Cepphus grylle faroensis. In Iceland, the subspecies is Cepphus grylle islandicus and in Norway and Britain it is Cepphus grylle atlantis. The Icelandic and the Faroese birds are known to be smaller than the others. There are also other differences between the subspecies (Sørensen, S. and Bloch, D. 1990). The black guillemot lives in the coastal zone and gets food from the sea. The local diet consists of a mixture of crustacean, gastropods and pisces with great seasonal variation (Dam, M. 1998). The egg-laying period is around the 10th of June. The black guillemot normally lay two eggs in the nest, which is found along the rocky coastline, well hidden between the stones. Most of the time the bird stays in the Faroe Islands, although there is some speculation that some of the birds migrate in the winter period (Sørensen, S. and Bloch, D. 1990 and Ryggi, M. 1951). 3.1 Black Guillemot eggs3.1.1 Collection of the samplesThe eggs were taken by local people from two different locations – Koltur and Skúvoy in 1999 2000 and 2001. Only one egg was taken from each nest and stored in a refrigerator until further treatment. The eggs were taken over a wide period of time, which indicates that the egg-laying period is wide. Because the black guillemot has been protected for a long time, no previous pattern for egg collection was known. Consequently, numerous attempts were made to locate the nests and to follow the birds’ egg-laying behaviour. 3.1.2 Sample treatment and analysisThe eggs were carefully rinsed in milli-Q water before breaking the eggshell. A hole (1-1½ cm) was made on the top of the egg and the content was carefully poured into glasses. The yolk and white were mixed with a fork (also washed in mill-Q water). In some of the eggs, the embryo were beginning to grow. The contents were stored in heat treated glass (400°C for at least four hours) and stored in a freezer (-20°C) prior to analysis. The eggs were analysed for mercury at the Food and Environmental Agency in Faroe Islands. 3.1.3 ResultsThe eggs were taken from two different locations three following years and the mercury results are listed below in separate tables. As the tables and Figure 3.1 show there is very little difference in mercury concentration between the locations each year, but there is a difference between the years. The mercury content was significantly higher in 1999 than in 2000 in both Koltur (P=0,04) and Skúvoy (P=0,001) while there was no significant change from 2000 to 2001.
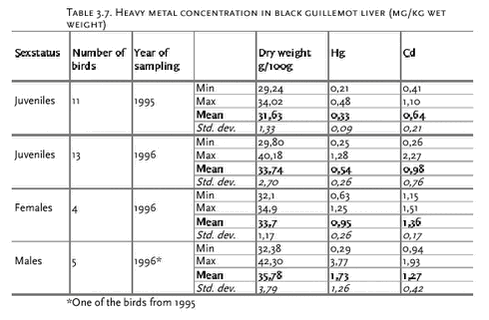
3.2 Black Guillemot liver3.2.1 Sampling and sample treatmentThe liver samples are taken from birds shot in 1995 and 1996 at Sveipur and Hestoy. The birds were shot with 3,70 mm and 4,70 mm 32g loaded Winchester steel-hail, and the livers were stored in PE plastic bags (Minigrip©) in a freezer. All the biological data on the birds are taken from the Faroese Environmental Specimen Bank. For further details see the study of Dam, M. 19982. 3.2.2 Heavy metalsIn the table below the results of the heavy metal analyses are listed. The sexual status was recorded and the birds were separated into juvenile and adult, male and female. Furthermore, the age was assessed from the Bursus fabriosus and the birds’ age was assigned to be for the males either juveniles (2K = younger than or equal to two calendar years), or adults (3K+ = older than three calendar years), and the females were regarded as juveniles when the oviduct appeared slim and rather straight (Dam, M. 1998).
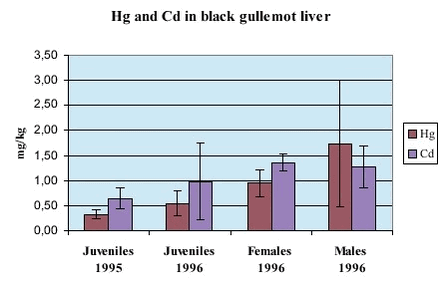
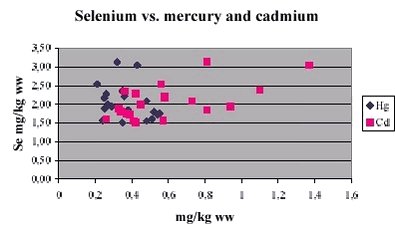
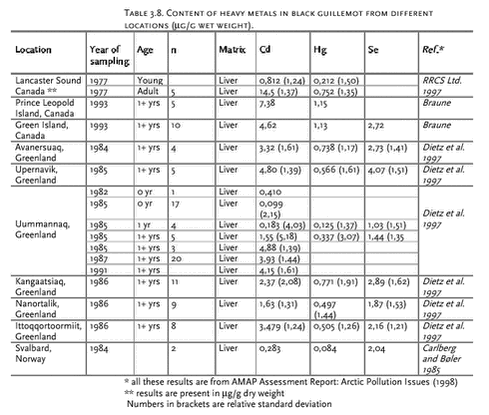
The results for mercury and cadmium are shown in Figure 3.3 and Table 3.7. The Faroese black guillemot appear to have higher levels of mercury and cadmium than those from other locations (Table 3.8). However, as the age is an important parameter especially for the mercury body burden, it is necessary to consider that the age-groups must be similar for comparisions to be valid. In 2001 the livers were analysed for selenium and Figure 3.4 shows the concentration of selenium versus the concentration of mercury and cadmium.
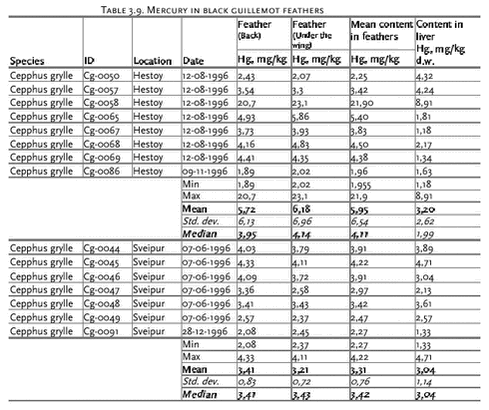
3.3 Black guillemot feathersFrom 15 of the black guillemots from 1996 feathers were also taken and analysed for mercury at the Food and Environmental Agency in the Faroe Islands. From each bird, one sample was taken from the back between the wings and one from under the wing. The feathers were stored in PE plastic bags (Minigripâ) until analyses. The results are shown below.
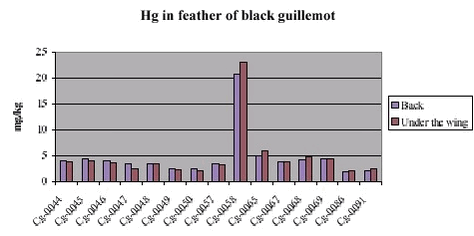
The purpose of analysing mercury in, feathers both from the back and from under the wing of the same individuals (Figure 3.5) was to see, if th ere is a difference in the content depending on were the feathers were taken. Testing showed, that there is no significant difference between the median contents in the feathers from the two places on the bird (T=61, P>0,05, Wilcoxon’s test for matched pairs).
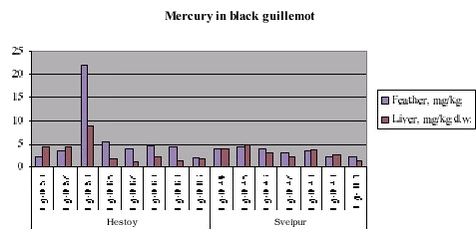
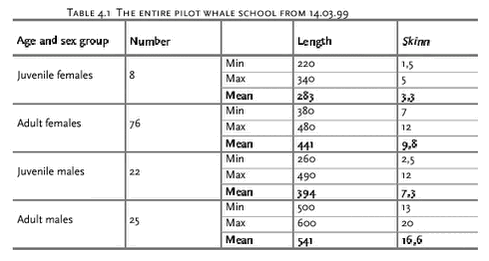
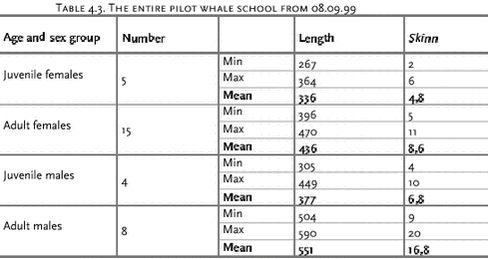
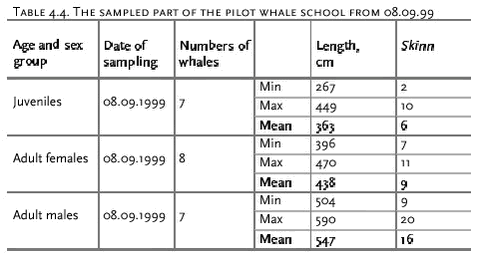
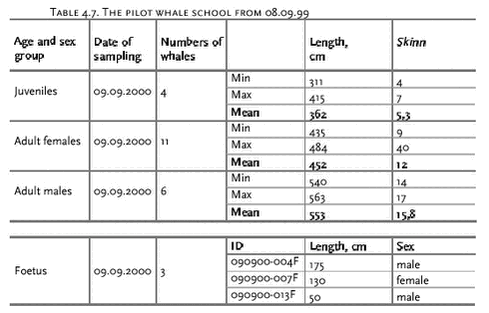
Table 3.9 and Figure 3.6 show, that the concentration of mercury in black guillemot feathers from Sveipur and Hestoy is between app. 2 and 5 mg/kg with only a few exeptions. One of the exeptions is Cg-0058, which has a concentration over 20 mg/kg. This influences the mean mercury concentration of black guillemots from Hestoy, which is 5,95 while the mean mercury concentration of black guillemots from Sveipur is 3,31 mg/kg. The mean concentration from Hestoy is 3,68 mg/kg, when excluding the outlier Cg-0058. When comparing the result of mercury in liver with the mean results in feathers from the same individual, the picture is different for Hestoy and Sveipur. In Sveipur the results from the two tissues are quite comparable, while the results from Hestoy show higher Hg concentration in feather than in liver (Figure 3.6). Another parameter, which differs between the two groups is the time when they have been shot. Almost all the birds from Sveipur were shot in June, while almost all the birds from Hestoy were shot in August. The diet of the black guillemot varies during the year by consisting mostly of fish during early summer (Apr.- Aug.) and mostly of crustaceans and molluscs during the winther (Nov-Dec.) (Dam, 1998). The content of fish in the diet has been found to be highest in April and declining during the summer. 4 Globicephala melas – Long-finned Pilot WhaleThe reason for analysing the long-finned pilot whale in AMAP context is that pilot whales are part of the traditional Faroese diet – both the blubber and meat is consumed. The pilot whale is a toothed whale and feeds on squid (Todarodes sagittatus and Gonatus sp.) and fish, usually greater silver smelt and blue whiting (Bloch, D. and Fuglø, E. 1999). 4.1 Sample collectionPilot whale samples are collected in connection with hunting, and the sampling takes place after the killing but before the meat distribution. At this time the whales are opened and the intestines pulled out. The entire operation (from the killing to the meat distribution) is well organised. Before we collect our samples the whales are measured (length and the whale size in skinn3) and the sex is determined. The number written in the whales head is used as our sample mark; then we are able to obtain all the other information (size and gender) from The Museum of Natural History at a later stage. 4.1.1 SamplingThe samples are from four different whale schools from 1999 and 2000 and the results are treated separately. The samples from 1999 were collected on the 14th of March 1999 in Tórshavn and the 8th of September 1999 in Vestmanna. The samples from 2000 were collected on the 31th of August 2000 in Hvannasund and on the 9 th of september 2000 in Tórshavn. One piece of muscle and one piece of blubber were taken at the sides of the abdominal cuts. From the school from 09.09.00 one piece of kidney was taken as well. The samples were stored in PE bags (Minigrip©). The sample were stored in a freezer (-20°C). The muscle samples were analysed for Hg, Cd and Se, except for the school from 31.08.00 which only was analysed for Hg and Se. The kidney samples were analysed for Cd. The samples from 31.08.00 were analysed as pooled samples. Three pools were made: Females, males and juveniles. 4.1.2 Defining groupsAccording to Desportes, G. et al. (1993) early sexually mature male whales are 494 cm long, which corresponds to an age of approximately 14 years, but generally whales become sexually mature when they reach the age of 17 years. According to Martin A.R. and Rothery P. (1993) the female whales are sexually mature when they are 375 cm long, corresponding to an age of approximately 8 years. The pilot whales were divided into the following four groups according to sex and body length: Juvenile females: All females < 375 cm The pilot whale school from 14.03.99 consisted of 131 whales and the sex and age distribution were as follows: In the table below some biological parameters are given for the whales, from which samples where taken. The juvenile whales (12 males and 2 females) were combined in one group for chemical analyses. Table 4.2. The sampled part of the pilot whale school from 14.03.99 186 The whale school from 08.09.99 consisted of 34 whales and the size distribution was as follows: Samples were taken from 22 individuals (Table 4.4). The juvenile group consisted of four females and three males.
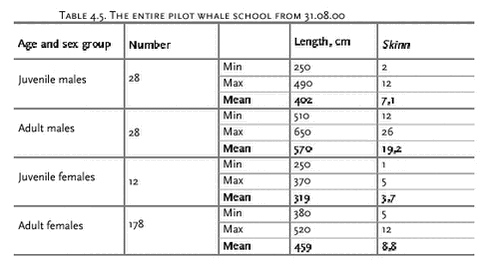
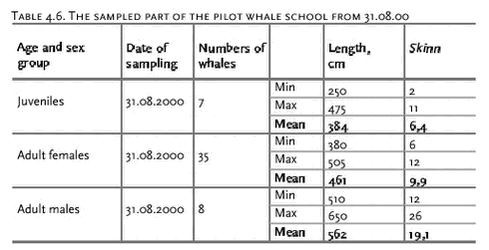
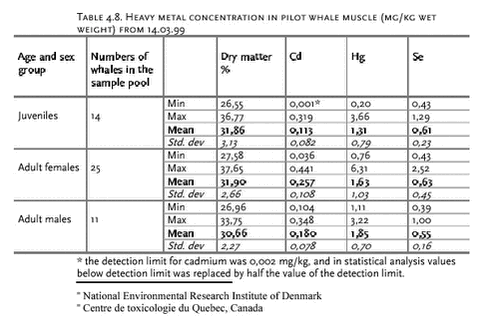
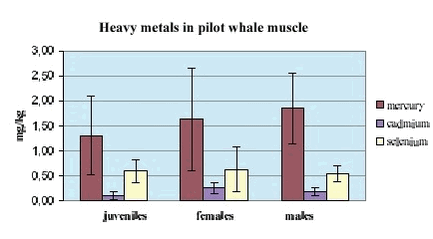
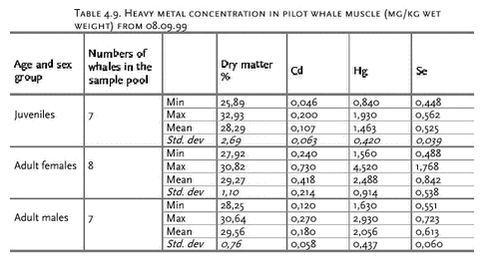
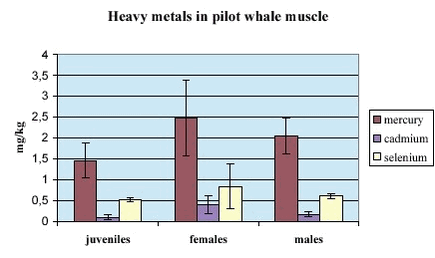
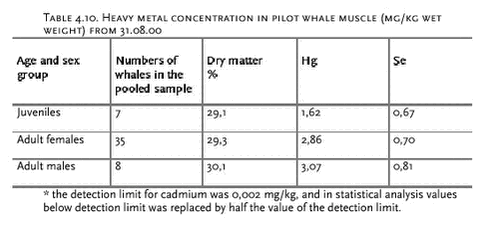
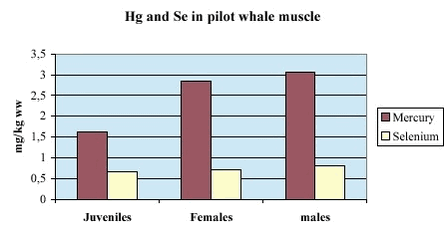
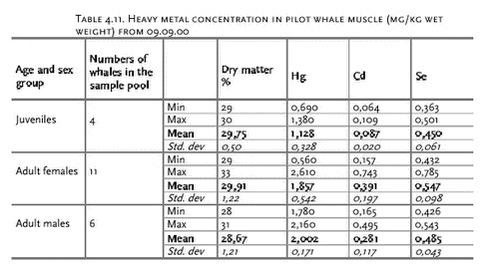
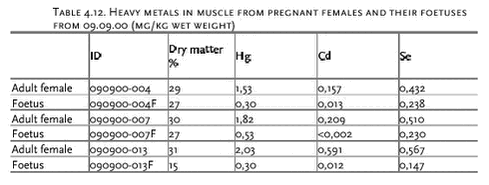
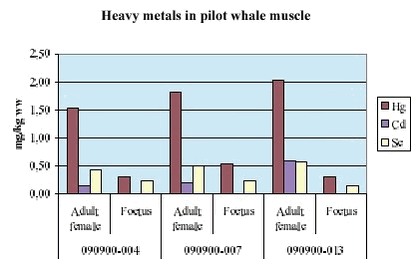
The pilot whale school from 31.08.00 consisted of 246 whales and the sex and age distribution were as follows: In the table below some biological parameters are given for the whales, from which samples where taken. The juvenile whales (6 males and 1 female) were combined in one group for chemical analyses. The whale school from 09.09.00 consisted of 21 whales of which 3 were pregnant and samples were taken of all the whales and the foetuses as well. The juvenile group consisted of two females and two males. The size distribution was as follows: According to Martin & Rothery (1993) the mean length of a new born pilot whale calf is 177 cm and the weight is 74 kg, but foetuses with a length between 163 cm and 191 cm were found. 4.2 Heavy metal resultsMercury and cadmium in muscle were analysed at the Food and Environmental Agency in the Faroe Islands while the selenium analysis were made at NERI4 , Department of Arctic Environment for the samples from 1999 and at CTQ5 for the samples from 2000. The results are shown below as mean concentrations.
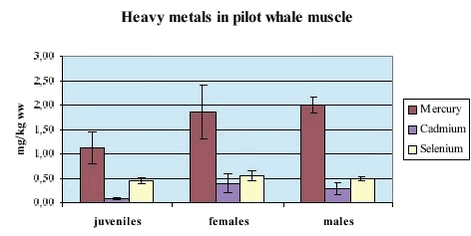
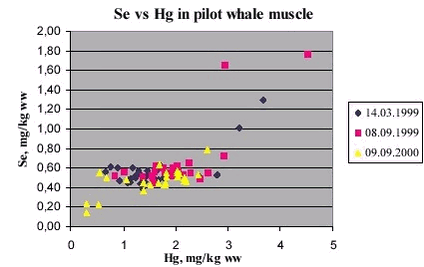
The figures and tables above show the mean concentrations of Hg, Cd and Se in muscle for the four whale schools. When comparing the results for the two different whale schools the pattern is quite similar. For the mercury results, the content is highest for the males and lowest for the juveniles exept for the school from 08.09.99 where the mercury content is highest for adult females. The cadmium content is highest for the adult females for all whale schools. In Figure 4.6 the Se content is depicted against Hg. It appears that the Se concentrations are quite stable when the Hg concentration is lower than approximately 3 mg/kg, but when it exceeds that limit the Se concentration seems to be increasing with increasing Hg concentration. The three individuals with the lowest selenium content (<0,3 mg/kg ww) from 09.09.00 are the three foetuses analysed.
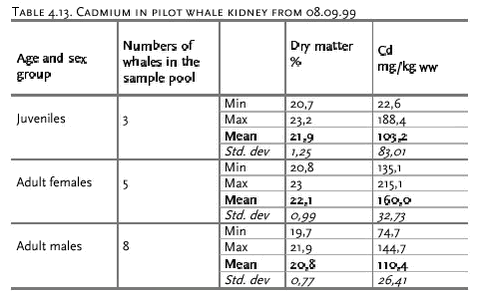
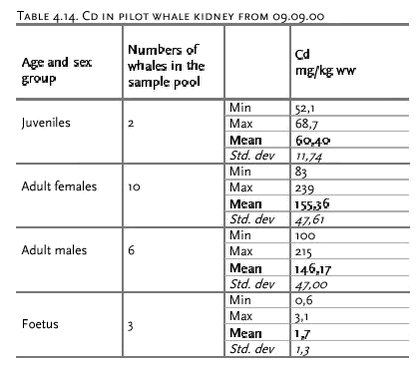
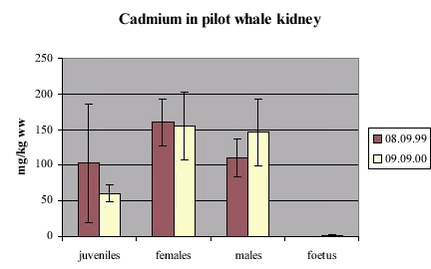
4.2.1 KidneyKidney samples were taken from the school from 08.09.99 and the school from 09.09.00 and analysed for cadmium at the Food and Environmental Agency in the Faroe Islands. The results are shown below.
Of the samples from 09.09.00 only one kidney sample (090900-001) was analysed for dry matter content and the result was 23,9 g/100g.
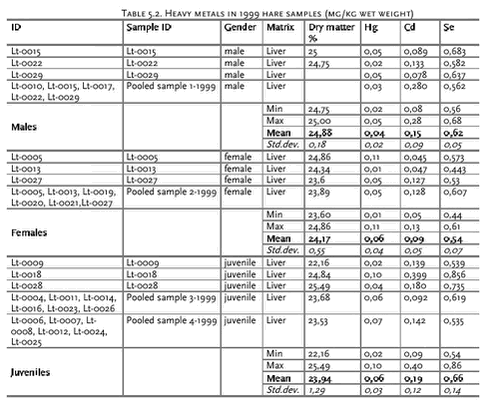
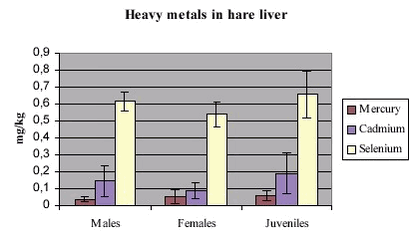
During the years 1986-87 samples of 93 individuals of pilot whales belonging to three schools were analysed for cadmium.The average concentration in these three schools were 86, 93 and 55 mg Cd /kg kidney (where n= 43, 23 and 31 respectively) (Caurant et al., 1994), with three pregnant females having concentrations as high as 500 -960 mg/kg (Caurant and Amiard-Triquet, 1995). Such high individual levels where not found when kidney were analysed in samples from one pilot whale school in 1999 (n= 16, maximum Cd conc. 215 mg/kg) and one in 2000 (n= 21, maximum Cd conc. 240 mg/kg), Tables 4.13 and 4.14. However, the overall average cadmium concentrations in these schools where high, 125 mg/kg and 122 mg/kg respectively, also compared to earlier results like in 1978 where the average of Cd in pilot whales were 73 mg/kg (n =10) and 6 mg/kg (n=6) (Juelshamn et al., 1987) and the earlier mentioned results from 1986/87. In order to establish whether the results in 1999 and 2000 are reflecting an increased overall cadmium concentation in the pilot whales, an assessment must be done based on the relative amount of young individuals in the the 1986-87 samples compared to the 1999/2000 samples, as it is well known that young individuals tend to have lower cadmium concentrations in the kidneys (Caurant et al., 1994). Such analysis however, will demand tracing the data of the individual pilot whales analysed in the 1986-87 study. 5 Lepus timidus – Mountain HareThe wild living terrestrial mammals on the Faroe Islands are mice, rats and hare. These species have been brought to the islands with humans. The hare was imported to the Faroes in 1855 from Norway and has been here since. The hare diet consists for of e.g. grass, herbs and horsetail (Bloch, D. and Fuglø, E. 1999) In the Faroe Islands the hunting season for hares starts on 2nd of November and ends on 31st of December. The hares used in this project were shot in 1997 and 1999. The hares from 1997 were hunted north of Vestmanna in an area called Heimi í Haga, in a subarea called Postulakirkja. In this area the reference station Norðuri á Fossum6 is situated. In 1999 the hares were hunted at three different locations: Heimi í Haga in Vestmanna, Heimihagi in Norðadalur and in Signabø hagi. 5.1 Collection of samples and sample treatmentIn November 1997 the hares were shot with 3,70 mm and 4,70 mm 32g loaded Winchester steel-hail but in 1999 other types of hail were used. The tissue samples were stored in heat treated glass jars (400°C for at least four hours) with similarly heat treated aluminium foil between jar and lid and stored at -20°C until shipment to the laboratory. The samples 1997 were analysed for mercury and cadmium at the Food and Environmental Agency in the Faroe Islands and in addition the samples from 1999 were analysed for selenium at NERI, Department of Arctic Environment. 5.2 ResultsOnly three hares were shot in 1997 and the analyses were made on individual basis. Results of mercury and cadmium analyses on liver tissues are shown in Table 5.1. In 1999 analyses were made on both individuals and on pooled samples and they were analysed for mercury, cadmium and selenium. The results are shown in Table 5.2.
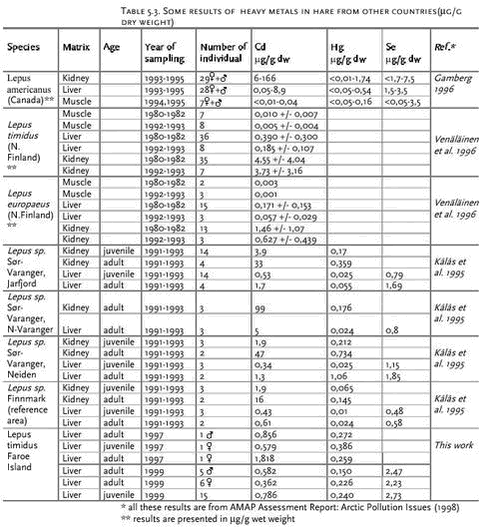
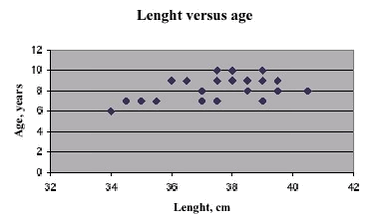
When comparing the heavy metal results from 1997 and 1999 the levels seem quite similar. The results from 1997 are within the range of the levels from 1999 except from the mercury content of the adult male and the cadmium content of the adult female. These levels are higher than the maximum levels in 1999, however, as seen from the Table 5.3 there may be quite wide range in the concentration of these metals. The relatively high levels of heavy metals in the Faroese juveniles were not expected and do not follow the normal pattern of increasing bodyburden with age as is normally seen especially for mercury. However, given the limitied sample size this could be a result of the already mentioned large individual variations. In Table 5.3 concentrations of mercury, cadmium and selenium in various hare samples from other countries are given along with the results of the present study in comparable units. 6 Ovis aries – SheepSheep and lamb form a considerable part of the traditional Faroese diet. Almost everything on the sheep is consumed e.g. meat and entrails. There are approximately 70,000 sheep on the 18 Faroese islands. The sheep pasture in outlying fields, and it is quite common that they have no contact with developed areas before they are slaughtered. Sometimes at the end of the winter they are given imported fodder for a couple of months until there is enough grass for them to feed on. The sheep which were analysed in this context, had been grazing north of Vestmanna in an area called Heimi í Haga and in this area the reference station Norðuri á Fossum7 is situated. 6.1 Samples collection and pre-treatmentIn connection with slaughtering of sheep in October 1999, arrangements were made with farmers to take the samples and they were given instructions on the procedure. The samples consisted of approximately 50 g liver from the lowest part of the liver lobe and were put individually in PE (Minigripâ) bags and then frozen. Samples were taken from 17 juvenile females and six adult female sheep. Liver from sheep and lambs were analysed for mercury and cadmium as pooled samples at the Food and Environmental Agency in the Faroe Islands. There were made one sample for the lambs and one for the sheep. The pooled samples consisted of equal amounts of liver tissue from each individual, one comprising all the juveniles and one the adult females. 6.2 Heavy metal resultsIn the table below the results from the heavy metal analyses are shown. As expected the content of heavy metals are low, for mercury the concentrations were below the detection limit. The concentrations of cadmium were, as expected, higher in the adult females than in the juveniles. In our first AMAP study from 1997 (Larsen, R.B. and Dam, M. 1997), sheep and lamb were analysed for mercury and cadmium, and these results are comparable to the results presented here. In 1997 mercury was not detectable in any of the analysed samples and the mean level for cadmium was 0,17 mg/kg wet weight in adult females and 0,05 mg/kg wet weight in juvenile females. 7 Salvelinus alpinus - Arctic charIn the Faroe Islands Arctic char were originally found only in lake Leynavatn (Gydemo, 1983). In 1956 Arctic char from Leynavatn were released in the reservoir Frammi á Vatni and later in 1961 also in the dammed lake Á Mýrunum. Later the Arctic char have spread from these places to the lower reservoirs, Lomundaroyri and Heygardalsvatn. These reservoirs are situated above Vestmanna (Reinert, 1998). The Arctic char in this study are from the dammed lake Á Mýrunum. Arctic char can be either anadromous or stationary. Anadromuous means that they live in the ocean except when they are young and that they only return to fresh water to spawn. Arctic char from Á Mýrunum have no access to the sea, hence they are necessarily stationary. Since 1992 the dammed lake Á Mýrunum has been preserved for fishing because of outbreak of the disease furunculosis in the lower reservoir Heygardalsvatn, and special permission must be achieved before fishing in the lake. 7.1 Sampling and sample treatmentPermission for fishing in the lake Á Mýrunum was granted by the Chief Veterinary Officer and the Arctic char was caught by angling by men from the angling association “Føroya Sílaveiðufelag” on 28th of June in 2000 and 27th of June and 5th of July in 2001. The fish were wrapped individually in plastic bags and kept in a cool-box until further treatment. In 2001 the fish were frozen before further treatment. Before and after fishing the fishing tackle was disinfected, in 2000 with the commercial disinfectant Actomar and in 2001 with VirkonS. In 2000 a total of 35 Artic char were caught, of which 25 were analysed. In 2001 40 Arctic char were caught and analysed. The char was examined for sympthoms of a selection of fish diseases but no signs of diseases or ectoparasites were found. In 2000 individual samples of muscle were taken from the right fillet and stored in polycarbonate boxes in the freezer (-20°C) until chemical analysis. The muscle samples were analysed for mercury at the Food and Environmental Agency in the Faroe Islands, and for selenium and dry matter content at NERI8, Department of Arctic Environment. Otoliths were extracted from all the individuals from 2000, except for one (Bl-01), for age determination and analysed by Jørgen Andersen, formerly employed at NERI, Department of Arctic Environment. In 2001 the Arctic char were analysed as pooled samples. Each pool consisted of equal amount of right fillet muscle from 8 individuals. The division of the fish into pools was made according to size. The samples were stored in heat treated glass jars (400°C for at least four hours) with similarly heat treated aluminium foil between jar and lid, and analysed for mercury, selenium and dry matter content at CTQ in Canada. 7.2 Results7.2.1 Age determinationThe age was determined for the Arctic char from 2000. The age ranged between six and ten years with a mean age of approximately 8 years. The figure below shows the correlation between lenght and age.
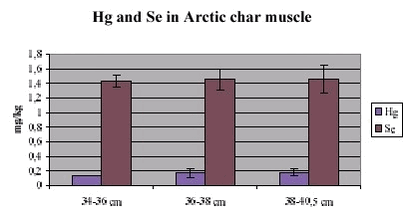
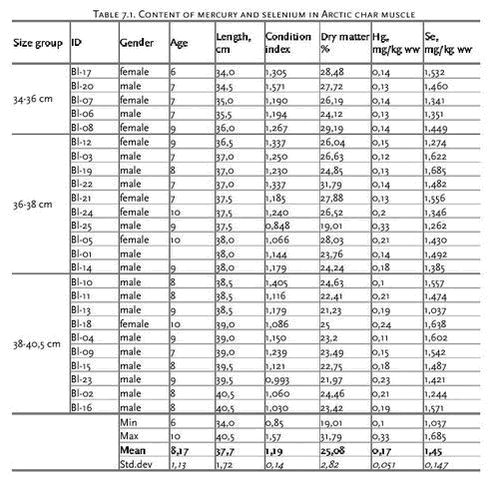
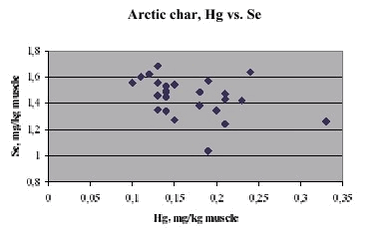
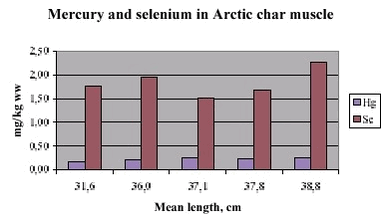
In 2001 the length ranged between 28 cm and 40 cm with a mean length of 36,2 cm. 7.2.2 Heavy metalsThe results of the heavy metal analyses from 2000 are shown in Table 7.1, and the mean Hg and Se values for the three size groups are shown in Figure 7.2. The molar ratio for Hg/Se for the largest size group is 0,0009/0,0184 mmol/kg. Figure 7.3 shows the correlation between mercury and selenium.
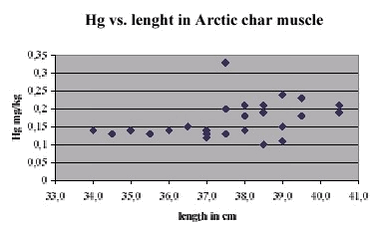
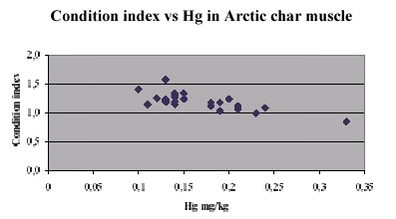
Figure 7.4 and Figure 7.5 show the concentration of mercury versus length and condition index respectively. Mercury content was not significantly correlated to length (5 % level of significance), but significantly correlated to condition index with P(2 tail)=0,00001.
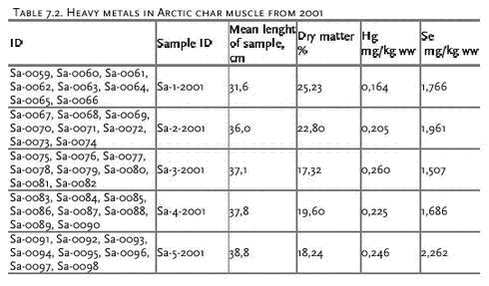
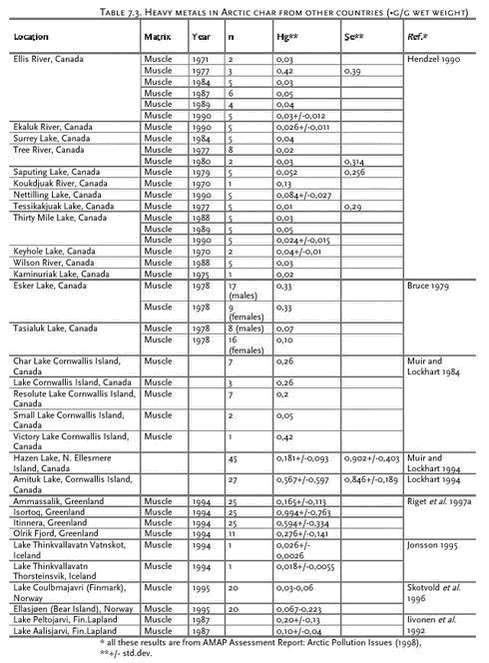
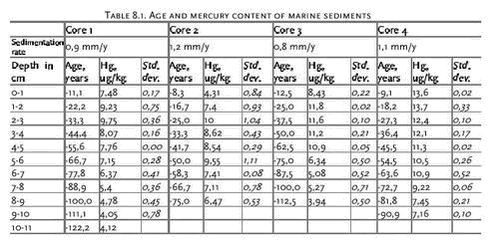
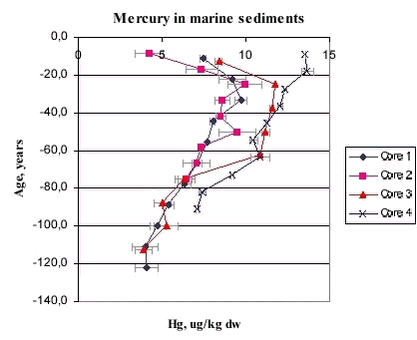
In 2001 the Arctic char were analysed as pooled samples and Table 7.2 shows the results of the heavy metal analysis. In Table 7.3 heavy metal results from Arctic char in other countries are listed and our results are high compared to other countries. Only the results from Greenland and some Canadian lakes are higher. 8 SedimentsMercury is released to the atmosphere in connection with combustion of fossil fuels and in particular combustion of coal. The atmospheric mercury can be transported over large areas and later dry-deposited or precipitated with rain or snow and thus re-enter soil and sediments. By analysing the age and the mercury content of the deposits, the trend of mercury pollution during the years can be depicted. 8.1 Marine sedimentsA special task for 2000 was to look for time trend in mercury in marine sediment cores. 8.1.1 Sampling and sample treatmentThe sampling was carried out by the research vessel “Magnus Heinason” on the 26th of July 2000. Four sediment cores were taken at position 61° 51‘ N, 05° 44‘ V at sea depth approx. 330 m with a HAPS bottom-corer westerly on the “Sandoyarbanki” which is a bank area east of the Faroe Islands. The sediment cores were frozen and cut into 1 cm segments before delivery to the laboratory for analysis. The mercury analyses were carried out at the Food and Environmental Agency on the Faroe Islands, where the samples also were freeze dried and sieved in a 500 •m mesh sieve before they were sent to dating. The dating procedure was carried out at Risø National Laboratory, Department of Nuclear Safety Research based on analyses of 210Pb. 8.1.2 ResultsThe dating and mercury results are shown in the table below. By comparing the mercury results with the age of the sediment layers, a profile of how the mercury content has changed during the years can be shown. The figure below shows the profiles for the four sediment cores from “Sandoyarbanki”. As seen on the figure, the different cores show a great variation in the mercury content, especially the results for the last 20 years. The difference between the cores is on a scale of 10 ppb, while the variation within one sample is approximately 4 ppb where the deviation is largest. Some bioturbation was noted in the upper 1- 2 cm of core 1 – 3 and more subtle in core 4, though this was taken into consideration for the sedimentation rate analyses.
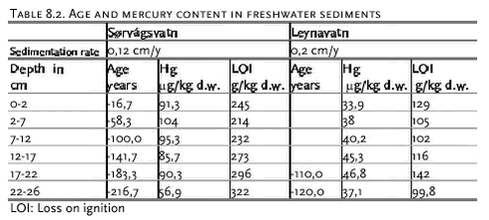
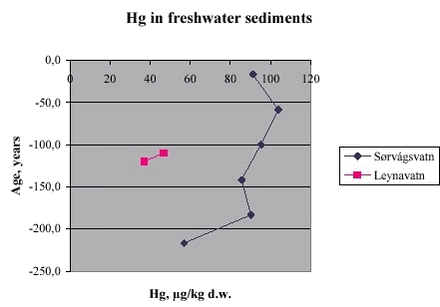
8.2 Freshwater sedimentsA special task in 2001 was to look for time trend in mercury in freshwater sediment cores. 8.2.1 Sampling and sample treatmentThe sampling was carried out on the 1th and 2nd of August 2000 in Leynavatn and Sørvágsvatn respectively. One sediment core was taken at each lake with a HAPS (kajak) bottom-corer at the deepest part of the lake at the positions 62° 07.72 N, 07° 01.05 V in Leynavatn and 62° 03.06 N, 07° 13.69 V in Sørvágsvatn. The sediment cores were frozen and cut into segments on 2 and 5 cm before delivery to the laboratory for analysis. The mercury analyses were carried out at the Food and Environmental Agency on the Faroe Islands. The dating procedure, based on analyses of 210Pb, was carried out at Risø National Laboratory, Department of Nuclear Safety Research, where the samples also were freeze dried and sieved. 8.2.2 ResultsThe dating and mercury results are shown in the table below. By comparing the mercury results with the age of the sediment layers, a profile of how the mercury content has changed during the years can be shown. Unfortunately the 4 top layers of the core from Leynavatn could not be dated because there of some reason had been a some mixing in the upper sediment layers. So only the two lowest layers of the core from Leynavatn had not been effected by the mixing and could therefore be dated. The figure below shows the profile for the sediment core from Sørvágsvatn.
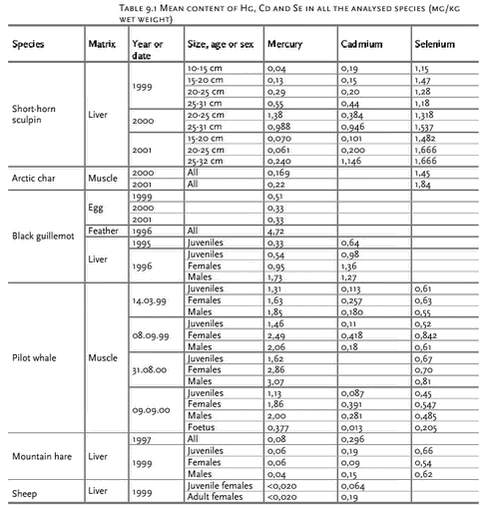
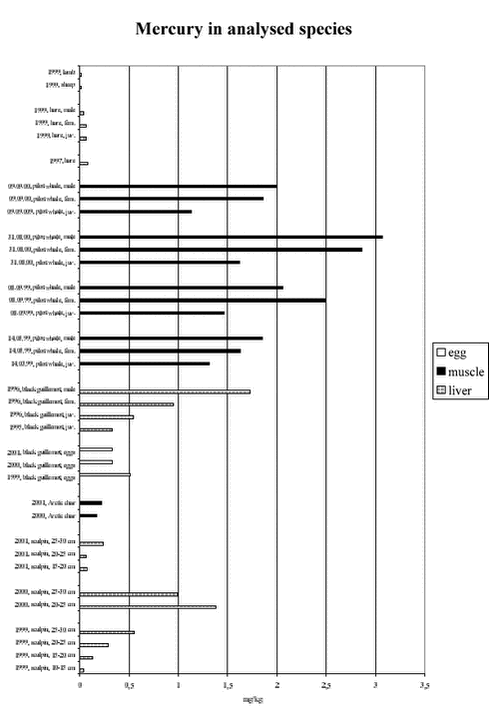
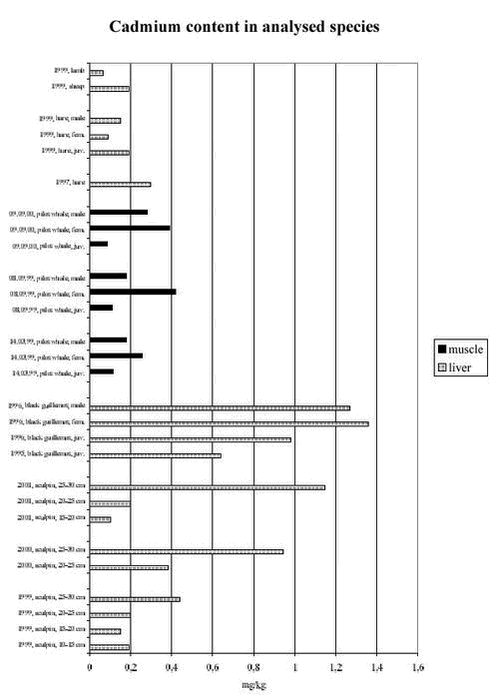
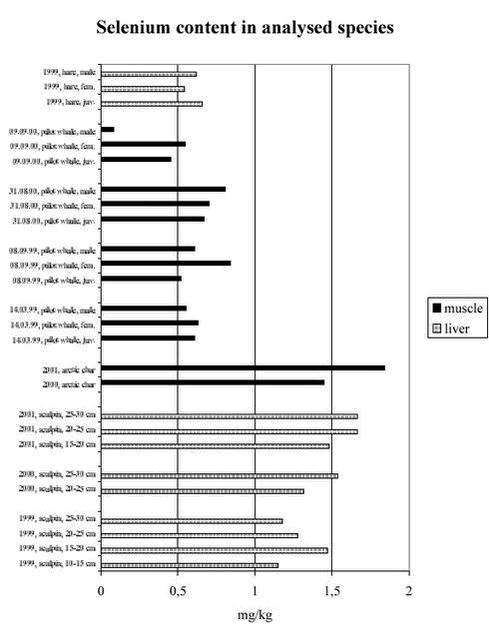
Overall, the mercury concentrations appear to be approx. twice as high in sediments from Sørvágsvatns as in those from Leynavatn. Compared to similar analyses in other places, we may note that the Leynavatn results are alike the ones in Grenland (Riget et al., 2000) and in the lower end of the results found in Arctic Norway Lakes and in Spitsbergen lake sediments (Skotvold et al., 1996). The mercury concentration Sørvágsvatn sediment are also within the range found in Arctic Norway and Spitsbergen. As a standalone set of data the present results on mercury in freshwater sediments do not allow any conclusions as to whether the increased mercury concentrations in the last 200 yrs which are observed in the Sørvágsvatn are caused by natural variations, manmade variations introduced by land use or manmade variations caused by long-range transport. 9 ConclusionIn this report the results of AMAP fase II heavy metal analysis from the Faroe Islands, as coordinated by the Food and Environmental Agency, are presented. Table 9.1 and the figures below give overviews of all the species analysed in 1999, 2000 and 2001. The content of heavy metals in the different species varies much and this reflects the difference between the analysed species, e.g. their position in the food web and their longevity. Most heavy metal analyseses in our AMAP program has been done on liver tissue, in compliancy with the guidelines. However, in certain instances like with the pilot whale, we have special interests in analysing other or additional tissues to what has been agreed on an international basis, and this stems primarily from our interest to monitor the contaminants concentration in species which are known to be important sources for human heavy metal exposure. In 1998 fulmar (Fulmarus glacialis) liver was analysed (Larsen, R.B. and Dam. M. 1999) and these results showed also very high concentration of cadmium (8,55 mg/kg wet weight) and for mercury the mean concentration for adult and immature birds was 2,66 mg/kg wet weight. When comparing black guillemot with other Faroese seabirds, the mean level of mercury in shag (Phalacrocorax aristotelis) liver was approximately 0,5 mg/kg wet weight, and for cadmium the concentration in shag liver was approximately 0,5 mg/kg wet weight with the highest concentration in adult female. For common eider (Somateria molissima) the mercury concentration did not exceed 0,7 mg/kg wet weight and for cadmium the concentration range was 2,5 to 5 mg/kg wet weight (Dam. M. 1998). Direct comparison between the species is difficult because of the different tissues analysed, however some broad lines may be drawn. Not surprisingly, the concentration in the sheep are lowest with no detectable mercury. After the sheep comes the hares and the heavy metal contents are also low for the hares livers. The sheep and hares are herbivorous, and herbivores are known to have low concentrations of environmental pollutants because of a short food web. Mercury and cadmium concentration in sculpin liver range between 0,04 and 0,55 mg Hg/kg and 0,15 to 0,44 mg Cd/ kg for 1999, between 0,99 and 1,38 mg Hg /kg and 0,38 to 0,95 mg Cd/kg for 2000 and between 0,07 and 0,26 mg Hg/kg and 0,1 to 1,19 mg Cd/kg in 2001. Recent research has not been made on sculpins in the Faroes and the diet of sculpins is not known in detail. In The Zoology of the Faroes the diet is described as consisting of crustaceans etc. (Joensen, J. S. and Vedel Tåning, Å., 1969). From all the sculpins we have analysed, the stomachs with content are stored, and these may be used for a future study of the sculpins diet. When comparing the mercury results from pilot whales with mercury results from 1997 (Larsen, R.B. and Dam, M. 1999) we see that the results for the school from 08.09.99 are comparable with the results from 1997, while the results from 14.03.99 are lower. The results from 1997 however, pertain to pooled samples while the results from this study apply to individual samples. In the table below the selenium results are also included, and for the sculpins the results are very high, about twice as high as the selenium concentration in pilot whales and hares. However, the comparision shall be done with care, because the results apply not only to different species but to different tissues as well; for the sculpins and the hares the liver content is measured and for pilot whales the muscle content is measured.
10 ReferencesAMAP Assessment Report: Arctic Pollution Issues (1998) Asmund, G. & Cleemann, M. (2000) Bloch, D. and Fuglø, E. (1999) Bloch, D., Jensen, J-K. and Olsen, B. (1996) Caurant, F. and Amiard-Triquet, C. (1995). Caurant, F., Amiard, J.C., Amiard-Triquet, C. and Sauriau, P.G.(1994). Dam, Maria (1998) Desportes, G., Sabourea M. and Lacroix A. (1993) Gydemo, R. (1982) Joensen, J. S. and Vedel Tåning, Å. (1969) Juelshamn, K., Andersen, A., Ringdal, O. and Mørkøre, J. (1987). Kålås, John Atle and Lierhagen, Syverin (1992) Larsen, Rikke Berg and Dam, Maria (1999) Martin, A.R. and Rothery, P. (1993) Pethon, P. (1985) Reinert A., (1998) Riget, F. Asmund, G and Aastrup, P. (2000). Ryggi, Mikkjal á (1951) Skotvold, T., Wartena, E.M.M. and Rognerud, S. (1996). Sørensen, Søren. and Bloch, Dorete. (1990)
1 Centre de toxicologie du Quebec, Canada 2 Dam, Maria 1998. Hvad spiser teist, edderfugl og topskarv på Færøerne, og hvad er indholdet af miljøgifte i disse fugle? Food and Enviromental Agency, Faroe Islands. ISBN 99918-940-1-2 3 Skinn is a special Faroese unit for measuring the whale size based on an assessment of the mass fit for human consumption. 4 National Environmental Research Institute of Denmark 5 Centre de toxicologie du Quebec, Canada 6 "Norðuri á Fossum" - Færøernes referansestation i det internasjonale nettverk for integrert Monitorering av Langtransportert Luftforurensning UN/ECE, Miljø og Levnedsmiddelstyrelsen Færøyene 1998 7 "Norðuri á Fossum" - Færøernes referansestation i det internasjonale nettverk for integrert Monitorering av Langtransportert Luftforurensning UN/ECE, Miljø og Levnedsmiddelstyrelsen Færøyene 1998 8 National Environmental Research Institute of Denmark |
