AMAP Greenland and the Faroe Islands 1997-20017 AMAP Faroe Islands 1999 - 2001 POPsAcknowledgementsSummary and conclusions 1 Introduction 1.1 Sampling and sample treatment 1.2 Analysis 2 Short-horn Sculpin 2.1 PCB 2.2 Pesticides 3 Black guillemot eggs 3.1 PCB 3.2 Pesticides 4 Pilot whale 4.1 PCB 4.2 Pesticides 4.2.1 Toxaphene 4.2.2 DDT 4.3.2 Other organochlorinated pesticides 5 Hare 5.1 POP results from 1997 5.2 POP results from 1999 6 Arctic char 6.1 PCB 6.2 Pesticides 7 Cows milk 7.1 Results 8 References Katrin Hoydal Food and Environmental Agency AcknowledgementsThe project described in this report was financed by DANCEA (Danish Cooperation for Environment in the Arctic). Please note that the content of this report does not necessarily reflect the views of the Danish EPA. Responsible for the project were Jacob P. Joensen and Maria Dam. We would like to take the opportunity to thank the people who have contributed to this project by taking samples at sea, in the air, in the mountains and in the lakes, or assisted in the completion of the project in other ways: Hanus Olsen Summary and conclusionsThis report is based on results from POP analyses in connention with the Arctic monitoring and Assessment Program (AMAP) on the Faroe Islands in the period 1999-2001. Different marine, terrestrial and freshwater species have been analysed. The compounds which have been analaysed for are: PCB and organochlorinated pesticides (14 single congeners, chlordanes, ß-HCH), DDT (o,p-isomers and metabolites) and toxaphene (incl. total toxaphene and 5 single parlars). The following species were analysed from the marine environment: The following species were analysed from the terrestrial and freshwater environment: In addition cows milk has been analysed for dioxin. 1 IntroductionThe POP analysis for AMAP phase II include PCB and organochlorinated pesticides (14 single congeners, chlordanes, ß-HCH), DDT (o,p-isomers and metabolites) and toxaphene (incl. total toxaphene and 5 single parlars). Total toxaphene is quantified from the response for 21 components of the technical toxaphene standard. The selected peak set includes: Parlar’s number 26, 31, 32, 38, 39, 40+41, 42, 44, 50, 51, 58, 59, 62, 63, 69 and 6 peaks unidentified. This method can only be accurate if the technical toxaphene standard remains intact in the samples. Table 1.1 shows the species analysed in 1999 and 2000. All the samples were collected the respective years except for the hare samples, which were collected in 1997 and 1999 and the pilot whale samples, which were collected in 1999 and 2000. As a special task in 1999 cows milk was analysed for dioxin
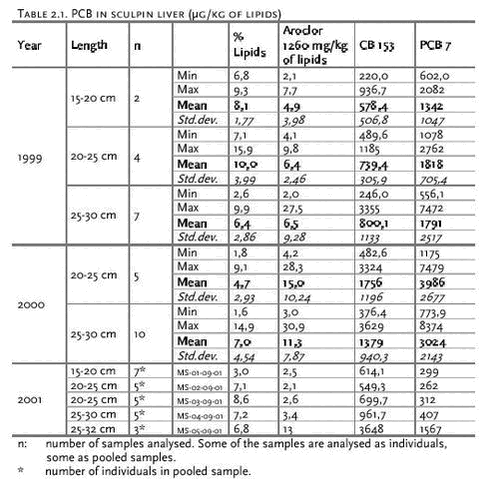
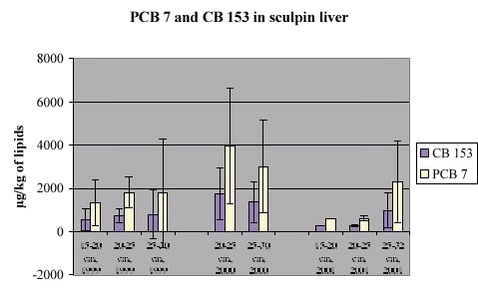
1.1 Sampling and sample treatmentBesides the POP analyses, the collected samples have also been analysed for heavy metals. The heavy metal results have been reported separately and the description of sample collection and sample treatment in the heavy metal report also represents the POP samples. Hence, a further description of sample collection and sample treatment is found in Chapter 6, Olsen et al. 1.2 AnalysisAll the POP analyses, except for the dioxin analyses, were made at CTQ (Centre de toxicologie du Quebec, Canada). All the analysed compounds, except cis-nonachlor and p,p’-DDT, were determined by GC/ECD. Cis-nonachlor and p,p’-DDT were determined by GC/MS. For a more detailed description of the analyses see Pedersen et al. (2000). The dioxin analyses were performed at the University of Umeå in Sweden. A high resolution gas chromatograph and a high resolution mass spectrometer (HRGC/HRMS) were used for the analyses. 2 Short-horn SculpinThe POP analysis were made on liver tissue and the division of the samples were made the same way as for the heavy metal analysis (Chapter 6, Olsen et al.), with the exception that sample number 1-1999 and 2-1999 not were analysed because of lack of tissue material. There were all together 13 analyses in 1999 and 15 analyses in 2000 of which some were made on pooled samples and some on individual samples, and 5 analyses in 2001 which were made on pooled samples. The composition of the sculpin samples are shown in Chapter 6, Olsen et al., table 2.1 and 2.2. The analyses were carried out at CTQ. The tissue was stored in polycarbonate jars until analysis. 2.1 PCBIn the tables below the content of PCB is shown as Aroclor 1260, PCB 7 and level of CB 153 from 1999 and 2000. PCB 7 is the sum of seven PCB congeners, which are CB 28, CB 52, CB 101, CB 118, CB 138, CB 153 and CB 180.
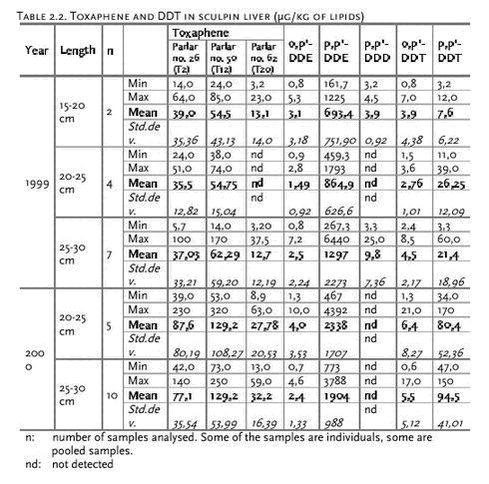
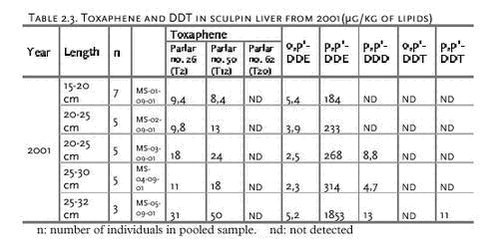
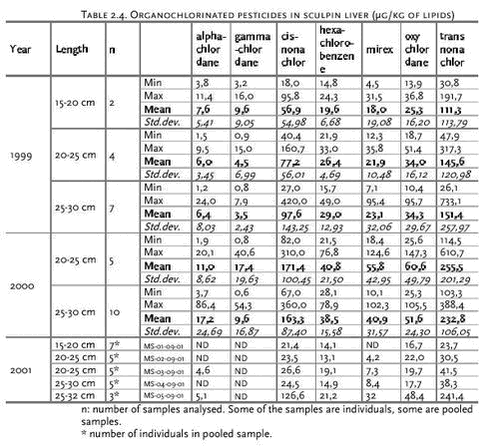
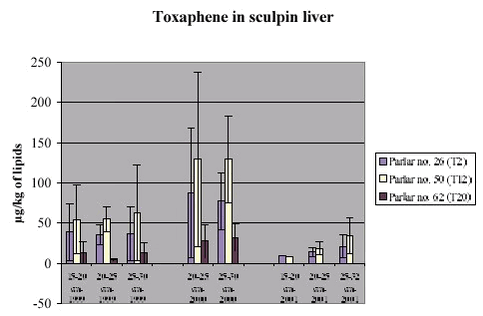
2.2 PesticidesTable 2.2 and Table 2.4 show the content of different pesticides in sculpin liver. Toxaphene parlar no. 32 and 69, o,p‘-DDD and ß-HCH were not detected in any of the sculpins analysed.
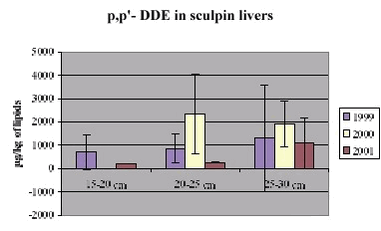
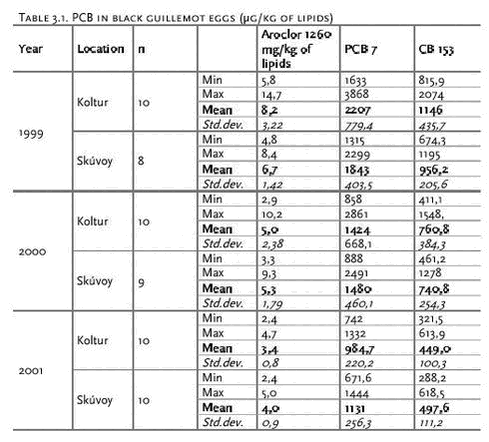
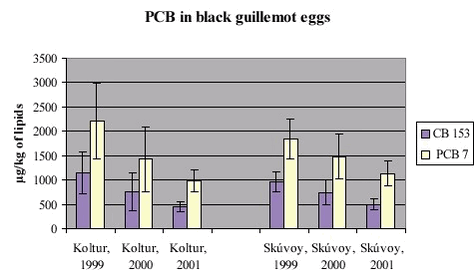
The POP results are grouped according to length. The POP content seems to be increasing with increasing length although POP content and length are not significantly correlated. There was not found significant correlation with age either. All the POP results show great variation, but the results seem to be quite similar among the size groups the respective years. The results from 2000 seem to be higher than the 1999 results, which seem to be higher than the 2001 results. There was also found higher levels of heavy metals for the sculpins from 2000 (Chapter 6, Olsen et al.). One parameter that is different for the years is the fishing stations, but according to the information available regarding sewage outlets etc., the substations used in 2000 are not nearer to local pollution than the substations used in 1999. The stations used in 2001 are though different from the other two years by, that almost all the sculpins from 2001 were catched by fish trap instead of with fishing rod. 3 Black guillemot eggsBlack guillemot eggs were sampled at two different locations – Koltur and Skúvoy - in 1999, 2000 and 2001. Each year 8-10 eggs were taken at each location and the eggs were analysed individually at CTQ. The content of the egg was stored in polycarbonate jars until analysis. 3.1 PCBIn the table below the PCB content is shown as Aroclor 1260, PCB 7 and CB153. The content of CB153 is approximately half of the level of PCB 7 for all the groups. The results are on the same level for the different locations, but the levels are decreasing each year. The decrease in CB 153 from 1999-2000 is found to be significant in Koltur (P= 0,05) but not in Skúvoy (P=0,08) while the decrease from 2000-2001 was significant for both Koltur (P= 0,02) and Skúvoy (P=0,01). For the mercury results the levels were decreasing from 1999 to 2000 but appeared to be unchanged from 2000 to 2001 (Chapter 6, Olsen et al.). A fall in Hg and PCB levels could be indicating a change in throphic level and this needs to be investigated further.
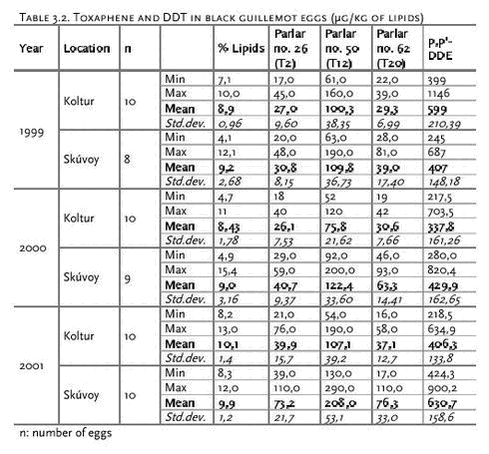
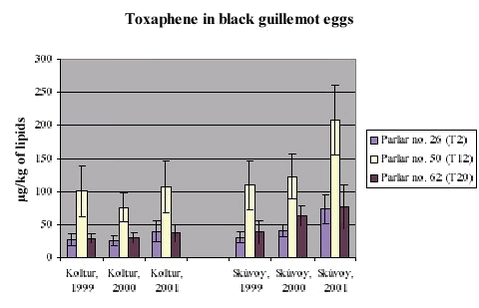
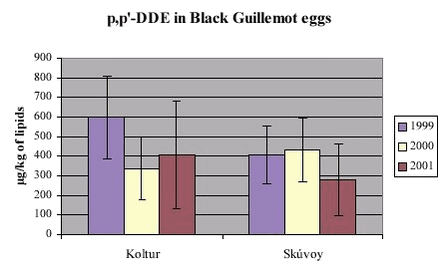
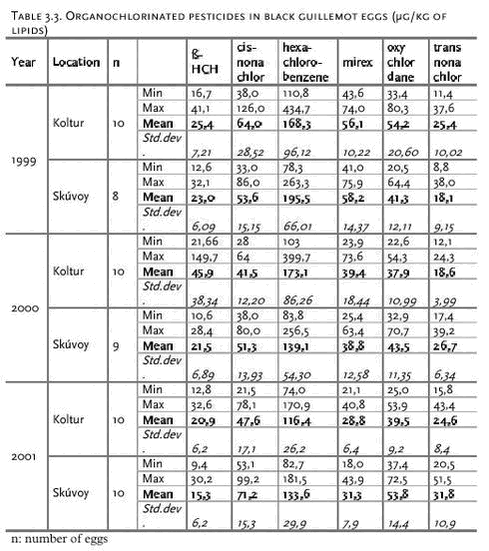
3.2 PesticidesTable 3.2 and Table 3.3 show the content of organochlorinated pesticides and derivated compounds in black guillemot eggs. Toxaphene parlar no. 32 and 69, o,p’-DDE, o,p’-DDD, p,p’-DDD, o,p’-DDT, p,p’-DDT, alpha-chlordane and gamma-chlordane were either not detected or found in levels just above detection limit.
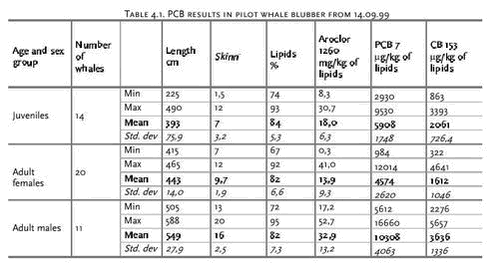
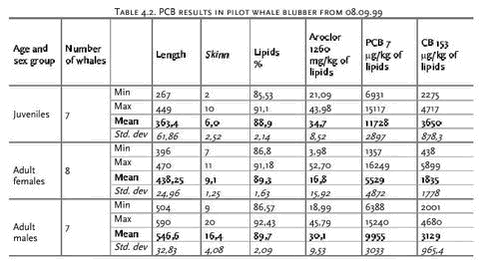
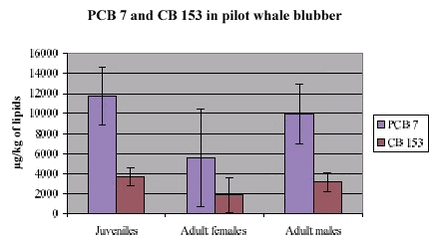
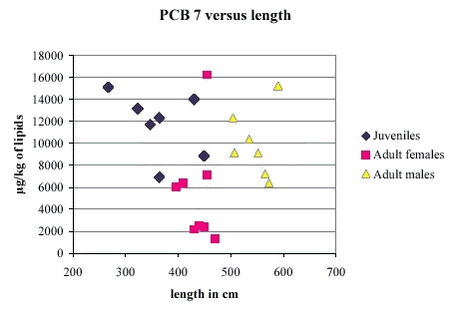
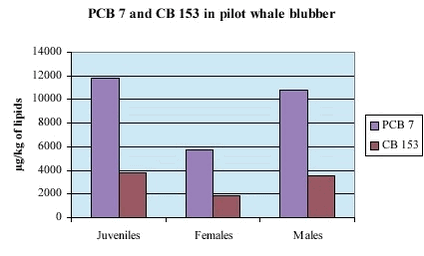
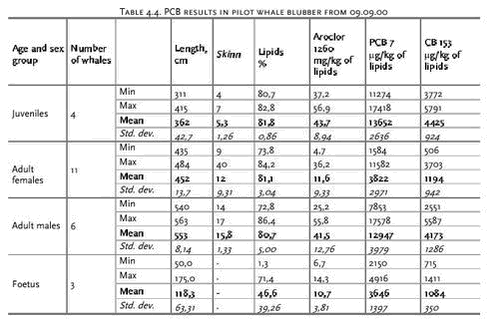
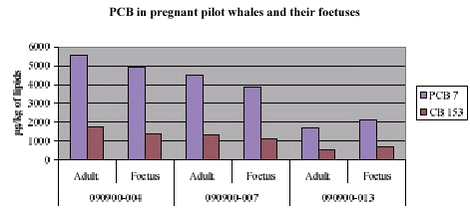
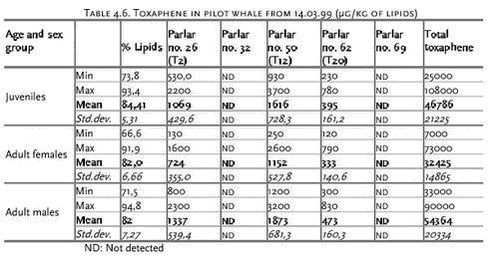
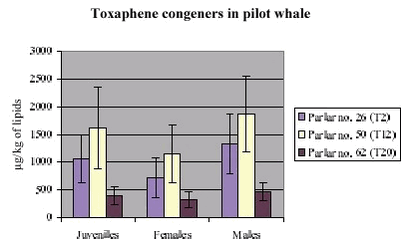
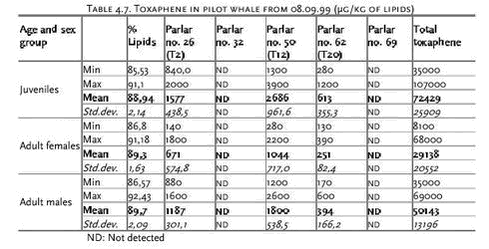
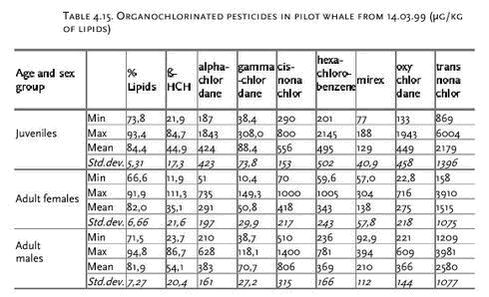
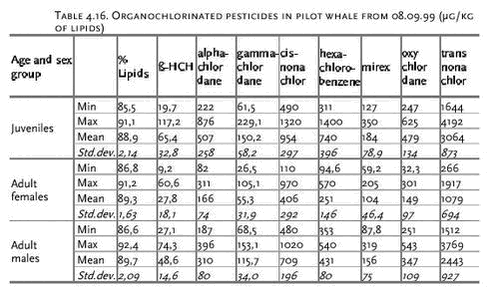
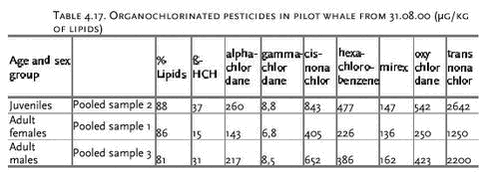
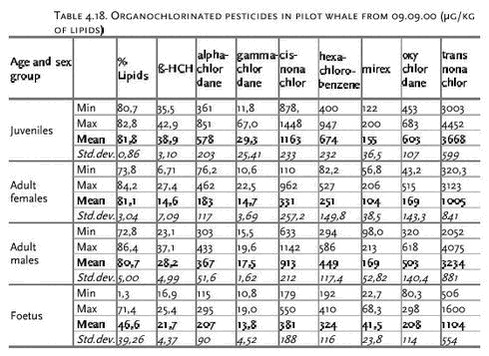
4 Pilot whaleThe POP analysis were made on blubber from four different whale schools and the results are treated separately. The analyses were made on 45 individuals from the school from 14.03.99, 23 individuals from 08.09.99, 50 individuals from the school from 31.08.00, which were analysed as three pooled samples (males, females and juveniles) and on 21 individuals from 09.09.00 of which three were pregnant and samples were taken of the foetuses as well (altogether 24 samples). 4.1 PCBIn the table below the PCB results are shown as Aroclor 1260, PCB 7, and CB 153. CB 153 is the congener which is absolutely dominant. PCB 7 is the sum of seven PCB congeners, which are CB 28, CB 52, CB 101, CB 118, CB 138, CB 153 and CB 180.
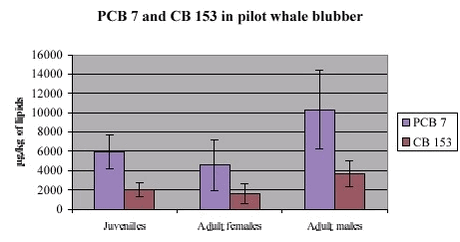
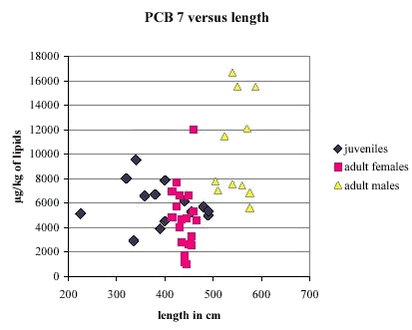
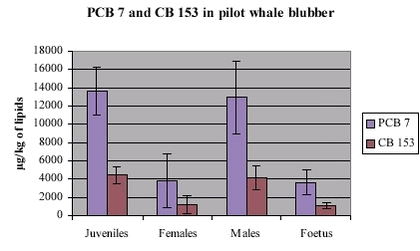
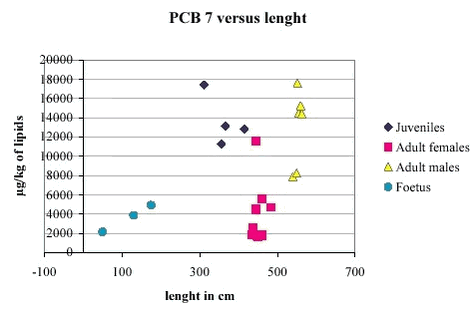
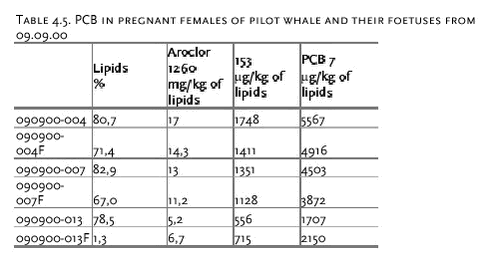
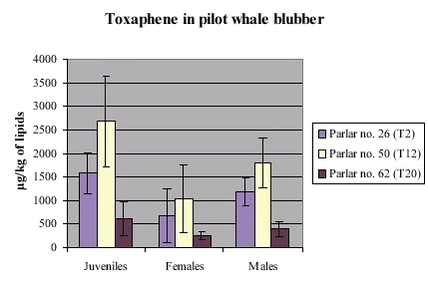
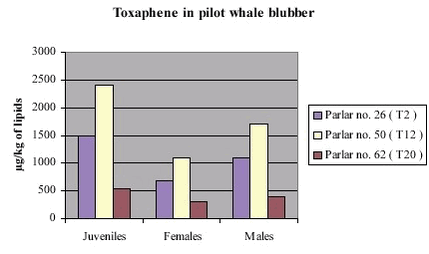
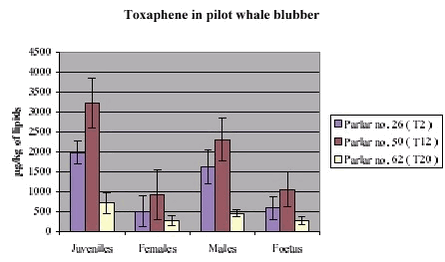
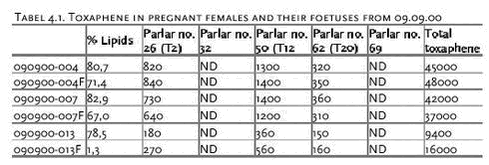
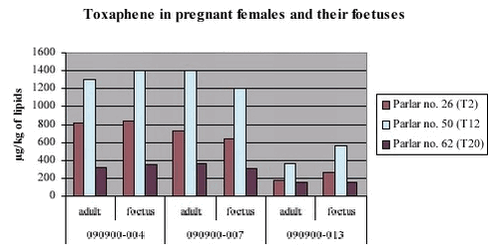
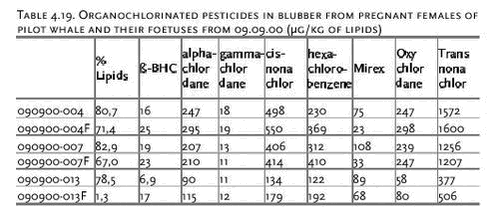
CB153 is the PCB congener that forms most of the content of PCB 7. In Figure 4.1, Figure 4.3, Figure 4.5 and Figure 4.6 PCB 7 is shown together with CB 153 for the three age and sex groups for the four whale schools. The enhancement in the males above that in females are similar for all four whale schools. POPs are lipid soluble and therefore female mammals have possibility to remove these toxic compounds via the milk, and that is reflected in the juveniles which have higher concentrations of PCB than the adult females. The school from 14.03.99 shows, as would be expected, that the males have the highest content of PCB, but in the three other schools the juveniles have the highest content of PCB, even higher than the males. This was also seen in two whale schools from the Faroe Islands in 1997 (Dam and Bloch, 2000). Figure 4.8 shows that the PCB content in foetuses is almost as high as in the pregnant females. In 090900-013 the foetus has even higher concentration of PCB than the mother based on the lipid weight. This can be due to that this foetus is very small and has a very low lipid content (1,3 %) even though it was the blubber that was analysed. In Figure 4.2, Figure 4.4. and Figure 4.7 PCB 7 is depicted against the length of the whales for the three groups. 4.2 Pesticides4.2.1 Toxaphene
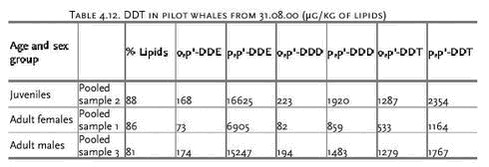
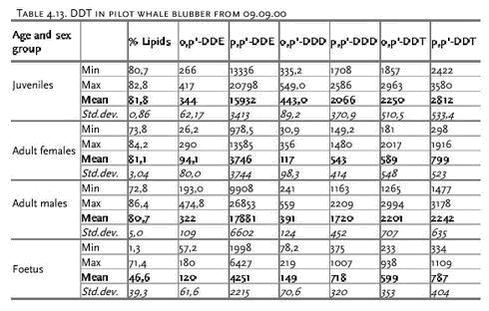
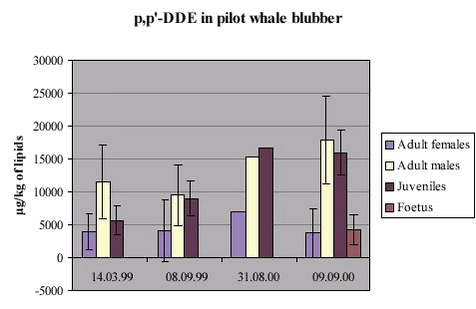
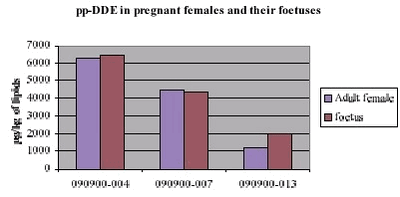
4.2.2 DDT
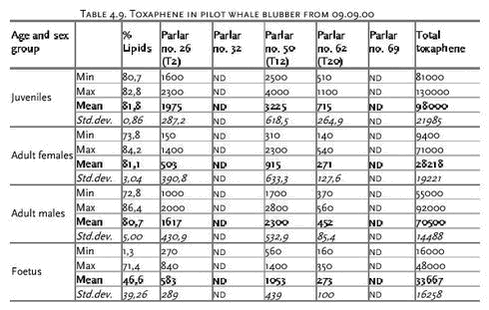
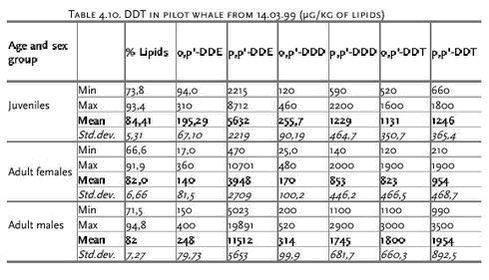
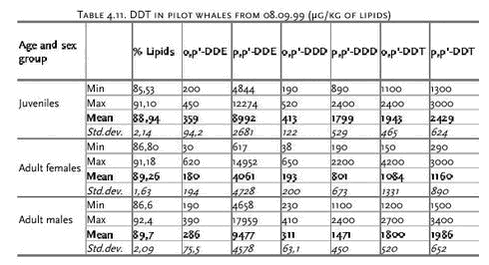
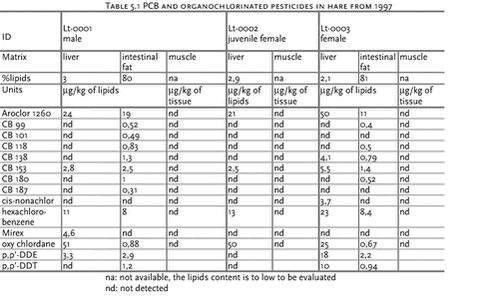
Figure 4.15 4.3.2 Other organochlorinated pesticidesThe pesticide results show the same tendency as the PCB results. For the school from 14.03.99 the adult males have the highest content followed by the juveniles which have higher content than the females. For the other three schools the concentration in the juveniles is just as high or higher than the concentration in males while the concentration in the females is lowest. However, in the DDT analyses, only the school from 31.08.00 show that the juveniles have higher content than the males. They also show, that the the schools from 2000 seem to have higher DDT content than the schools from 1999. The toxaphene results seem to be higher in the school from 09.09.00 than in the other schools. 5 HareIn 1999 only three hares were analysed. The hares were hunted in 1997 and liver, muscle and intestinal fat were analysed for PCB and organochlorinated pesticides including DDT and toxaphene. In 2000 liver samples were analysed from 26 hares, which were hunted in 1999. Both individual and pooled samples were made, all together 13 samples, which were analysed for PCB and organochlorinated pesticides. The composition of the samples is seen in Chapter 6, Olsen et al., table 5.2. The analyses were performed at CTQ. 5.1 POP results from 1997Table 5.1 shows the results of the PCBs and organochlorinated pesticide analyses in different tissue of three individuals of hare from 1997. The PCB congeners: CB 28, CB 52, CB 105, CB 128, CB 156, CB 170 and CB 183, beta-HCH, alfa-chlordane, gamma-chlordane, trans-nonachlor, o,p’-DDE, o,p’-DDD, p,p’-DDD, o,p’-DDT and toxaphene parlars no. 26(T2), 32, 50(T12), 62(T20) and 69 were not detected in any of the tissues analysed.
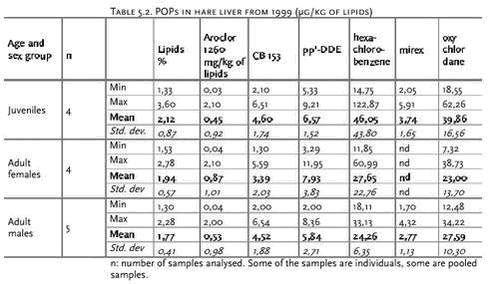
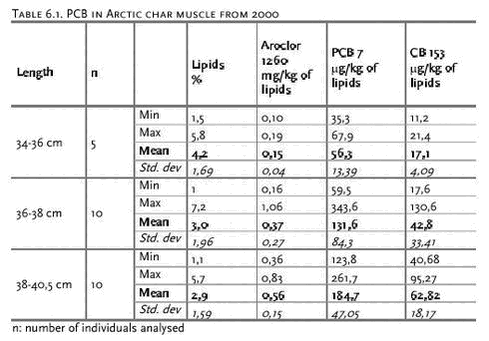
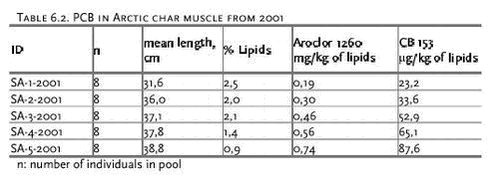
5.2 POP results from 1999Table 5.2 gives the results of PCB and pesticide analyses in hare liver samples from 1999. The PCB congeners: CB 28, CB 52, CB 99, CB 105, CB 118, CB 128, CB 138, CB 170, CB 180, CB 183 and CB 187, beta-HCH, alfa-chlordane, gamma-chlordane, cis-nonachlor, trans-nonachlor, o,p’-DDE, o,p’-DDD, p,p’-DDD, o,p’-DDT and toxaphene parlars no. 26(T2), 32, 50(T12), 62(T20) and 69 were not detected in any one of the individuals. CB 153 was the only PCB congene detected except CB 101 and CB 156 which each was detected in one individual, and the values were around the detection limit. Of the DDT derivatives p,p’-DDE was the only one detected except p,p‘-DDT which was detected in two individuals, and the values were also quite low. Toxaphene was not detected, and for the other pesticides only hexachlorobenzene, mirex and oxychlordane were detected and for mirex only some of the individual results were above the detection limit while others were not detected. When looking at the different groups the juveniles have the higher values than the adults for several compounds. This may be reflecting the fact that juveniles receive the lipid soluble pollutants with the milk from the mother, and at the same time offloads some of her body burden. The adults, which are herbivores receive only a small amount of lipid soluble pollutants with their food. 6 Arctic charArctic char were sampled in 2000 and 2001 and analysed for PCB and organochlorinated pesticides, DDT and toxaphene congeners. In 2000 muscle tissue from 25 Arctic char was analysed individually and the samples were stored in polycarbonate jars until analysis. 6.1 PCBTable 6.1 and Table 6.2 show the PCB concentration in Arctic char muscle from 2000 and 2001 respectively, as Aroclor 1260, PCB 7 and CB 153.
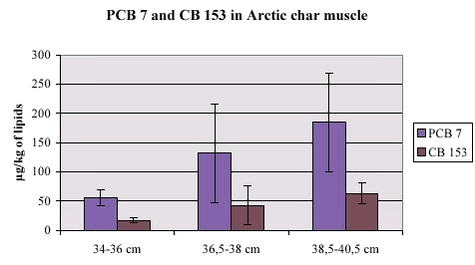
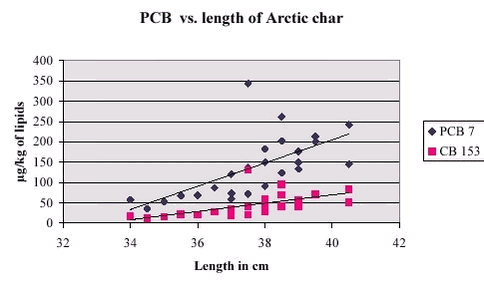
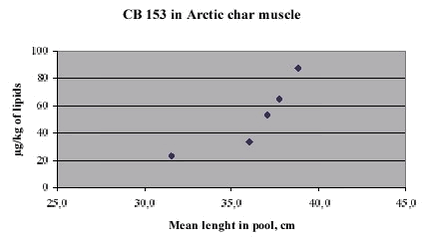
The PCB content is significantly correlated to length with P(2 tail)= 0,00001 for both PCB 7 and CB 153. Correlation with age is only significant for PCB 7 (with 5% level of significance), with P(2 tail)= 0,04 and 0,06 for PCB 7 and CB153, respectively.
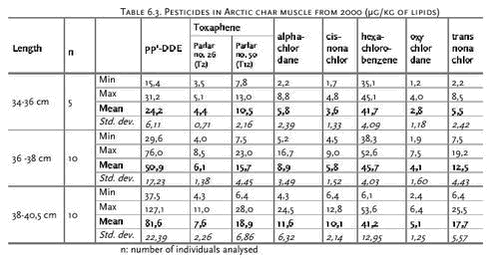
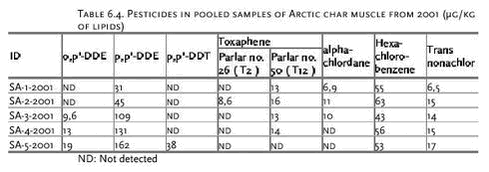
6.2 PesticidesTable 6.3 shows the concentration of pesticides in Arctic char muscle from 2000. Toxaphene parlars no. 32, 62(T20) and 69, o,p’-DDE, o,p’-DDD, p,p‘-DDD, o,p‘-DDT, p,p‘-DDT, ß-HCH, gamma-chlordane and mirex were not detected in any of the individuals analysed in 2000.
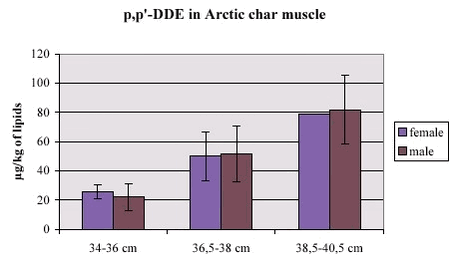
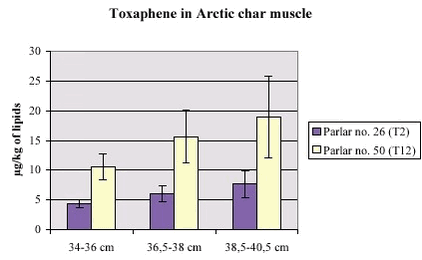
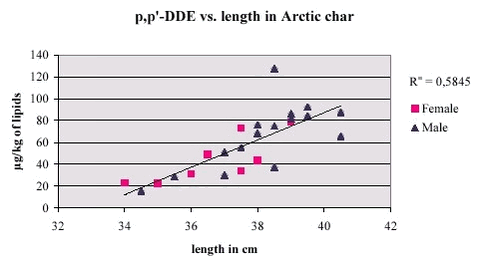
As for the PCB results, the concentration of pesticides, except alphachlordane and hexachlorobenzen, are correlated to length (P(2tail)=<0,0005).
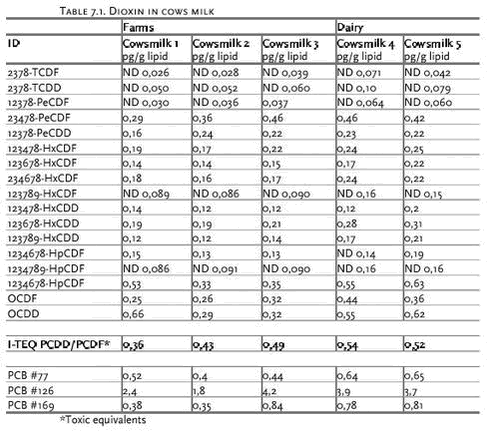
Table 6.4 show the concentration of pesticides in the pooled samples of Arctic char from 2001. Toxaphene parlars no. 32, 62(T20) and 69, o,p’-DDD, p,p’-DDD, o,p‘-DDT, ß-HCH, gamma-chlordane, cis-nonachlor, mirex and oxy-chlordane were not detected in the samples analysed in 2001. 7 Cows milkAs a special task in 1999 cows milk was analysed for dioxin. In countries, where marine mammals are not a part of the human diet, milk and milk products are the most important source of dioxin exposure. The Faroe Islands are approximately self-sufficient on milk. Generally app. 40% of the cows fodder is imported from Denmark and Iceland while 60% is locally produced but the percentages vary among farmers One sample was taken from each of three milk-producing farms. These three were among the five biggest milk producers in the Faroe Islands. The samples were taken directly form the milk-tank at the farm. In addition two parallel samples were taken of the final product at the dairy. The milk samples were frozen and sent to the University of Umeå for analyses. 7.1 Results8 ReferencesDam, M. & Bloch, D. (2000). Screening of Mercury and Persistent Organochlorine Pollutants in Long-Finned Pilot Whale (Globicephala melas) in the Faroe Islands. Marine Pollution Bulletin Vol. 40, No. 12, pp 1090-1099 Pedersen, B., Glausius, M. and Hansson, B. (2000). Report from audit visit at Centre de Toxicologie du Quebec, Quebec, Canada, Concerning POP-analyses in the AMAP- programme - Report prepared for Dancea-AMAP December 2000.
1 Skinn is a special Faroese unit for measuring the whale size based on an assessment of the mass fit for human consumption. 2 Skinn is a special Faroese unit for measuring the whale size based on an assessment of the mass fit for human consumption. |


