Market information in life cycle assessment4 Market-based system delimitation4.1 Introduction4.2 Scale and time horizon of the studied change 4.3 Market delimitation 4.4 Market trends 4.5 Production constraints 4.6 Suppliers/technologie s most sensitive to change 4.7 Environmental product declarations 4.8 Examples of the identification of affected processes 4.1 IntroductionThe idea that market information is important in determining what processes to include in a product system was suggested already by Weidema (1993). Here it was suggested that the actual environmental impacts are most correctly modelled by using environmental data on the marginal technology, defined as the technology actually affected by a small change in demand (Weidema et al. 1999). As mentioned in footnote 10, we now refer to this technology simply as the “technology actually affected,” thus avoiding the term “marginal” as it may give rise to confusion due to its many different connotations in everyday-language. Also, compared to the procedure presented in Weidema et al. (1999), the procedure presented here is not only relevant for small (marginal) product substitutions, but has been generalised to cover also larger substitutions. To build a model of a product system, it is natural to start with the process in which the reference flow occurs (see chapter 3). Each item in the reference flow is then linked to the next process both backwards and forwards in the life cycle. Backwards, the flow typically consists of intermediate products, components, ancillary inputs, and raw materials. Forwards, the flow may also consist of final products, products for reuse or recycling, and waste to treatment. To make it simple, we call all these flows “intermediate product flows”. Flows to the environment (environmental exchanges) are typically not included in the first description of a product system. The purpose of the procedure presented here is to determine the process(es) that a specific intermediate product flow should be linked to, and which therefore should be included in the studied product system. It is for these processes that data on environmental exchanges are later to be collected. The overall uncertainty of a life cycle assessment will often be determined by what processes are included and excluded from the analysed product systems. A product substitution (e.g. the choice of one chair design instead of another) will result in a change in demand for the intermediate products that enter into the process in which the substitution occurs (e.g. the steel and plastic components that are used by the chair manufacturer), and likewise in the demand for the further intermediate products backwards in the life cycle (e.g. the plastic raw materials). The procedure presented here identifies the processes that are expected to be affected by such a change in demand for a specific intermediate product. A product substitution will also result in a change in supply of the intermediate products leaving the process in which the substitution occurs, and in supply of the further intermediate products forwards in the life cycle (e.g. the distribution, retail sale, use and disposal of the chair). To make the description less abstract, the explanatory text for the procedure only covers the situation where an intermediate product is followed backwards in the life cycle (identifying the effects of changes in demand). This is the most typical situation, since the functional unit is often determined in relation to the use phase, and most of the life cycle typically comes before this phase. However, the 5 steps of the procedure, the decision tree in figure 4.1, as well as the general concepts in the explanatory text, are also applicable when following an intermediate product flow forwards in the life cycle (identifying the effects of changes in supply). Examples of this are the investigations in section 4.8 of the consequences of a change in supply of dairy products and of waste treatment. By the procedure presented here, one or more suppliers will be identified as being affected by a change in demand. The identified suppliers will typically use a specific technology and/or be located within a specific geographical region (since differences in market conditions and competitiveness typically depend on geographical and technological differences). The number of suppliers and the degree of detail of describing their technologies, depends on:
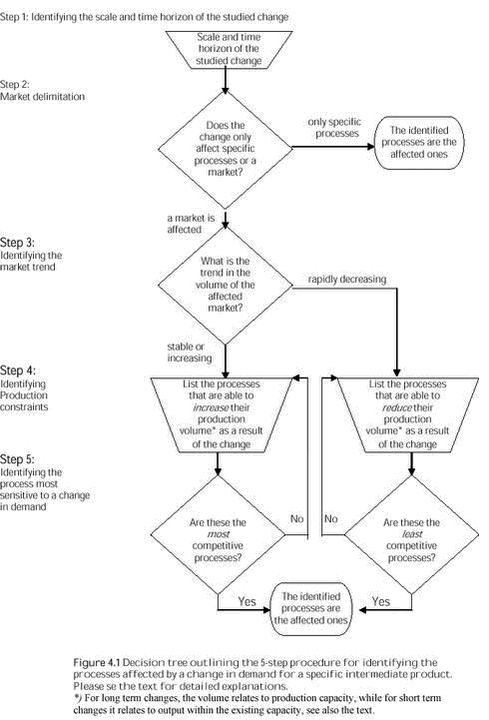
The implicit assumption of the presented procedure is that one or more suppliers have a fully elastic production and all other suppliers will not be affected by the changes in demand, i.e. having a fully inelastic production. If this assumption is regarded as too simple, the product system should include all suppliers that are expected to change, as well as all buyers that adjust their demand in response to changes in market price. This can be done either as separate scenarios or in the form of an average, weighted in proportion to the relative degree to which the processes are expected to be affected. The procedure outlined in figure 4.1 consists of 5 steps: Step 1: Identifying the scale and time horizon of the studied change In the following sections, we will have a closer look at some of the theoretical issues involved in each procedural step. In section 4.8, we present a larger number of examples where the procedure has been applied in practice. For the initial phases of a life cycle study, and for parts of the life cycle that are less important, the described procedure may be too elaborate and too demanding. Also, there may be situations where it is not possible to obtain the necessary market information. In these situations, the defaults in table 4.1 may be applied. The arguments for these defaults are given in the following sections.
4.2 Scale and time horizon of the studied changeAs already pointed out in section 1.3, we distinguish between small (marginal) and large product substitutions (and changes in demand). For small substitutions, we further distinguish between short-term and long-term substitutions. A product substitution is defined as small or marginal when it does not affect the determining parameters of the overall market situation, i.e. the direction of the trend in market volume and the constraints on and production costs of the involved products and technologies. The consequences of the substitution can thus be assumed linearly related to the size of the substitution and both an increase and a decrease in production volume will affect the same processes. A product substitution is defined as large when it affects the determining parameters for the overall market situation, i.e. the direction of the trend in market volume and the constraints on and production costs of the involved products and technologies. The substitution may therefore in itself bring new suppliers, new markets, or even new products and technologies, into focus. It can therefore not be assumed linearly related to the size of the substitution and increases and decreases in the production volume may affect different processes. For large substitutions, it is therefore necessary to take the direction of change into account. Large changes are typically seen when introducing new technology or new regulation on a significant market, e.g. if all cars were to be made from polymers and carbon-fibres in stead of steel, which among other consequences would have the market for steel turning from increasing to decreasing. However, many small changes may accumulate to bring about a large change. Therefore, even in studies of small changes it may sometimes be relevant to apply an additional scenario with the possible larger changes that could be the result of accumulated small changes. For example, even in a life cycle assessment considering a shift to polymers and carbon fibres for a single producer of cars, it may be relevant to investigate the possible consequences of other car producers following suit. However, the typical substitutions studied by life cycle assessment are (unfortunately) not of such significant size. As shown by Mattsson et al. 2001), even a change in electricity demand of 1 TWh can still be regarded as small (marginal), since it affects the same technologies as a change of 1 kWh, the effects thus being linearly related to the size of the substitution. As a default, when there is no information available to justify that the studied substitution affects the determining parameters for the overall market situation, it is therefore advisable to assume that the studied change is small. A short-term substitution affects only capacity utilisation, but not capacity itself. A long-term substitution affects also capital investment (installation of new machinery or phasing out of old machinery). Large substitutions will always affect capital investment. But even small substitutions can seldom be isolated to the short-term, since each individual short-term purchase decision will contribute to the accumulated trend in the market volume, which is the basis for decisions on capital investment (i.e. long term substitutions). This is obvious in markets with a short capital cycle (fast turnover of capital equipment, as e.g. in the electronics and polymer industries) and in free market situations (where market signals play a major role when planning capacity adjustments), but it is also true for markets with a long capital cycle (as e.g. in the building and paper industries). Thus, the isolated effects of short-term changes (i.e. effects within the existing production capacity) are only of interest in markets where no capital investment is planned (e.g. industries in decline), or where the market situation has little influence on capacity adjustments (i.e. monopolised or highly regulated markets, which may also be characterised by surplus capacity). An example of a substitution with a short-term effect only would be an isolated decision to remove heavy metals from the components of a product, which – all other things equal – would not involve capital investment in the metal industry, since heavy metals are already being phased out. As a default, when specific information is not available, it may be assumed that the studied change is long-term, since this is the typical situation. If a long-term substitution is planned and announced well in advance of its implementation (as e.g. the installation of a new pipeline), it may involve only long-term effects, i.e. effects from installation and production on newly installed capacity. But such planned decisions are the exception. Most long-term product substitutions will also lead to some immediate short-term effects, i.e. affecting the existing capacity, while at the same time affecting investments decisions and in the long run affecting the production from this newly installed technology. Since the technology affected in the short term will often be old technology (the least competitive technology which typically has a low capacity utilisation compared to newly installed technology) while the technology affected in the long term will often be new technology (at least in expanding markets), long-term product substitutions may thus often be seen to affect a mix of technologies (Mattsson et al. 2001). However, the short- term effect will typically be negligible compared to the long-term effect, simply because the long-term effect is typically more permanent, while the short-term effect is only lasting until the next capacity change.
Example: 4.3 Market delimitationIn most situations, the intermediate product is demanded on a market with several potential suppliers/technologies, which are adequately different to merit a closer investigation as to which ones are actually affected by the change in demand. The potential suppliers/technologies must be identified in terms of those who (can be expected to) deliver to this market. The market in question is identified by the obligatory product properties and the geographical and temporal market boundaries, i.e. in parallel to the first two steps of the procedure described in chapter 3 (actually described already in section 2.1). As a default, when no other information is available, narrow market segmentation may be applied, i.e. not assuming substitution among very different products, since this reduces the size of the possible error (assuming a wide market segment implies the inclusion of very different processes, compared to those within a narrower segment). In the early presentation of this procedure (Weidema et al. 1999), the need for geographical delimitation of the market was not adequately described, which caused some confusion as to the correct delimitation of e.g. the aluminium market. Ekvall et al. (1998) assumed the existence of a European market for aluminium, implying that an additional demand for aluminium in Sweden would lead to an increase in European production capacity. In response to this, Nordheim (1999) pointed out that there is no such thing as regional markets for aluminium, i.e. that aluminium should be regarded as a global commodity, and the affected aluminium production therefore should be determined on a global market, while the electricity source for this aluminium production will be supplied from several regional electricity markets, one for each of the aluminium production sites where capacity will be adjusted, see also the elaboration on aluminium in section 4.8. As a default for geographical segmentation, the value to weight ratio of the products may be applied, being properties that are practically always known and somewhat related to transport distances (see Weidema et al. 2003b), thus being indicative of geographical market boundaries. By assuming a local market for products with a low value to weight ratio, a continental market for products with medium value to weight ratio, and global markets for products with a high value to weight ratio, the possible error is minimised. Gielen (1998b) argue that for most bulk materials, Europe can be regarded as a closed economy. However, when available, knowledge should be applied regarding toll barriers, trade patterns, and geographical differences in overall production volume (such as for products that are only produced in certain locations or where price differences are large between different producing countries), since this can seriously affect the actual market boundaries. In some situations, the whole procedure may be cut short here, namely when only one supplier is possible, or a group of specified suppliers can be identified as the ones affected. This is the case if:
Many examples can be found of the latter situation, especially:
If a specific supplier (or group of suppliers) is identified as the one affected, it may be useful to justify that the production volume of this process is actually able to change. For this purpose, step 4 in the procedure (section 4.5) may be applied.
The procedure can only be terminated here if the production volume of the specific suppliers is actually expected to change as a result of the studied product substitution, i.e. as a result of a change in demand for the intermediate product. If the change in demand is transferred on to other suppliers of the intermediate product, the production volume of the specific supplier will not change. This may be the case in spite of close relations between supplier and customer, even in spite of ownership relations or sole-supplier-status, i.e. it is not the closeness of the relation, which is important, but whether the overall production volume of the supplier is actually expected to be affected. An example of this is in-house electricity production. If the in-house production fluctuates with in-house demand and thereby does not affect the production volume of the general electricity market, then the in-house production can be regarded as the affected electricity source for the in-house demand. However, if the in-house production takes place on normal market conditions, and the in-house production does not fluctuate with in-house demand (even when the company is closed), then the electricity supply for the in-house demand must be regarded as coming from the general electricity market, and not from the specific in-house production. This also means that a consequential, market-based life cycle assessment will only give credit for - and incentive to - a shift to specific products or suppliers with environmentally more preferable technologies, e.g. "green electricity", when this shift is actually expected to lead to an increase in the capacity of the "green" technology. If the shift only pretends to be an improvement, and no change is expected in the composition of the overall output, no credit is given. However, the effects of a shift may be delayed, so that the expected increase in the “green” technology will only appear after some time. For example, the production of ecological foods cannot react immediately to a change in consumer demand due to the time it takes to convert the production facilities to ecological production. In such instances, a demand for “green” products should still be credited for its long-term influence on the production capacity of the environmentally preferable technology. Also, the effects of a shift may be indirect, via the political signal that it sends. For example, a constraint on a specific “green” product may be overcome, e.g. by political intervention or because a private company takes up the challenge, as a result of a consistent unsatisfied demand for this product. Likewise, a consumer boycott of a particular product may be followed up by political action or “voluntary” changes in company behaviour that limits the production beyond the effects of the boycott itself. More speculatively, it can be argued that the credit for a “green” product can be so valuable to the buyer that this alone could lead to a situation in which a constrained market for a “green” product is kept artificially sub-optimised (see Ekvall et al. 2001). Since such indirect effects may be controversial and difficult to predict, it may be preferable to include them in separate scenarios. It should also be taken into account that such indirect effects are often “one-time-only” effects, e.g. political intervention that shifts a constraint from one level to another. After adjusting to the intervention, the situation finds a new equilibrium at the new level of the constraint. As a default, when there is no information available to justify that a specific supplier (or group of suppliers) will be the one affected, it is advisable to assume that a market will be affected. This is the typical situation, and by this the burden of the proof rests on the companies having established such close market ties, and therefore have the best access to the information on these. The technology that will be affected at different suppliers may often be the same modern technology, even though they may currently have very different technologies installed (e.g. a company which has been in operation for a long time may be dominated by older production lines, while a factory that has recently entered into the market may on average have a more modern technology). In a consequential, market-based life cycle assessment, both suppliers will appear with the same modern technology, since this is what will be affected by a change in demand. Thus, the company with a longer history will not be punished for its historical investments, nor will the newcomer obtain any advantage from having avoided such a burden of history, as would have been the case if an average, attributional approach had been followed. Instead, the consequential approach will give credit for any supplier that makes an environmental improvement, no matter how good or bad his current situation. This may raise the concern that such an approach will not give any incentive to the older factory to improve the more polluting parts of its current production equipment, since the factory is anyway judged only on the basis of its new installations. However, the older factory may actively utilise its larger improvement potential by linking investments in new capacity to improvements in its older production lines. Any company may in fact make such linking (cross-subsidising) of two separate productions; it is not necessary that the two production lines be inside the same company, as long as the link is binding and verifiable (e.g. contractual). To be credible, the existence of such links should preferably be verified by an independent third party. An example of such linking, although with a different objective, namely to avoid that the premium from the sales of a “green” product cross-subsidises other less environmentally preferable productions, is that of naturemade-Star electricity: This label explicitly requires that the additional income from the premium on the labelled electricity is used to increase the environmentally preferable electricity production from renewable sources and to improve the environmental performance of the existing power plants (http://www.naturemade.org/d/zertifizierung/). Specifically for hydropower, the label requires (according to Frischknecht 2001) that the additional revenue, about 0.03 EUR per kWh, from selling labelled electricity, is used for (percentages from one specific utility, as example only):
4.4 Market trendsWithin the identified market, not all potential suppliers/technologies will actually be affected by a change in demand. For short-term changes (see also section 4.2), the affected suppliers will typically be the least competitive (often using older technology), since it is mostly these suppliers that have capacity available. For long-term changes, the affected suppliers depend on the overall market trend. In a market that decreases (at a higher pace than what can be covered by the decrease from regular, planned phasing out of capital equipment) the affected suppliers will typically be the least competitive. If the market is generally increasing (or decreasing at a rate less than the average replacement rate for the capital equipment), new capacity must be installed, typically involving a modern, competitive technology. Therefore, it is important to identify the market trend (“Is the market increasing or decreasing?”) especially for long-term changes involving capacity adjustments. It follows from the above distinction, that if the general market volume is decreasing at about the average replacement rate for the capital equipment, the effect of a change may shift back and forth between suppliers with very different technologies, which makes it necessary to make two separate scenarios. This may be relevant for a fairly large interval of trends in market volume, since the replacement rate for capital equipment is a relatively flexible parameter (planned decommissioning may be postponed for some time, e.g. by increasing maintenance). In general, the replacement rate for production equipment is determined as the inverse of the estimated lifetime of the equipment. Note that it is the overall market trend, which is of interest, and not the direction of the specific demand studied. This is because - as long as the overall trend in the market is not affected – it is the same suppliers that will be affected by an increase in demand and a decrease in demand.
Example: Market trends are typically obtained by combining statistical data showing the past and current development of the market and different forecasts and scenarios (see also chapter 6). Sector forecasts are typically available from national and supranational authorities, while more product specific forecasts are available from industrial organisations. As a default, when information on market trends is not available, an increasing market may be assumed, since this is – in spite of obvious exceptions - the general situation for most products, due to the general increase in population and wealth. 4.5 Production constraintsAs already discussed in section 2.2, a supplier or an entire technology can be constrained in its ability to change its production volume in response to a change in demand, for one or more of the following reasons:
See section 2.2 and 4.8 for examples. The situation of a declining market, see section 4.4, can be regarded as a constraint on modern technology, since new capacity is not being installed, limiting competition to those suppliers already present. As any other market condition, production constraints may change: As a default, in case of missing information on production constraints, we recommend to assume that there are none. Unjustified exclusion of processes is thereby avoided. If a constrained process is thereby included, this will normally be discovered in the next step in the procedure (see section 4.6). If all suppliers to a specific market segment are constrained, or if one or more production factors are not fully elastic, a change in demand will lead to a change in market price and a consequent adjustment in demand (i.e. a behavioural change). This adjustment will be accommodated by the customer(s)/application(s) most sensitive to changes in price, measured in terms of their demand elasticity (i.e. their relative change in demand in response to a change in price). This change must then be followed forward (downstream) in this lifecycle. 4.6 Suppliers/technologie s most sensitive to changeAmong the unconstrained suppliers/technologies, some will be more sensitive to a change in demand than others. As already discussed in section 4.4, the most sensitive supplier/technology depends on the temporal horizon (short-term/long-term) and the current market trend. For long-term changes in an increasing market, the most sensitive supplier/technology is identical to the most competitive, while in a rapidly decreasing market and for short-term changes, the most sensitive supplier/technology is the least competitive. Competitiveness is typically determined by the production costs per unit. For capacity adjustments it is the expected production costs over long-term that matters. The distinction between constraints (section 4.5) and costs is not completely sharp, since some constraints may be translated into additional costs and some costs may be regarded as prohibitive and therefore in practice function as constraints. However, if not taken too strictly, the distinction is useful for practical decision-making. Also the definition of costs itself is not sharp, since concerns for flexibility (as a concern for future costs), environmental costs and other externalities – whether monetarised or not - may enter the decision-making process. When predicting the actual decisions with regard to changes in capacity or capacity utilisation, it is therefore necessary to include all those constraints and non-monetarised costs which are relevant to the decision makers, but on the other hand not such which are not going to influence the actual decisions. The kind of costs included may also vary depending on the interests of the decision makers, e.g. private investors may place less emphasis on environmental externalities than a public investor (Frischknecht 1998). Thus, the most sensitive suppliers/technologies are determined from the production costs, while taking into account constraints and non-monetarised costs as perceived by those who decide about the change in capacity (long-term) or capacity utilisation (short-term). The important point is to model as closely as possible the actual decision making context. As a default, when data cannot be obtained, it may be assumed that modern technology is the most competitive and the oldest applied technology is the least competitive. With respect to geographical location, it can be assumed that competitiveness is determined by the cost structure of the most important production factor (labour costs for labour intensive products, else energy and raw material costs). When comparing labour costs, local differences in productivity and labour skills should be taken into account. 4.7 Environmental product declarations13As a specific application of environmental data from the product chain (life cycle data), there is some ambiguity in the way Environmental Product Declarations (EPDs) are viewed by the public and by experts in the field of labelling and declarations. On the one hand, EPDs are seen as declarations of the past environmental impact that the declared product has had up till the point of purchase, and sometimes including the expected use and disposal phases, but not specifically intended to indicate the expected environmental consequences of buying the declared product, in parallel to a declaration of contents, which does not indicate the expected composition of tomorrows product. On the other hand, EPDs are seen as a means for the customer to influence the environmental impacts of the purchased products, which exactly places a requirement on the EPD that it reflects the expected environmental consequences of buying the declared product compared to not buying it. These two views on EPDs are not necessarily in conflict, since in some cases the environmental impacts from buying an additional unit of a product may be expected to be identical to the past environmental impacts caused by a unit of the same product. Intuitively, this expectation appears justified, since one would expect that buying an additional unit of the declared product would lead to an equivalent increase in production of this product by its immediate supplier, and in the long term an increase in the production capacity in the current supply chain. In many cases this may in fact be the case, and a declaration based on data from the current supply chain can then be regarded as both useful for the customer and beneficial for the environment. However, two conditions must be fulfilled for the expectation to be true, namely: In so far as these two conditions are not fulfilled, the inclusion of data from the current supply chain into the EPD may be seen as deceptive, as they may mislead the customer as to what are the actual consequences of the purchase. A few examples will illustrate the need for requiring the two conditions to be fulfilled before including data from the current supply chain into EPDs. Also, possible ways of avoiding misleading declarations are discussed in the following. In Europe, some sources of electricity, notably hydropower and nuclear power, are subject to either physical or political constraints on their capacity. This implies that the production capacity cannot increase as a result of an increase in demand. An EPD based on current data for these sources of electricity will therefore obviously be an attribution of past environmental impacts rather than a reflection of the consequences of an additional demand. Therefore, such an EPD should be issued with an appropriate warning that it should not be applied in a comparison with EPDs of other sources of electricity in the context of a purchase decision aiming at choosing the electricity source leading to the lowest environmental impact. In spite of this, there are examples of EPDs of hydropower presented to the public without such warnings, in a way that could lead the customer to think that they reflect the environmental consequences of buying the declared electricity. One such example is the EPD of hydro power electricity from the Lule river (SEMC 1999), which is published without any warnings on the limitations of its applicability, and even on a web-site where you can find statements such as: “Environmentally sound procurement is probably one of the most important applications of EPD‘s” and similar statements (http://www.environdec.com/eng/summary/key_issues.asp, latest visited 2001.08.15). Although not explicitly placed as an information for purchase decisions, e.g. in the context of increasing a customers purchase of “green electricity,” it still appears misleading to present the declarations without a specific warning that they should not be used for comparisons with other equivalent products. The Swiss naturemade-star label described at the end of section 4.3 demonstrates that there are other options available. Besides physical and political constraints as in the above electricity example, constraints may also be found in relation to co-products, and the use of allocation procedures (as opposed to system expansion, see chapter 5) may therefore lead to similar misleading results as the ones shown in the above case. In fact, capacity constraints on specific raw materials or technologies are such a widespread feature in most supply chains, that the two above conditions are seldom fulfilled for all parts of a product chain. This means that in most cases where EPDs are based exclusively on data from the current supply chain, there is a risk that the declarations may be misleading14. In Europe, the market for ammonia is declining, mainly due to political constraints on the use of nitrogen fertiliser for environmental reasons (see section 4.8). The variations in environmental impacts of ammonia production may be illustrated by the differences in energy consumption per ton of ammonia between a modern combined plant in Western Europe, at 29 GJ/ton (EFMA 2000), and an old plant in Eastern Europe producing at 48 GJ/ton (Patyk & Reinhardt 1997). Considering an EPD on a nitrogen fertiliser produced on the basis of supplies from the modern plant, the inclusion of environmental data from this immediate supplier would not reflect the environmental consequences of buying the declared product. Since the market is declining, no new capacity is being installed, and the purchase of the declared product therefore does not lead to increase in production capacity for this environmentally preferable product, but rather to postponing the decommissioning of an old plant with poor environmental performance. In fact, the declining market may be seen as a special kind of the constraints on increases in production capacity that we encountered in the electricity example. Thus, to bring the declaration in accordance with reality, i.e. to reflect the consequences of the purchase of additional nitrogen fertiliser, the EPD would have to include the environmental data for the old Eastern European plants that would actually be affected by the purchase decision. To avoid this situation, there is another option for the producer of nitrogen fertiliser: To bring the reality in accordance with the declaration. This could be done by creating a separate market for “green” ammonia, i.e. ammonia from modern plants with low energy consumption, etc. If the producer of nitrogen fertiliser placed a requirement on the ammonia supplier(s) to increase the production capacity in proportion to the sale of declared ammonia (somewhat in parallel to the promotional model described above for electricity), the consequences would be that decommissioning of old plants in Eastern Europe would be speeded up, and the declared ammonia would now really be produced on a modern plant, the data for which could then be safely used in the EPD In conclusion, there are three ways to avoid the problem of misleading EPDs due to system boundary choices:
It should be noted that the background for an EPD based on market-based modelling might be more difficult to communicate to the consumer, since the market-based product system is less intuitively (physically) connected to the product. For example, the overall volume of milk production being constrained by quotas (as is the case in Europe) means that a purchase of 1 litre of milk does not lead to more production of milk, but to less sales of milk for the least profitable application (typically milk powder). Thus, a market-based EPD would not include the agricultural production, since this cannot be changed by the purchase of the declared product. Nevertheless, the consumer may wonder: “This litre of milk I have in my hand must have come out of a cow. Why is the cow not part of the life cycle?” It may be difficult to communicate that buying the milk just means that someone else will not be able to buy it, but that its production remains unchanged. This is further complicated by the fact that the consumer may actually influence the agricultural production even when the overall production volume is constrained, namely by buying ecolabelled (ecological) milk. Such a purchase will (eventually) lead to more production of ecological milk and less production of non-ecolabelled milk for milk powder, which means that a market-based EPD of ecological milk would include the difference between the ecological and non-ecological agricultural production. 4.8 Examples of the identification of affected processesWe have applied the above procedure to a number of products, to show the different variations and to demonstrate the practicability of the procedure. The procedure has been applied in different degrees of detail, thus also reflecting that the same degree of detail is not always necessary. The degree of detail required in a specific study will depend on the importance of the specific process in that study and the degree of difference between the possible processes. It can be seen from the examples that the affected suppliers/technologies are often very different from the corresponding average supplying the market. Thus, only in exceptional cases can average data be used as proxy data, when market-based data are not available. This may e.g. be the case when the market in question is supplied exclusively by one main, slowly developing technology. In most other situations, it is preferable to make one or more estimates of the affected process, based on the available data. If you have data for a market average, the market range may be estimated (see Weidema et al. 2003b) and the affected process can then be assumed to be at one of the ends of this range, depending on realistic assumptions with respect to the items listed in table 4.1. When relevant, several alternative scenarios should be included to reflect the limits of knowledge. The examples provided below are listed in increasing order after their NACE-code. References are provided for each step in the procedure. Unless otherwise stated, the identification is valid for small (marginal), long-term changes in the years 2000-2010. Some examples have been worked out in 1998 and have not been updated since, although more recent data than cited is likely to be available at the time of print. In general, the examples should be used with care, as they are intended primarily to illustrate the principles of the procedure, not as final conclusions or default data. When applicable, specific data for modern technologies in Europe may be available in the form of reference documents from the European IPPC Bureau (http://eippcb.jrc.es). Agricultural crops in general (NACE 01.1) Fodder protein (NACE 01.11)
Market ties:- Fodder energy (NACE 01.11)
Market ties:- Meat (NACE 01.2)
Market ties:- Wood for fuel (NACE 02.01)
Market ties:- Wood for pulp (NACE 02.01)
Market ties:- Crude oil (NACE 11.1)
Market ties:- Aluminium (NACE 13.2) Market ties:- Copper (NACE 13.2) Market ties:- Cadmium, Mercury, Lead (NACE 13.2)
Market ties:- Vegetable fat (NACE 15.4) Market ties:- Dairy products (NACE 15.5)
Market ties: Suppliers are often bound by contract to a specific dairy. Wood and products of wood (NACE 20)
Market ties:- Pulp, paper, board (NACE 21.2)
Market ties:- Propylene (NACE 23.2)
Market ties:- Ethylene (NACE 23.2)
Market ties:- Chlorine (NACE 24.13) Market ties:- Chlorine (NACE 24.13)
Market ties:- Sodium hydroxide (NACE 24.13)
Market ties:- Ammonia (NACE 24.15)
Market ties:- Fertiliser, in general (NACE 24.15)
Market ties:- Rubber (NACE 25.1) Market ties:- Bricks (NACE 26.4)
Market ties:- Cement clinker (NACE 26.5) Market ties:- Cement (NACE 26.5) Market ties:- Steel (NACE 27.1)
Market ties:- Geographical market: Europe Despite an increasing global trend, the European production of steel is stagnating, however not below the replacement rate of capital equipment. Production constraints: Electric Arc Furnace technology constrained by availability of its main raw material (steel scrap). Grid electricity (NACE 40.1)
Market ties:- The calculation is most sensitive for the fuel costs, where the gas price may be set too high in the above calculations. Furthermore, due to the lower capital costs required, gas fired plants may also be the preferred technology under periods of high interest rates and insecurity. The current deregulation also favors technologies with low investment costs, as has been seen after the deregulation in the U.K. (DTI 1998). Furthermore gas fired plants better fulfil the requirements of the electricity networks for ability to adjust output quickly on a minute-to-minute basis (Dienhart et al. 1999). Therefore, it may be recommended to apply gas-fired technology in a sensitivity analysis. Grid electricity (NACE 40.1) Market ties:- Grid electricity (NACE 40.1) Market ties:-
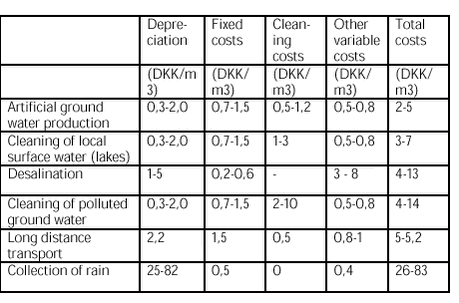
Water supply (NACE 41.00) Market ties: Drinking water is supplied through a regional water supply. In Copenhagen, the extraction of groundwater is politically controlled by the counties, but within this constraint, the Copenhagen Water Supply choose between a variety of technologies. Data on depreciation are provided by a private drilling-firm and the statistics of the Danish Water Works Association (VandSchmidt 1998, Danske Vandværkers Forening 1997). Fixed costs, cleaning and other variable costs are estimated from a technical report on ground water valuation and personal communication with employees at the Copenhagen Water Supply (COWIconsult 1995, Passow 1998, Als 1998). Cleaning of surface water costs 1-2 DKr, while the costs for cleaning polluted ground water can vary considerably depending on the actual quality. These data are from Kemp & Lauritsen (1995) and two local water works (Regnemark Waterworks 1998, Gentofte Waterworks 1998). Artificial production of ground water through infiltration gives additional costs for irrigation and land use. Data on infiltration costs for artificial ground water production is supplied from the pilot plant of the Copenhagen Water Supply and the Technical University of Denmark (Gardasson et al. 1997). Desalination costs are estimated on basis of Ribeiro (1996). If water is to be transported from water works in other geographical regions, there will be additional costs for construction and maintenance of a pipeline and costs for pumping. These costs can vary considerably depending on the nature of the subsoil, the needed capacity and the slope of the distance. Construction costs alone can vary from a mere 140 DKK/meter to 13.000 DKK/meter. Data here are based upon an internal calculations performed by the Water Supply of Copenhagen to assess the possibility of supplying water to Copenhagen from a distance of approximately 100 km from a Swedish lake (Lund 1993) with standard costs for maintenance (COWIconsult 1995) and operating costs roughly estimated by Sydvatten (1998). The cost of collecting rainwater from roofs is estimated by Albrechtsen et al. (1998). Most of the investment for collection of rain is for changing the piping, and the cost depends very much on the type of house. An alternative to changing the pipes is to filter and clean the rainwater, but the cost for this is estimated to be higher, mostly because of control-costs. Waste treatment (NACE 90.00) Market ties:- ____________________________________________________________
|