|
The indoor and outdoor concentrations of particulate air-pollution and PAHs in different size fractions and assessment of exposure and health impacts in the Copenhagen population 4 PAHs in indoor and outdoor air
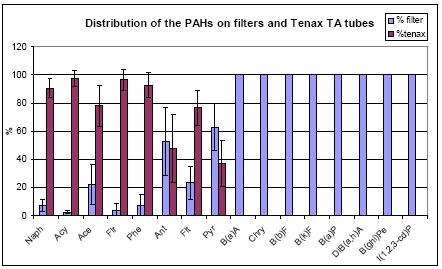
4.1 Evaluation and description of PAH-concentrationsThe mean indoor, outdoor and urban background PM1, PM2.5 and PMinh concentrations of 16 EPA (Environmental Protection Agency, USA) priority PAHs are shown in Table 4.1 to Table 4.3. The tables contain data on PAHs in both the gas and particle phase and individual results are listed in Appendix F. The air concentrations are based on the concentrations measured in the extracts of the filters and Tenax TA above and below the defined instrumental limits of detection (LDs) except concentrations termed as "not detected" (n.d.) (see Appendix E). LDs are essentially a function of the uncertainty of the analysis and in this report we consider values below the LDs as an indication of a larger uncertainty and not as "not detected". 4.1.1 Distribution of PAHs on the glass fibre filters and Tenax TAPAHs in the air are distributed between the gas phase and the particulate phase depending on the physico/chemical properties of the particles and the individual PAHs, respectively (see e.g. ). When sampled the particles are collected on the filter and the PAHs escaping as gasses from the filter are collected on the Tenax TA sample tube downstream the filter. PAHs that are not trapped by the Tenax TA sample tube are colleted on the Tenax TA backup tube downstream the sample tube. During sampling, PAHs in the gas phase may be trapped by the filter and PAHs originally contained in the particles may be volatilised and trapped by the Tenax TA. Thus concentrations estimated from analysis of the filter and the Tenax TA are not exact the concentrations in the particle and gas phases, respectively. However, the lower the vapour pressure of the PAHs the larger are the fraction in the particle phase and the lower are the tendency to escape from the filter during sampling as illustrated in Figure 4.1. This effect is usually observed when semi-volatile organic compounds (SVOCs) are sampled with filter/adsorbent samplers. For example linear alkanes with 18-20 carbon atoms were trapped on both filter and adsorbent and alkanes with more than 20 carbon atoms were on the filter exclusively . PM1 and PMinh PAH concentrations in Tables F 1 and F 3 (Appendix F) and Table 4.1 and Table 4.3 are based on analysis of filters only since no Tanax TA tubes were used for these samplings. The PM2.5 concentrations for the 8 first PAHs (the most volatile) listed in Table F 2 and Table 4.2 are the sums of the concentrations estimated from analysis of the filter, the Tenax TA sample tube, and the Tenax TA backup tube. The PM2.5 concentrations for the 8 last PAHs (the least volatile) listed in Table F 2 and Table 4.2 are estimated from analysis of the filters only owing to strong interference from unknown compounds in the Tenax TA extracts. However, this introduces probably an insignificant error due to the high fraction of these PAHs in the particle phase and their low volatility from the filter. This assumption is supported by the observation that the fraction of Flt, Pyr, B(a)A, and Chry in the particle phase in tobacco smoke has been estimated to 0.38, 0.18, 0.99, and 0.97, respectively, using denuder technique . Thus, as an advantage this makes the concentrations of the last 8 PAHs listed in Tables F 1 – F 3 and Table 4.1 to Table 4.3 directly comparable. Acenaphtylene also interfered with unknown compounds in the Tenax TA extracts during the HPLC analysis and were treated as described in Appendix B in the section "Data treatment". In spite of that, the acenaphtylene data probably still suffered from positive bias and were omitted from the statistical analysis.
Figure 4.1: The observed average distribution of PAHs sampled on PM2.5 filters and Tenax TA tubes downstream the filters. The error bars are 95% confidence intervals. See Appendix C for abbreviations of the PAH names. The fraction of the 8 least volatile PAHs on the filters have all been set to 100% since the Tenax TA data was rejected due to interference. 4.1.2 Artifacts influencing the measured concentrations of PAHsIn addition to the above-mentioned artifacts, sampling and analysis of PAHs is influenced by several effects that may lead to underestimation of the air concentrations . Among those are the extraction recovery from filters and Tenax TA that were 60 – 100% for the PAHs (see Appendix D). During sampling PAHs broke through from the Tenax TA sample tubes to the backup tubes depending on the volatility of the individual PAHs but were less than 15% on average for all PAHs (see Table D1 in Appendix D). When found on the backup tube an unknown amount of the PAH may have broken through the backup tube, too. During sampling PAHs are also degraded by ozone and nitrogen oxides . Schauer et al. (2003) found that the PAHs collected on the filter may be underestimated by a factor of 2 or more due to reaction with ozone and that the degradation was important for the variability of the results. During the sampling campaigns at Jagtvej ozone was present most of the time at concentrations up to ca. 50 ppb outdoors and below ca. 5 ppb indoors . 4.1.3 Occurrence of the measured PAHsIn the PM2.5 samples the total concentrations of the 8 most volatile PAHs of the 16 EPA priority PAHs (ΣlowPAH) in the gas plus particle phases (shown in Table F 2) were 15-284 ng/m3 indoors, 46-232 ng/m3 outdoors, and 1-105 ng/m3 in the urban background air. The total concentrations in the PM2.5 samples of the 8 least volatile PAHs of the 16 EPA priority PAHs (ΣhighPAH shown in Table F 2) were 0.1-3.7 ng/m3 indoors, 0.3-3.9 ng/m3 outdoors, and 0.1-1.2 ng/m3 in the urban background air. The total concentrations in the PM1 samples of the 8 least volatile PAHs (ΣhighPAH shown in Table F 1) were 0.1-2.3 ng/m3 indoors, 0.1-3.5 ng/m3 outdoors, and 0.2-1.6 ng/m3 in the urban background air. The total concentrations in the PMinh samples of the 8 least volatile PAHs (ΣhighPAH shown in Table F 3) were 0.1-1.7 ng/m3 indoors, 0.3-3.1 ng/m3 outdoors, and 0.1-3.0 ng/m3 in the urban background air. Table 4.1: Mean concentrations and standard deviations () based on all measurements of the 8 least volatile PAHs in PM1 (ng/m3).
Table 4.2: Mean concentrations (gas + particle) and standard deviations () based on all measurements of the 16 PAHs in PM2.5 (ng/m3).
£ Given as minimum detection limit value if detected by GC-MS due to interference in HPLC analysis Table 4.3: Mean concentrations standard deviations () based on all measurements of the 8 least volatile PAHs in PMinh (ng/m3).
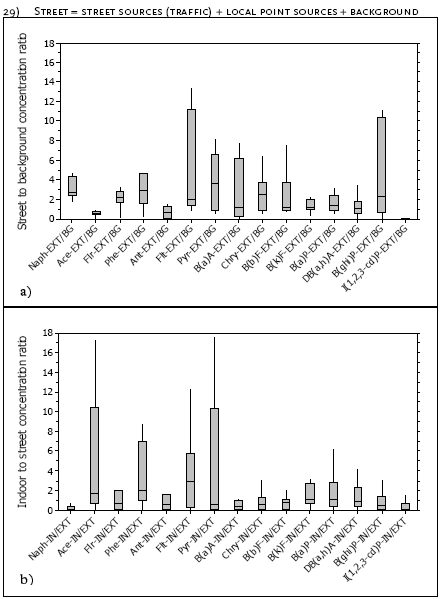
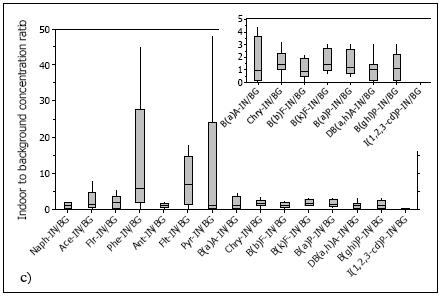
The average PM2.5 concentration profiles of the 16 PAHs for the indoor, outdoor, and urban background measurements are shown in Figure 4.2 and shows that the most volatile PAHs are the most abundant in both the indoor, outdoor, and urban background environments. Figure 4.2 also shows the average PM1 and PMinh concentration profiles of the 8 least volatile PAHs for the indoor, outdoor, and urban background measurements. These profiles indicate that largely the same levels of PAH concentrations were measured in the different particle fractions. This further indicates that the major part of the least volatile PAHs is associated with the PM1 fraction, because the PM1 mass concentrations were much smaller than the mass concentrations of both PM2.5 and PMinh (see Tables 3.1 to 3.3). Figure 4.2: Arithmetic mean concentrations and 95% confidence limits (at two scales) of all PM2.5 measurements of the 16 PAHs in the gas plus particle phase and the mean concentrations of the all PM1 and PMinh measurements of the 8 least volatile PAHs in the indoor, outdoor and background air samples. See Appendix C for abbreviations of the PAH names. Acenaphtylene (Acy) was somewhat overestimated due to interference (see Appendix D, "Data treatment"). 4.2 Indoor-outdoor relationships for PAHs associated with PM2.5The relationships between specific PAHs associated with PM2.5 (gas + particle phases) were assessed using concentration ratios and regression analysis based on the measurements of PAHs indoors in the 4th floor apartment at Jagtvej, outdoors in the Jagtvej street-canyon, and in the urban background. 4.2.1 Street to background relationshipsFigure 4.3: Figure 4.3a shows that the PAH concentrations outdoors at Jagtvej often are notably higher than those found in the urban background. The major part of the street-to-background ratios are above 2. However, the uncertainty of the ratios is very large in most cases due to the large variability of the data. If it is assumed that the street and background air are well mixed in the street, that no local point sources influence the background measurements but that point sources may influence the street measurements the following equation can be formed: 29) Street = street sources (traffic) + local point sources + background
Figure 4.3: Boxplots of the concentration ratios of the PM2.5 PAHs in the gas plus particle phase between the a) street and urban background (EXT/BG), b) the indoor air and the street (IN/EXT), c) and the indoor air and the urban background (IN/BG). The boxplots show the median, upper and lower interquartile range, and the 95% confidence limits. The experimental data shown in Figure 4.3a support this model since the street concentrations of all PAHs are generally higher than that observed in the urban background, except for Ace and Ant with median EXT/BG (street-to background) ratios of 0.460 and 0.625, respectively. If it is assumed that local point sources have no influence this suggests that traffic contributes significantly to the concentration of most PAHs in the street canyon. Median street to background ratios above 2 were observed for Naph, Flr, Phe, Flt, Pyr, Chry, and B(ghi)P. Additionally, the large interquartile ranges observed for B(a)A and B(b)F suggests that these PAHs at least episodically are also influenced from high emissions in the Jagtvej street canyon. Indoor-outdoor relationships in Figure 4.3b and c show boxplots of the I/O concentration ratios for each of the 16 PAHs and Figure 4.4 and Figure 4.5 show scatter plots of the indoor PM2.5 concentrations versus the outdoor concentrations at Jagtvej of the most and least volatile PAHs, respectively. The percentage of I/O ratios above one for Jagtvej outdoors and urban background were 56% and 75%, respectively. The I/O ratios typically show the same trend for Naph, Flr, Ant and the series Pyr to I(1,2,3,cd)P independent of whether the street or urban background concentrations were used for comparison. However, for Pyr to I(1,2,3,cd)P, median IN/BG ratios were generally higher (1.03 -1.42) than the median IN/EXT ratios (0.29-1.03). Except for Pyr, regression analysis showed significant (p 0.05) to near significant (p ≤0.15) relationships between indoor and street or background concentrations for these compounds (see Table 4.4 and Table 4.5). Depending on the wind direction more or less background air may be infiltrated to the apartment from the backside of the house. If it is assumed that the street and/or background and indoor air are well mixed indoors the following equation can be formed: 30) Indoor = indoor sources + P(Wstreet·street + Wbackside·background) Where Wstreet and Wbackground are wind dependent factors and P is a penetration factor. Penetration factors are in the range 0 < P < 1 and are usually approximately 0.5. When the street to background concentration ratios are close to one and have small variation the wind factor is not important and the equation can be simplified to: 31) Indoor = indoor sources + P street, when EXT/BG ~ 1 Indoor sources may vary a lot independent of the street concentrations and thus correlations of indoor and street air may result in large positive or negative intercepts and negative slopes. However, for PAHs with indoor to street ratios close to one and a small variation, indoor sources are probably not important and the equation can be further simplified: 32) Indoor = P street, when EXT/BG ~ 1 and IN/EXT ~ 1 Thus, a correlation of indoor and street PAHs fulfilling these criteria based on the box plots in Figure 4.3b and c should have a positive slope smaller than 1 and an intercept close to zero if the PAHs from the street and/or background air infiltrate to the indoor air. Table 4.4 shows that for PAHs approximately fulfilling the criteria B(b)F, B(k)F, B(a)P, and DB(a,h)A have significant (p < 0.05) or near significant (p < 0.15) Figure 4.4: Scatter plots, regression lines, and the 1:1 lines showing the relationship between the PM2.5 concentrations of the most volatile PAHs indoors versus outdoors in the Jagtvej street canyon. indoor to street correlations. B(a)P and DB(a,h)A have slopes greater than one indicating that these PAHs also have important indoor sources. The same tendency is shown in Table 4.5 for the indoor to background correlations. The significant correlations indicate that these PAHs are infiltrated from the outdoor air. Considering indoor sources, the median I/O ratios for Ace, Phe, Flt and Pyr are notably above 1 (1.36-6.72) compared to both street and urban background concentrations. This suggests strong episodical influence of these compounds from indoor sources. Figure 4.5: Scatter plots, regression lines, and 1:1 lines showing the relationship between the PM2.5 concentrations of the least volatile PAHs indoors versus outdoors in the Jagtvej Street Canyon. 4.2.3 The contribution from traffic to PAHs in the indoor airThe influence of traffic on the indoor air-pollution of specific PAHs associated with PM2.5 (gas + particle phases) was assessed by regression analysis based on the measurements of PAHs indoors in the 4th floor apartment at Jagtvej and outdoors in the Jagtvej street-canyon. Harrison et al. state that B(ghi)P and coronene in diesel emissions and gasoline emissions are similar, but diesel emissions are probably enriched in B(b)F and B(k)F relative to gasoline emissions. In the present study Table 4.4: Linear regression statistics of PAHs in the indoor air versus in the Jagtvej street canyon. P-values in boLD are significant at 5% and p-values in boLD italics are significant at 15%.
£ Not applicable, because only "not detected" data exist *Number of observations including measurements with zero concentrations Table 4.5: Linear regression statistics of PAHs in the indoor air versus in the urban background. P-values in boLD are significant at 5% and p-values in boLD italics are significant at 15%.
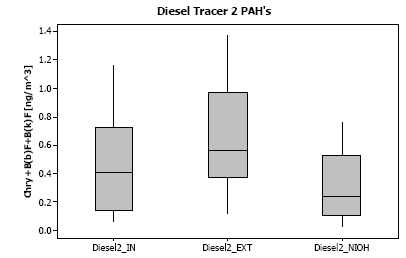
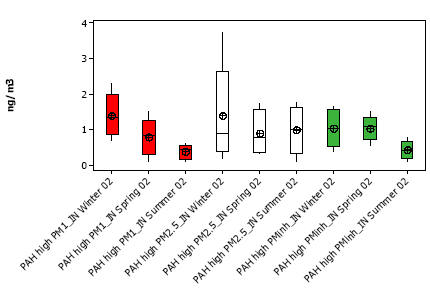
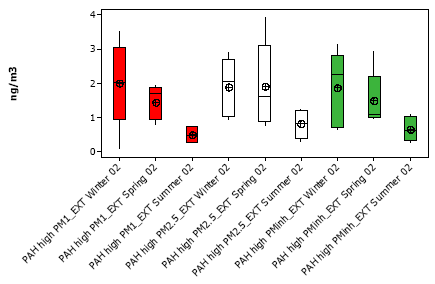
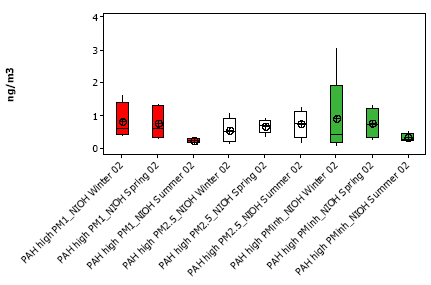
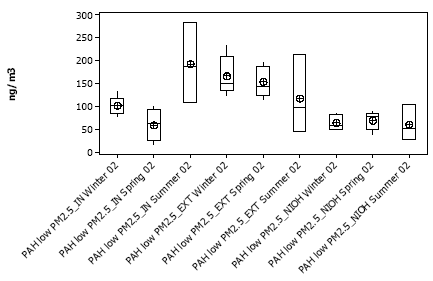
£ Not applicable, because only "not detected" data exist *Number of observations including measurements with zero concentrations another traffic marker was established using Chry + B(b)F + B(k)F (called Diesel2). Figure 4.6 shows that the concentration of this marker was highest in the street and lowest in the background air. Regression analysis using the traffic marker (B(b)F + B(k)F + B(ghi)P) showed a strong I/O relationship using street data (traffic IN = 0.56·traffic_EXT + 0.17 [ng/m3]; p = 0.056), but not when compared to urban background data (p=0.703). The Diesel2 marker shows also a good relationship between outdoor and indoor air at Jagtvej: Diesel2_IN = 0.47·Diesel2_EXT + 0.17 (p = 0.052; n=13). The relationship between the Diesel2 marker in the urban background air and the street air at Jagtvej show poor regression statistics with p-values above 0.467. This suggests that traffic emissions in the street air have greater direct influence on the PAHs in the apartment than the similar PAHs in the urban background air. 4.3 Seasonal variation of the PAH concentrationsThe collected data allows an evaluation of the seasonal variation of the ΣPAH concentrations indoors and outdoors at Jagtvej and in the urban background air. To ensure comparison between the size-fractions, for all seasons, the summer season was calculated based on four weeks only, omitting the urban background data from the May 23-29, 2002 (see Tables F1 – F3, Appendix F). The seasonal variation in ΣhighPAH concentrations associated with the PM air-pollution is plotted for each site in Figure 4.7 to Figure 4.9. At all three sites and size fractions, the main trend was highest concentrations in the winter followed by spring and the lowest concentrations in the summer. This indicates that domestic heating during winter and to some extent during spring is an important source of PAHs indoors and outdoors in the street and urban background air.
Figure 4.6: Box plot showing the upper and lower quartile of the indoor, outdoor and urban background concentrations of marker Diesel2 (Chry+B(b)F+B(k)F) measured during winter, spring and summer 2002. The seasonal variation of the ΣlowPAH concentrations associated with the PM2.5 air-pollution is plotted in Figure 4.10 for all sites. There appear not to be a clear trend in these data except for a larger variation during summer at all three sites. 4.4 Health effect evaluation based on the PAH measurementsThe EU-EPA has recently enforced a yearly average target value of 1 ng B(a)P per m3 in PM10 starting in 2004 as proposed earlier this year . The average B(a)P concentrations for indoor, outdoor and urban background found in this study (≤0.12 ng/m3) were well below that target value at all sites (see Table 4.1 to Table 4.3 and Figure 4.11). The WorLD Health Organization (WHO) has established a unit risk value of 8.7 10-5 per ng/m3 B(a)P for life-time cancer risk . The WHO unit risk value suggests that ~10 cancer cases per 106 inhabitants may occur at a lifetime exposure to the PAH-concentrations observed in the apartment. For comparison, 8 and 5 cases per 106 inhabitants are expected from the street and urban background concentrations, respectively. The higher indoor B(a)P cancer risk reflects the potential influence of indoor sources on cancer risk. – Despite the apartment was uninhabited and the influence of indoor sources was reduced to the inevitable minimum effects from neighboring apartments. However, because all PAHs contribute to carcinogenic risk, the indoor cancer risk indoors may be even higher than indicated by the B(a)P unit risk value. This is mainly due to the relatively high
Figure 4.7: Seasonal variation of ΣhighPAH associated with indoor PM at Jagtvej
Figure 4.8: Seasonal variation of ΣhighPAH associated with outdoor PM at Jagtvej
Figure 4.9: Seasonal variation of ΣhighPAH associated with PM in the urban background air indoor concentration volatile PAHs, especially the relatively potent Flt (see Figure 4.2). Hence, in true environments, the cancer risk in indoor environments may be notably higher than estimated from both street and urban background concentrations. However, it should be noted, that the study was conducted at 4th floor height. Street level PAH-exposures are expected to be higher still.
Figure 4.10: Seasonal variation of ΣlowPAH associated with PM2.5 in the indoor, outdoor, and urban background air. Figure 4.11: Benzo[a]pyrene concentrations for each sampling week in the indoor, outdoor, and urban background air. Compared to a previous B(a)P life-time cancer risk assessment conducted by Nielsen et al. (1995), this study found much lower cancer risk estimates of 5-10 cases per 106 Copenhagen inhabitants. Nielsen et al. (1995) estimated 126 and 396 excess cancer cases per 106 Copenhagen inhabitants at a lifetime exposure to 1992-1994 background and street concentrations, respectively. The lower values in the current study is a result of a dramatic decrease in PAH air-pollution since the early nineties. The cancer risk estimate reported here is also relatively low as compared to the Relative Risk estimate (RR = 1.130.09) established for lung-cancer associated with PM2.5 by Pope et al. (2002). This on one hand suggests that the WHO B(a)P unit risk alone cannot not explain the number of cancer incidents observed in epidemiological studies. Even bearing in mind, that sampling artefacts imply that the actual concentrations may be a factor of two times higher. High concentrations of volatile PAHs and the presence of other carcinogenic compounds such as nitro-PAHs, benzene, inorganic compounds and effects induced by particles alone also play an important role in the development of cancer. Similar conclusion was reached by e.g., Larsen and Larsen (1998). Naturally, these circumstances is not covered by the B(a)P unit risk factor. On the other hand, it may be difficult to make direct comparison between current air-pollution levels and observed cancer incidents as cancer is the result of long-term exposure. The current low PAH concentrations compared to the PAH concentrations a decade ago does therefore not reflect the current frequency of air pollution induced lung cancer.
|
||||||||||||||||||||||||||||||||||||||||||||||||||||||||||||||||||||||||||||||||||||||||||||||||||||||||||||||||||||||||||||||||||||||||||||||||||||||||||||||||||||||||||||||||||||||||||||||||||||||||||||||||||||||||||||||||||||||||||||||||||||||||||||||||||||||||||||||||||||||||||||||||||||||||||||||||||||||||||||||||||||||||||||||||||||||||||||||||||||||||||||||||||||||||||||||||||||||||||||||||||||||||||||||||||||||||||||||||||||||||||||||||||||||||||||||||||||||||||||||||||||||||||||||||||||||||
