Environmental Project No. 1274 2009
Development of an analysis method to determine peroxides in or released from tooth-whitening/dental-bleaching products.
Contents
- Development of a catalase bioassay for the determination of peroxide
- Need for an improved method to determine active substances in tooth-whitening products
- Establishment of a protocol for the determination of peroxides using an enzymatic bioassay
- Main conclusions
- Project results - protocol to determine free or bound hydrogen peroxide in tooth-whitening agents
- 2.1 Chemical analysis of peroxide in tooth-whitening products
- 2.2 Analysis of peroxide using catalase bioassay
3 Development and testing of catalase bioassay to determine peroxides
- 3.1 Technical design of measuring chamber, probe and data collection
- 3.2 Determination of the optimal conditions for the catalase bioassay
- 3.3 Testing of the catalase bioassay on peroxides in pure form
5 Assessment of results and conclusion
Anex 1: Technical specifications of the oxygen probe.
Annex 2: Measuring equipment used
Annex 3: Test of the catalase bioassay on tooth-whitening products, curves
Annex 4: Data from titrations and catalase bioassay
Annex 5: Draft Japanese Industrial Standard for tooth-whitening agents.
Foreword
The project "Development of an analysis method to determine peroxides in or released from tooth-whitening/dental-bleaching products" was carried out in the period 1 December 2006 to 31 December 2007.
This report is a description of the results of the project.
The purpose of the project was to develop a new analysis method for determining the peroxide content in tooth-whitening products.
The project was conducted by the National Environmental Research Institute (NERI), University of Aarhus, Department of Environmental Chemistry and Microbiology. The project representatives from NERI were Svend J. Binnerup and Niels Kroer. Members of the project group also included Suresh C. Rastogi and Margit M. Fernqvist.
Margit M. Fernqvist was responsible for laboratory analyses.
The following monitoring group was linked to the project:
- Dorrit Skals, Danish EPA (chairman)
- Elisabeth Paludan, Danish EPA
- Flemming Hovgaard Jørgensen, Danish EPA
- Magnus Løfstedt, Danish EPA.
Summary and conclusions
- Development of a catalase bioassay for the determination of peroxide
- Need for an improved method to determine active substances in tooth-whitening products
- Establishment of a protocol for the determination of peroxides using an enzymatic bioassay
- Main conclusions
- Project results - protocol to determine free or bound hydrogen peroxide in tooth-whitening agents
Development of a catalase bioassay for the determination of peroxide
This project developed a catalase bioassay for the determination of the content of peroxide in tooth-whitening products. The catalase bioassay converts peroxide into oxygen, which is then measured with a probe.
The catalase bioassay was tested on pure peroxides (hydrogen peroxide, urea peroxide, calcium peroxide, sodium perborate and sodium percarbonate), all of which are active substances in tooth-whitening products, as well as on a number of different tooth-whitening products on the Danish market.
The newly developed catalase bioassay was moreover compared to chemical analysis methods. It was concluded that the catalase bioassay has some advantages over the chemical methods.
The project was conducted by the National Environmental Research Institute (NERI), University of Aarhus, Department of Environmental Chemistry and Microbiology.
Need for an improved method to determine active substances in tooth-whitening products
In Denmark today it is possible to buy tooth-whitening agents over the counter. This means there is an increased need to be able to monitor this product type. Almost all tooth-whitening agents contain peroxide as an active substance; either as free hydrogen peroxide or bound to other substances. Some products contain several different peroxide compounds and this is a problem in traditional analytical methods which, typically, can only analyse one substance at a time. Furthermore, there are problems associated with analysing peroxide bound to other substances, as many factors may influence the release of peroxide.
The purpose of this project was to develop and validate a new method of analysis to determine the overall content of peroxides in tooth-whitening agents - irrespective of whether the peroxide is free, bound or appears together with other peroxide compounds.
Establishment of a protocol for the determination of peroxides using an enzymatic bioassay
The newly develop catalase bioassay involves enzymatic conversion of hydrogen peroxide to water and oxygen in an analysis chamber, while continuously measuring changes in oxygen concentrations. In an aqueous solution, hydrogen peroxide will split into oxygen and water spontaneously, but the process is very slow. Adding catalase increases the rate of reaction significantly.
The project involved the design and development of an oxygen measurement and regulator system, which basically consists of a closed chamber and a galvanic oxygen probe for the continuous measurement of oxygen released.
Method development was carried out on six different pure chemicals in order to identify the range of and the optimal conditions for the method. Based on this, a protocol was established, which was subsequently used in the analysis of seven different tooth-whitening products.
Main conclusions
- The catalase bioassay can be used as an effective and accurate method to determine the overall content of peroxide in tooth-whitening products.
- The lower detection limit for peroxides measured with the catalyse bioassay is 0.0006% urea peroxide, corresponding to 0.0002% hydrogen peroxide.
- The catalase bioassay is useful for the measurement of hydrogen peroxide, urea peroxide, calcium peroxide, sodium perborate and sodium percarbonate.
- Data from the catalase bioassay correspond well to traditional redox titrations.
- In contrast to traditional redox titrations, the catalase bioassay is not affected by any reducing or oxidising chemicals in the products.
- Determination of peroxide in tooth-whitening agents through use of the catalase bioassay is quick and easy.
- The catalase bioassay is robust, simple, quick and has good reproducibility and accuracy (coefficient of variation < 2%).
- The catalase bioassay is suitable for use on tooth-whitening products with hydrogen peroxide as the active substance, no matter whether the peroxide is present as free hydrogen peroxide or bound in releasers.
- Products containing several different active substances may be tested.
- It is probable that the catalyse bioassay developed may also be suitable for use on other product types containing hydrogen peroxide in free or bound state.
Project results - protocol to determine free or bound hydrogen peroxide in tooth-whitening agents
Based on a number of trial runs using the catalase bioassay, a protocol was described. The protocol is outlined in the following:
In cooperation with Loligo-systems (Tjele), a sealed measuring chamber (approx. 100 ml) was constructed fitted with an oxygen probe, and with inlet ports for the injection of sample material. The chamber is filled with a room-temperature phosphate buffer (pH=7) outgassed with nitrogen, and is sealed with an acrylic lid. Catalase (5,000 units dissolved in 40 µl 50 mM phosphate buffer) and a sample quantity that, as a maximum, can result in the creation of oxygen corresponding to 80% of the buffer’s oxygen saturation are injected through the inlet ports. Changes in oxygen concentrations are measured continuously and when the signal is stable a reading is made and subsequently converted to the peroxide content in the sample. Under the conditions described, reading can be performed after 5 minutes. The assay is run at a constant temperature, set at 22 °C in the protocol, and during stirring in the measuring chamber.
1 Introduction
Peroxides in different chemical forms are present in almost all products for whitening teeth, either alone or in combination. Tooth-whitening products can contain free hydrogen peroxide or peroxides bonded to other substances (releasers), which are released during the treatment as free H2O2 (1). Urea peroxide, perborates and percarbonates are examples of H2O2 releasers present in tooth-whitening products. The peroxides exist in a dissolved state in different matrices, depending on whether the tooth-whitening products are applied as a gel or are painted or sprayed onto the teeth.
In order to regulate retail sales of tooth-whitening agents, analytical routines are required to control the content of peroxides in products. Different chemical methods for measuring peroxides exist today. These include redox titration e.g. with iodine or permanganate salts (2,3). Since all substances that can be oxidised will be titrated in a redox titration with iodine or permanganate, this method can only be used to determine H2O2 in tooth-whitening products, if no other oxidative substances are present in the product. Interference from such substances could possibly be avoided by measuring free H2O2 using spectrophotometric methods (4). The concentration of free H2O2can also be measured with biosensors. Biosensors containing the H2O2-degrading catalase enzyme have been used for the determination of H2O2 in antiseptics and in cosmetics, including tooth-whitening agents (5-7).
Tooth-whitening products that contain H2O2 releasers (e.g. urea peroxide) release H2O2 slowly. Therefore, the total content of bound H2O2 in these products can only be determined either by theoretical calculation, by measuring the H2O2 releaser directly, or by measuring the total H2O2 released. This report gives a short overview of the different peroxides which have been reported to be present in tooth-whitening agents. The products tested were either bought in a shop or over the internet. All the products contained either free hydrogen peroxide or urea peroxide. The other peroxides mentioned and tested in pure state are found in products prescribed by dentists. This report describes a new protocol for the measurement of peroxides in tooth-whitening products, whether these are added as free H2O2 or as one or more releasers, possibly in combination. The protocol uses a catalase bioassay, which converts the free hydrogen peroxide to oxygen and water continuously, while the changes in oxygen concentrations are used to calculate the overall amount of peroxide in the product. The accuracy and applicability of the method are compared to chemical methods to determine peroxides.
2 Analysis of peroxides
- 2.1 Chemical analysis of peroxide in tooth-whitening products
- 2.2 Analysis of peroxide using catalase bioassay
2.1 Chemical analysis of peroxide in tooth-whitening products
Tooth-whitening agents can contain the active substance hydrogen peroxide either in a free state or bound in one or more releasers. Several tooth-whitening products contain the releasers urea peroxide or calcium peroxide, which creates a chemical equilibrium with free hydrogen peroxide (the active substance). The methods for determination of hydrogen peroxide used so far are based primarily on chemical redox titrations or colorimetric methods. A draft proposal for the establishment of a Japanese Industrial Standard for tooth-whitening products (Annex 5) includes e.g. a potassium permanganate titration method for hydrogen peroxide determination, whereas urea peroxide is determined using sodium thiosulfate titration. Some products contain mixtures of different forms of peroxides, which, potentially, require their own separate chemical analysis.
2.2 Analysis of peroxide using catalase bioassay
The newly developed method to determine the peroxide content in tooth-whitening products involves enzymatic conversion of hydrogen peroxide (CAS no. 7722-84-1) to water and oxygen while continuously measuring the oxygen released. In an aqueous solution, hydrogen peroxide will spontaneously split into oxygen and water, but the process is very slow. If catalase is present, however, the rate of reaction is increased significantly.
The reaction is as follows:
| Hydrogen peroxide | Catalase | Water | Oxygen | |
| 2H2O2 | → | 2H2O + O2 | (1) | |
In cases where the catalase bioassay is to be used for the determination of the peroxide content in products that contain peroxide in a bound state, a chemical equilibrium will exist between the bound and the free hydrogen peroxide. In cases where, for instance, urea peroxide (CAS no. 124-43-6) is contained in the product, the equilibrium between urea peroxide and the free hydrogen peroxide is as follows:
| 2 CO(NH2)2·H2O2 | ↔ | 2 CO(NH2)2 + 2 H2O2 | (2) |
The released hydrogen peroxide is cleaved by the catalase into water and oxygen according to formula (1) above, shifting the equilibrium towards the right. For the remaining releasers tested in this report, an outline of their chemical equilibrium as a result of the release of hydrogen peroxide is given below.
The solubility of calcium peroxide (CAS no. 1305-79-9) is highly dependent on pH, as is the equilibrium created according to the reaction below:
| CaO2 + 2H+ | ↔ | Ca2+(aq) + H2O2 | (3) |
Sodium perborate monohydrate (CAS no. 10332-33-9) is a dimer that is bonded together by genuine peroxygen bonds. In an aqueous solution at pH7, hydrogen peroxide and sodium borate are created and the following equilibrium is created:
| NaBO3·H2O + H2O | → | Na+ + BO33- + H2O2 +2H+ | (4) |
Sodium percarbonate (CAS no. 15630-89-4) is highly water soluble and when dissolved in water releases carbonate and hydrogen peroxide according to the following reaction:
| [Na2CO3]2 · 3H2O2 | → | 2 Na2CO3 + 3H2O2 | (5) |
In products containing one or more releasers, the assay will promote the conversion of the bound fraction of peroxides to free hydrogen peroxide. In this way, determination of the total quantity of hydrogen peroxide in the product is achieved. Catalase (CAS no. 9001-05-2) can be purchased in a purified form, e.g. from Sigma-Aldrich. The enzyme is naturally present intracellularly in all aerobically respirating organisms, where its function is to break down the reactive oxygen radicals created as a by-product of the respiratory process.
The content of peroxides in tooth-whitening products is usually stated as a percentage of weight. That is, in a tooth-whitening agent which contains, for instance, urea peroxide, the hydrogen peroxide represents only about 35% of the weight of the molecule. The bleaching effect of a product containing e.g. 18% urea peroxide will therefore approximately correspond to a product containing about 6% hydrogen peroxide. Similar differences in bleaching effect will apply for the remaining releasers.
3 Development and testing of catalase bioassay to determine peroxides
- 3.1 Technical design of measuring chamber, probe and data collection
- 3.2 Determination of the optimal conditions for the catalase bioassay
- 3.3 Testing of the catalase bioassay on peroxides in pure form
As a part of the project a measuring chamber was constructed, which was subjected to a series of tests for tightness and measuring stability. Subsequently,
- the optimal quantity of active substance (peroxide) was determined;
- the optimal quantity of enzyme was determined;
- the appropriate reaction rate was mapped;
- the optimal pH was identified.
A protocol for the measurement of peroxides in tooth-whitening products was suggested on the basis of this test series. This protocol was subsequently tested on different tooth-whitening products purchased on the Danish retail market.
3.1 Technical design of measuring chamber, probe and data collection
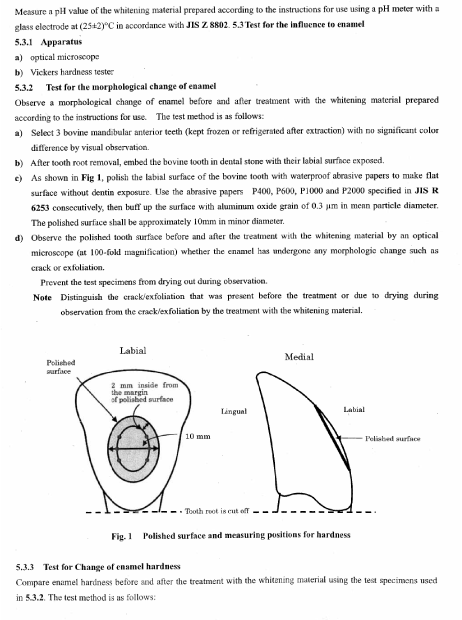
An oxygen measurement and regulator system was used, designed and developed in cooperation with Loligo Systems, Tjele, Denmark. The system consists of a glass reaction chamber with a known volume (103-107.5 ml) and an acrylic lid fitted with an oxygen probe and two small ports (0.92 mm in diameter) for the injection of test material. Inside the measuring chamber is a glass-coated magnet, which, when rotated (1,000 rpm) ensures uniform mixture of all the components during the reaction and oxygen measurement.
Figure 1: Set-up for catalase bioassay
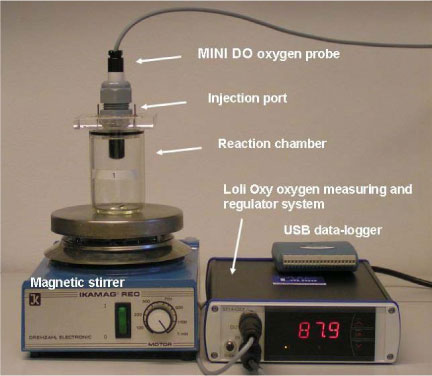
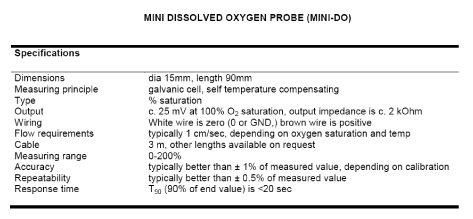
Oxygen measurements are performed by a galvanic oxygen probe (MINI-DO, Oxyguard, Birkerød, Denmark). According to the specifications the probe has a maximum measurement uncertainty of +/- 1% of the measured value. Data is collected every second using a data logger (from Measurement Computing, MA, USA) and transferred to a Windows-based software (TracerDAQ.
Specifications for the probe are included in Annex 1 and an order overview from Loligo Systems is in Annex 2.
3.1.1 Test set-up
Before measuring commences, the glass chamber is filled with autoclaved phosphate buffer (pH = 7) purged with nitrogen, after which the acrylic lid with the oxygen probe is mounted. Removal of oxygen in the buffer by nitrogen gassing ensures that the changes in oxygen concentrations can be monitored without bubbles forming due to over saturation in the chamber. The buffer is sterilised using autoclaving, while the equipment is sterilised with alcohol in order to prevent biological oxygen consumption during the run from affecting the measurements. Catalase (Sigma-Aldrich, cat. no. C100) is now added in a known quantity. In all of the tests, about 5,000 units of catalase were added to the test chamber (1 unit degrades 1 µmol H2O2 per minute at 25°C). Immediately prior to analysis, a known quantity of peroxide or tooth-whitening agent is added. Since the solubility of oxygen in a liquid is temperature-dependent, all measurements were carried out at the same temperature (22°C) in an air-conditioned room. Four replicate test chambers were used for the tests. The final calculations include adjustments for the small variations in chamber volume.
3.1.2 Testing of the stability of the probe
Prior to a measuring run, a two-point calibration of the probe is made with 0% oxygen saturation (solution of sodium sulfite) and 100% oxygen saturation (buffer bubbled with oxygen) as the two extreme points. A comparison of probe outputs measured in volts (V) in independent calibrations conducted over a 20-day period demonstrated great probe stability, as the deviation was less than 1% of the average value (Table 1).
Table 1. Stability of the oxygen probe tested by measuring output (volts) at 0 and 100% oxygen saturation (n = 20).
| Probe output | ||
| Oxygen saturation, % | Average (V) | Coefficient of variation (%) |
| 0 | 0.9913 | 0.3026 |
| 100 | 4.9511 | 0.4726 |
3.1.3 Testing of the tightness of the reaction chamber
In order to prevent the loss of oxygen during measuring, and correspondingly, to prevent air from entering the reaction chamber, the reaction chamber and the probe must comprise a tightly sealed unit.
To demonstrate the system’s tightness, a number of tests were conducted in which the chamber was assembled with 75, 22 and 1.5% oxygen-saturated water, respectively, and the oxygen level was subsequently monitored over an 18-20-hour period (figure 2).
Figure 2: Reaction chamber tightness and consumption of oxygen
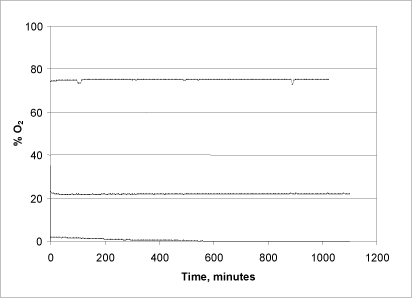
In the tests with the low concentration (1.5%), the oxygen level starts to drop fairly quickly after about two hours of reaction time, and in the course of 10 hours all of the oxygen has been consumed. This is probably due to microbial consumption of oxygen, as the measurement in this case was not conducted under sterile conditions. In the subsequent series of measurements (22% and 75%) and in all subsequent measurements, the liquid was sterilised and the chambers wiped off with alcohol beforehand to minimise this factor of uncertainty. As seen in Fig. 3, a stable oxygen level was maintained throughout the entire time of measuring, demonstrating the chambers’ tightness and, moreover, that the system does not itself consume a significant amount of oxygen during the measuring.
3.2 Determination of the optimal conditions for the catalase bioassay
The method was tested using either hydrogen peroxide and urea peroxide in known quantities or in pure forms. These two substances are the most commonly used peroxides in tooth-whitening products. The method was moreover tested on four pure substances, which are also used in tooth-whitening products, namely sodium perborate monohydrate, sodium perborate tetrahydrate and sodium percarbonate.
3.2.1 Testing the optimal measurement scope and lower detection limit of the method
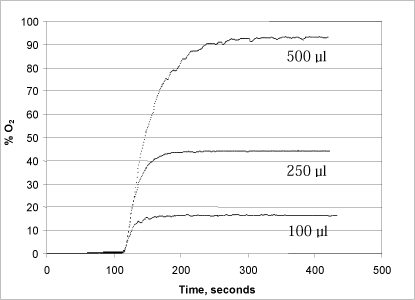
A series of tests were conducted with varying concentrations of both hydrogen peroxide (50, 150 and 170 µl of a 1% solution added to the reaction chamber) and urea peroxide (100, 250 and 500 µl of a 1% solution) in order to determine the method’s optimal measurement range (Figs. 3 and 4).
Figure 3: Changes in oxygen concentration in the reaction chamber after addition of 50, 150 and 170 µl, respectively, of a 1% hydrogen peroxide solution.
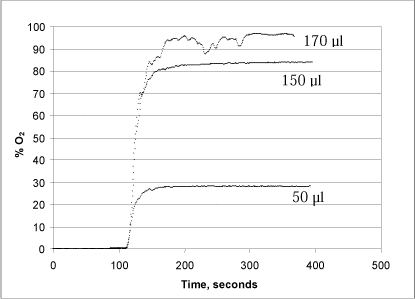
Figure 4: Changes in oxygen concentration in the reaction chamber after addition of 100, 250 and 500 µl, respectively, of a 1% urea peroxide solution.
When catalase is added after 110 sec., oxygen is rapidly released because the enzyme splits the hydrogen peroxide (Fig. 3). When using 5,000 units of catalase, the hydrogen peroxide is converted into oxygen and water in less than 1½ minutes, which results in an oxygen saturation of 28.1%, 83.9% and 96.4% in the glass chamber, respectively. Note that addition of 170 µl hydrogen peroxide results in an unstable signal, probably due to the formation of bubbles on the surface of the probe. The formation of bubbles is presumably because the equilibrium between dissolved and free oxygen cannot be maintained during the extreme, momentary reaction and oxygen release. Since the method requires the oxygen to remain dissolved in the liquid, it is important to take this into account, for instance by aiming for a test design in which the quantity of oxygen released corresponds to less than 80% of the oxygen saturation. Alternatively, a smaller quantity of enzyme can be added, whereby the reaction will run more slowly.
Addition of urea peroxide (Fig. 4) resulted in a somewhat slower development of oxygen, presumably because the peroxide is bound in a urea complex, from where it is continuously released during the enzymatic degradation of the free peroxide (Fig. 4). Thus it takes up to five minutes (to convert the added urea peroxide, dependent on the quantities added. Here, the problem of an unstable signal when the release of oxygen is high is less significant, probably because the release takes place over a longer period of time. As can be seen in Fig. 4, there is direct proportionality between the quantity of urea peroxide added and the development of oxygen.
A comparison between Figs. 3 and 4 reveals a generally lower signal when analysing urea peroxide. This is because hydrogen peroxide makes up only about 35% of the weight of the urea peroxide molecule. In other words, the quantity of oxygen that can be released from urea peroxide solution is only about 35% of the quantity of oxygen that can be released from a hydrogen peroxide solution in the same concentration.
3.2.1.1 Assessing the lower detection limit for the catalase bioassay
According to Danish legislation on cosmetics (Annex 3 of Statutory Order no. 422 of 4 May 2006) the highest concentration of hydrogen peroxide allowed in oral-care products is 0.1%, either present in the product or released during use.
The catalase bioassay is very sensitive, and it is possible to measure the precise quantity of peroxide in a sample, when oxygen development is kept between 1 and 80% of the chamber’s oxygen saturation.
On the basis of the tooth-whitening products tested (section 4), it was determined that a maximum of 10 grams of a product can be dissolved in the reaction chamber (100 ml). Since urea peroxide contains the lowest quantity of peroxide (% by weight), this substance was used as the basis of an assessment of the lower detection limit.
As shown in Fig. 4, addition of 100 µl of 1% urea peroxide to the reaction chamber will result in an oxygen development in the reaction chamber corresponding to 17.5% of the chamber’s oxygen. Addition of 100 µl of 0.1% urea peroxide will therefore result in approximately 1.75% of the chamber’s oxygen saturation.
If 10 grams (~10,000 µl) of a tooth-whitening product are added with a content of 0.1% urea peroxide, this, in turn, will result in 175% of the chamber’s oxygen saturation. An accurate result can however be achieved with an oxygen saturation in the reaction chamber as low as 1%, which would correspond to adding 10 grams of a tooth-whitening product with a content of 0.00057% urea peroxide.
For measurements of tooth-whitening products, the lower detection limit for the catalase bioassay is therefore 0.0006% urea peroxide, corresponding to 0.0002% hydrogen peroxide.
3.2.2 Testing of the stability of the catalase
The stability of the catalase, its pH sensitivity and reactivity were analysed in a series of tests. In the first test, peroxide and catalase were added repeatedly to the same reaction chamber (figure 5).
Figure 5: Repeated addition of H2O2 and urea peroxide to the reaction chamber. Starting from the left hand side, arrows 1+2 point to where 5,000 units of catalase were added. Arrow 3 points to where 100 µl 1% urea peroxide were added, whereas arrow 4 shows where 50 µl 1% hydrogen peroxide were added. Arrow 5 shows where the test stopped and the probe was transferred to an out-gassed phosphate buffer.
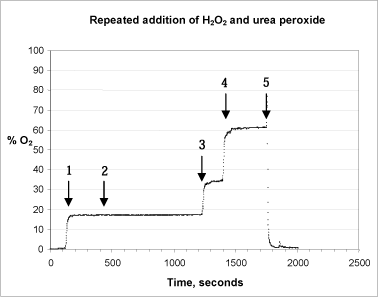
In the test 100 µl 1% urea peroxide were added from the start. When the catalase is added, (arrow 1, Fig. 5) the reaction proceeds exactly as expected, the signal stabilising within 1 minute. When more catalase is added (arrow 2) the signal remains stable. This shows that the first reaction has proceeded to the end and that an adequate initial quantity of active enzyme was added to the system. When 100 µl 1% urea peroxide (arrows 3 + 4) are added, the level of oxygen rises immediately as expected. This shows that the quantity of enzyme added is still active. After 9 min. (1,750 sec.), there is a marked change in the signal when the probe is removed from the test chamber and transferred to the out-gassed buffer solution, after which the signal stabilises once more at about 1.5% oxygen saturation
3.2.2.1 Testing of varying concentrations of catalase
Increasing concentrations of catalase, increases the speed at which the peroxide is split into oxygen and water but has no bearing on the determination of the content of peroxide (Fig. 6).
Figure 6: Effect of increasing concentrations of catalase on the reaction rate. 50 (1); 100 (2); 500 (3); 1,250 (4); 5,000 (5); and 10,000 (6) units of catalase were added.
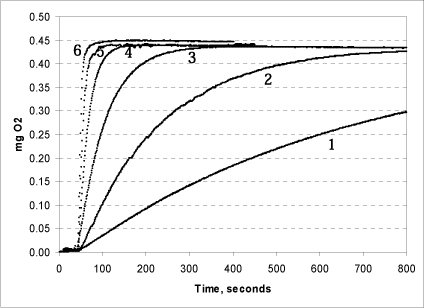
The tests shown in Fig. 6 were conducted in triplicate at pH 7. The same quantity (250 µl) 1% urea peroxide was added in all tests. When 10,000 units of catalase are added, the reaction is immediate and all of the peroxide is split in less than half a minute. If less catalase is added, the rate of the reaction drops. When 1,250 units of catalase are added, all of the peroxide is split within 1½ minutes. Even at very low concentrations of catalase in the chamber, however, the reaction concludes within 60 minutes, and, as expected, the final oxygen production is the same in all of the tests. The same was seen for hydrogen peroxide (data not shown). Based on this data, it is recommended that 5,000 units are added per reaction.
3.2.2.2 The shelf life of the catalase
Catalase (CAS no. 9001-05-2) is purchased in aqueous solution at a concentration around 1,379,400 units/ml. A stock solution of 140,000 units/ml was prepared by dilution in 50 mM phosphate buffer. In an attempt to examine the shelf life of the catalase, a stock solution was divided in two parts, of which one was stored in a refrigerator at 4°C, while the other was stored at around 20°C (room temperature). After 0, 1, 2, 3, 7, and 50 days, a standard test was set up at pH7. Catalase (5,000 units) was added to the chamber as well as 100 µl hydrogen peroxide (1%), corresponding to a theoretical oxygen development of 0.5377 mg.
Table 2: Assessment of the shelf life of the catalase in a solution at 4 °C and 20 °C.
| Time Day (24 hrs) |
Storage temp. °C |
O2 produced mg |
| 0 | 20 | 0.5299 |
| 1 | 4 | 0.5158 |
| 1 | 20 | 0.5255 |
| 2 | 4 | 0.5256 |
| 2 | 20 | 0.5277 |
| 3 | 4 | 0.5212 |
| 7 | 4 | 0.5341 |
| 7 | 20 | 0.5349 |
| 50 | 20 | 0.5350 |
The shelf life of the solution when stored at 4°C and 20°C is very long. As can be seen from Table 2, the catalase’s activity after 50 days storage at 20°C remained at the same level as just after the solution was prepared. Furthermore, the reaction rate was not affected by the long storage time (data not shown).
3.2.2.3 Effects of pH on the activity of the catalase
The release of peroxide from the releaser calcium oxide is pH-dependent. It is therefore relevant to test the method’s sensitivity to changes in pH. The pH optimum for catalase is around 7, which corresponds to the physiological pH in most cells. Deviations in pH may lead to changes in the configuration of the enzyme, reducing the activity of the enzyme.
Figure 7: The efficiency of the catalase at pH 4, 6, 7 and 10.
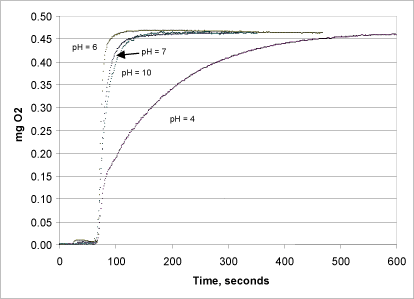
The pH dependency of the catalase was examined in a series of tests using buffer solutions of varying pH (4-10, Fig. 7) in the reaction chamber. All of the tests were conducted in triplicate, and the pH in the chamber was measured both before and after the reaction.
Using a buffer at pH values varying from 4-10 affected the reaction kinetics, however not the oxygen level measured at the end of the reaction (Fig. 7). The reaction was fastest at pH 6, where all of the peroxide was converted to oxygen within half a minute. At pH 7 and pH 10, the reaction rate was lowered by a factor of about three. At pH 4, the activity of the enzyme dropped drastically and the reaction was not complete until after about 10 minutes.
3.3 Testing of the catalase bioassay on peroxides in pure form
The catalase bioassay was tested on different peroxides in order to confirm a relationship between the peroxide content expected and that measured in the solutions used. Furthermore, the reproducibility of the method was tested in a series of independent experiments to describe its accuracy when used on the respective peroxides.
3.3.1 Hydrogen and urea peroxide
The catalase bioassay was applied to a number of different concentrations of hydrogen and urea peroxide in pure form, where the results were either compared to the expected quantity according to the product specifications (urea peroxide), or to the quantity found from KMnO4 titration (hydrogen peroxide). The latter was required with the hydrogen peroxide because the substance is unstable when stored and therefore the manufacturer’s statement of content is uncertain. In all the measurements, the probe signal was read 300 seconds (5 minutes) after adding the catalase.
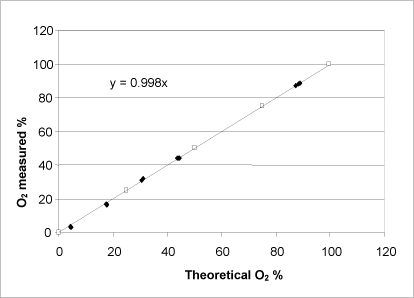
Figure 8: Relationship between the potential oxygen release calculated on the basis of a KMnO4titration (unshaded symbols) and determined by adding a varying quantity of H2O2 to the catalase bioassay (shaded symbols). Both axes show the percentage of oxygen saturation in the buffer at the reaction’s completion.
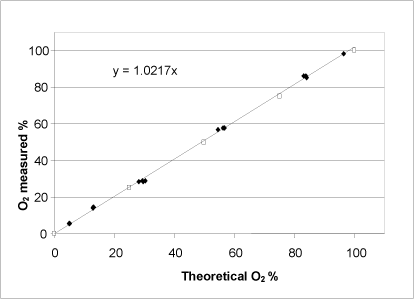
For hydrogen peroxide, a linear relationship between the expected oxygen development calculated on the basis of a redox titration, and the oxygen development determined using the catalase bioassay was observed (Fig. 8). Thus, the catalase bioassay can be applied to hydrogen peroxide determination within the entire measurement interval, which is defined by the oxygen saturation of the buffer. According to the product specifications, the concentration of the hydrogen peroxide purchased was stated to be 30%. The KMnO4titration determined the concentration to be 34.4% with a standard deviation of 0.2 (n=4), whereas the catalase bioassay determined the concentration to be 33.6% with a standard deviation of 0.7 (n=14).
Figure 9: Relationship between the theoretically possible oxygen release calculated on the basis of the manufacturer’s information about the purity of the substance (unshaded symbols) and determined by adding a varying quantity of urea peroxide to the catalase bioassay (shaded symbols). Both axes show the percentage of oxygen saturation in the buffer at the reaction’s completion.
Similar to hydrogen peroxide, urea peroxide showed a linear correlation between the measured and the theoretically possible oxygen development calculated on the basis of the quantity of substance added (Fig. 9). Therefore, it can be concluded that the bound peroxide is released from the urea peroxide and that it is cleaved by the catalase enzyme within the measurement period in question. The manufacturer stated the concentration of urea peroxide to be 97%, whereas the catalase bioassay determined it to be 97.4% with a standard deviation of 0.9 (n=12). On the basis of KMnO4 and S2O3 titrations, the content of urea peroxide was determined to be 95.83% with a standard deviation of 0.4 (n=3) and 99.17% with a standard deviation of 0.3 (n=3), respectively, which deviates somewhat from the manufacturer’s specifications and the result determined by the catalase bioassay.
3.3.2 Calcium peroxide
At physiological pH (pH=7), calcium peroxide has a very low solubility in water (<0.01% at 20°C), and calcium peroxide reacts differently with water at different pH values. The solubility of calcium peroxide increases as the pH value drops, and during the production of free hydrogen peroxide. The quantity of hydrogen peroxide being produced depends entirely on the pH value.
In order to determine the optimal pH value when analysing products containing calcium peroxide, a series of tests in which the pH value was set at various values from 4-10 were carried out. One mg of calcium peroxide dissolved in water was added in each test. According to the manufacturer (Sigma, MA, USA), the calcium peroxide has a purity of 75%. Thus 1 mg calcium peroxide will be able to release a maximum of 0.16647 mg O2. The recovery percentage was then calculated using the following formula:
mg O2 produced/ 0.16647 mg) x 100 = recovery (%)
The release of oxygen was found by conducting a reading of the oxygen produced after 10 minutes, as the signal was still not stable after 5 minutes. All tests were conducted in repetitions of 3-6, and the pH in the reaction chamber was measured both before and after the test.
Figure 10: Relationship between oxygen production (as a percentage of the maximum possible) from calcium peroxide and pH.
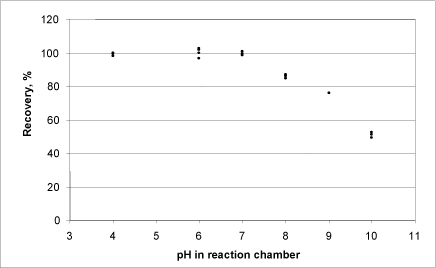
At a high pH value, the production of oxygen from calcium peroxide was lower than at around 6-7 (Fig. 10).
Calcium peroxide requires a low pH value (an acidic environment) to dissolve in water. In order to test whether the pH in the calcium peroxide solution that is added to the reaction chamber is of significance to the results of the analysis, 1 mg of calcium peroxide dissolved in water (pH=11.2) and in a H2SO4 solution with a pH value of 2.0 was added. The pH value in the measuring chamber itself was kept at 7.0 using the phosphate buffer.
Figure 11: Correspondence between reaction rate and pH in the calcium peroxide stock solution.
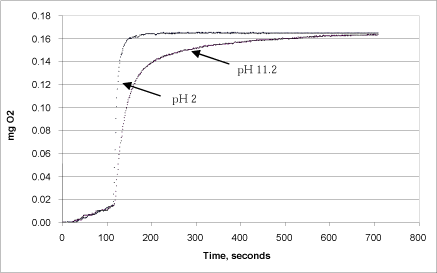
Fig. 11 shows that the reaction rate was highest when calcium peroxide was added after it had been dissolved in an H2SO4 solution of pH 2. Here, the development of oxygen took places immediately upon addition of catalase, and the reaction proceeded to an end within one minute. If calcium peroxide in water at pH 11.2 was injected instead, the reaction rate was slower, but it ended at the same level after 10 minutes. This difference is due partly to the fact that the calcium peroxide at low pH had already released the total pool of peroxide, and partly because the addition of calcium peroxide in undissolved form slowed down the speed at with which hydrogen peroxide was released to the liquid phase.
3.3.3 Sodium perborates and sodium percarbonate
Traditionally, sodium perborate monohydrate, NaBO3H2O (CAS no. 10332-33-9) and sodium perborate tetrahydrate, NaBO34H2O (CAS no. 10486-00-7) have been used as bleaching agents in washing powder. In recent years, sodium perborate has also been used in tooth-whitening agents. In contrast to products containing hydrogen peroxide and urea peroxide, in Denmark sodium perborates are only found in products used by dentists. The hydrogen peroxide releaser, sodium percarbonate, is not yet found in tooth-whitening products in use in Denmark (1, 8).
Peroxide release and oxygen development from the two sodium perborates and sodium percarbonate were tested. The two perborates differ from one another by having a differing amount of crystal water bound in them. Theoretically, sodium perborate monohydrate can release hydrogen peroxide corresponding to 34% of its molecular weight, whereas sodium perborate tetrahydrate releases hydrogen peroxide corresponding to 22% of its molecular weight. Sodium percarbonate can potentially release hydrogen peroxide corresponding to 28% of its molecular weight. These percentages are included in the calculation of the recovery percentage after the formation of oxygen in the catalase bioassay.
For all three substances, a series of tests were made with four repetitions. pH was adjusted to 7 and 100-250 µl of a 1% solution of the three substances were injected. The signal stabilised in all cases within about 2 minutes, the results were read after 5 minutes, and the oxygen quantity was used to calculate the recovery percentages (see table 3).
Table 3: Recovery – sodium perborates and sodium percarbonate.
| Chemical | Theoretical O2, mg |
Measured O2, mg |
Recovery, % |
Average | Standard deviation |
n |
| Sodium perborate monohydrate |
0.400 | 0.408 | 102.00 | 102.56 | 0.8260 | 4 |
| 0.400 | 0.414 | 103.50 | ||||
| 0.400 | 0.407 | 101.75 | ||||
| 0.400 | 0.412 | 103.00 | ||||
| Sodium perborate tetrahydrate |
0.259 | 0.270 | 104.17 | 104.07 | 1.4564 | 4 |
| 0.259 | 0.275 | 106.10 | ||||
| 0.259 | 0.267 | 103.01 | ||||
| 0.259 | 0.267 | 103.01 | ||||
| Sodium percarbonate | 0.143 | 0.143 | 100.00 | 100.03 | 0.9207 | 4 |
| 0.359 | 0.361 | 100.70 | ||||
| 0.359 | 0.361 | 100.70 | ||||
| 0.359 | 0.354 | 98.74 |
As can be seen from Table 3, there was a good correspondence between the theoretical and measured peroxide content with regard to sodium perborate monohydrate and sodium perborate tetrahydrate. The recovery percentages in all cases deviated by less than 1.5%.
3.3.4 Overview of recovery percentages and accuracy for the different peroxides measured in the catalase bioassay
The method developed was validated on a number of different peroxides in pure form (Table 4).
Table 4: Recovery percentages for pure peroxide compounds
| Active substances | Quantity added mg |
Recovery (%) | Standard deviation (%) |
n |
| Hydrogen peroxidea) | 0.25-1.0 | 100.18 | 1.5908 | 14 |
| Urea peroxide | 0.25-2.5 | 100.48 | 0.8915 | 12 |
| Calcium peroxide, pH 7 | 1.0 | 98.79 | 1.8686 | 8 |
| Sodium perborate, 1 H2O | 2.5 | 102.56 | 0.8260 | 4 |
| Sodium perborate, 4 H2O | 2.5 | 104.07 | 1.4564 | 4 |
| Sodium percarbonate | 1-2.5 | 100.03 | 0.9207 | 4 |
a): Recovery of hydrogen peroxide was calculated on the basis of the concentration in the stock solution found using KMnO4 titration.
The validation showed that for all substances tested there was very good correspondence between the theoretical and the measured oxygen development. The recovery percentages deviated in all cases by less than 1.9%, and this describes the method’s level of uncertainty under the analytical conditions chosen.
4 4 Tests on products
On the basis of the method development and the tests on the pure substances used in tooth-whitening products, a protocol for analysis of the peroxide content in tooth-whitening products was set up.
Based on the fact that the analysis uses a sealed analysis chamber of about 100 ml in accordance with the description in section 3.1, the following standard conditions can be established:
- The analysis is conducted at 22°C.
- The quantity of active substance (peroxide) in the sample is limited, so that the maximum oxygen development corresponds to 80% of the buffer’s oxygen saturation. This means (where the chamber volume is 100 ml and the temperature is 22°C) a maximum oxygen development of 0.88 mg O2.
- 5,000 units of catalase per reaction are used in order to ensure an adequate reaction rate.
- Results are read after 5 minutes (providing the signal is stable).
- pH in the reaction chamber is adjusted with a 50 mM phosphate buffer to 7.0.
A number of tooth-whitening products already on the market in Denmark were examined using this protocol.
The products involved in the validation represent:
- Different concentrations of peroxide
- Different contents of active substances
- Different formulations of the product
The procedure for measuring active substances in tooth-whitening agents includes two types of controls:
- Parallel determination on a pure substance in a known quantity
- Adding a pure substance in a known quantity as a spikeafter the reaction with the tooth-whitening agent has ended
A total of seven products were analysed in repetitions of at least 14:
Table 5: List of products tested (anonymised)
| Product | Product type | Content of active substance |
| A | Bleaching gel | 10 % urea peroxide |
| B | Bleaching gel | 22 % urea peroxide |
| C | Bleaching gel | 16 % urea peroxide |
| D | Bleaching gel | ?? % urea peroxide |
| E | Bleaching gel | ?? % hydrogen peroxide |
| F | Liquid | ?? % hydrogen peroxide |
| G | Bleaching gel | 6 % hydrogen peroxide |
The Danish Environmental Protection Agency has been provided with further information about the products, (such as retailer, product no., batch no. etc.).
In parallel with the catalase method, all the products were also analysed traditionally using redox titrations. All the products and the two pure substances, hydrogen peroxide and urea peroxide, were titrated with potassium permanganate, while the products containing urea peroxide were also titrated with sodium thiosulfate.
The results of both titrations and test of the catalase bioassay are shown in Table 6, along with the manufacturers’ specifications of contents. For three of the products, information on the quantity of active substance in the product was not available.
Table 6: Peroxide content in 17 tooth-whitening products as well as hydrogen peroxide and urea peroxide found from the two titration methods and the catalase bioassay, respectively.
| Product | Concentration (%) of active substance |
||||
| Name | Active sub- stance |
Concentration (%), as stated by the manufacturer |
KMnO4 titration | S2O3 titration | Catalase bioassay |
| A | Urea peroxide |
10 | 10.49 | 12.89 | 9.67 |
| B | Urea peroxide |
22 | 20.29 | 21.00 | 20.68 |
| C | Urea peroxide |
16 | 15.45 | 14.66 | 15.36 |
| D | Urea peroxide |
? | 11.65 | 22.80 | 10.41 |
| E First analysis |
Hydrogen peroxide | ? | 0 | - | 0 |
| E Second analysis |
Hydrogen peroxide | ? | 2.84 | - | 2.96 |
| F First analysis |
Hydrogen peroxide | ? | 0 | - | 0.037 |
| F Second analysis |
Hydrogen peroxide | ? | 1.90 | - | 2.04 |
| G | Hydrogen peroxide | 6 | 5.40 | - | 4.875 |
| Hydrogen peroxide, pure substance |
Hydrogen peroxide | approx. 30 | 34.39 | - | 33.579 |
| Urea peroxide, pure substance |
Urea peroxide |
approx. 97 | 95.83 | 99.173 | 97.47 |
In Annex 4, the data of Table 6 is shown with standard deviations.
In general, there was good correspondence between the concentrations found through titration and those found using the catalase bioassay. The deviations were particularly small between the concentrations found through KMnO4 titrations and the catalase bioassay.
Products “E” and “F” were analysed twice, as no hydrogen peroxide could be detected in product “E” by neither titration or by the catalase bioassay. Similarly, only an insignificant, small quantity of peroxide was found in product “F” using the catalase bioassay, while none could be detected by titration.
In order to determine whether this lack of peroxide content was due to a flaw in the assay or in the product, another set of products was purchased and analysed. This time around, peroxide was found in product “E” as well as “F” by both methods.
Determination of the peroxide concentration in the tooth-whitening products was conducted on several different sample concentrations using the catalase bioassay, and in at least 14 repetitions per product. Correspondingly, the assay was tested on the pure substances, hydrogen peroxide and urea peroxide, in a number of different concentrations.
The coefficient of variation for measurements of products using the catalase bioassay was 0.9 – 3%. Correspondingly, the variation for measurements of the pure, active substances was 0.9 – 1.9%. The redox titrations were conducted in repetitions of three on both products and pure substances. For the potassium permanganate titrations of the tooth-whitening products, the coefficient of variation was 0.4 – 2.4%. For the pure substances, the variation of the measurements was 0.4 – 1%. For the sodium thiosulfate titrations, the variation was very high for the products, namely 9.4 – 23.8%. However, the variation for sodium thiosulfate titration of urea peroxide in pure form was only 0.33%.
With regard to the tested products, the variation of (accuracy of) the catalase bioassay was therefore comparable to the variation of the chemical analysis based on potassium permanganate titration, while the catalase bioassay appeared more accurate than the sodium thiosulfate titrations.
With regard to the manufacturers’ specifications of the peroxide content in the products, the determinations of concentration using the catalase bioassay deviated by 3.3 – 5.9%. The concentrations found from potassium permanganate titration deviated from the manufacturers’ specifications by 3.4 – 7.7% and those from sodium thiosulfate titration by 4.6 – 28.9%. Therefore, the variability of the catalase bioassay was comparable to the variability of the potassium permanganate titration, while the variability of the sodium thiosulfate titration was higher.
Results of control experiments in which a known quantity of urea peroxide was added to the product assays are shown for all products in Annex 3, 3a-i. These confirm that the tooth-whitening products tested do not contain substances that inhibit the catalase activity. Hence, the catalase bioassay developed is suitable for the analysis of tooth-whitening products.
5 Assessment of results and conclusion
A new method and protocol for the analysis of peroxide content in tooth-whitening products was developed. The method is based on the measurement of changes in oxygen concentrations following enzymatic conversion of peroxide to oxygen and water. Compared to traditional analytical methods, based on titrations with permanganate and thiosulfate, the newly developed catalase bioassay is easy to conduct, and all peroxide compounds – irrespective of whether they are bound to different releasers – may be measured at once. The peroxide contents found in the tooth-whitening products correspond well with the product specifications.
Results of method development and product analysis can be summarised as follows:
- Determination of peroxide content in tooth-whitening products through use of catalase bioassay is quick and easy.
- The catalase bioassay is robust, simple, quick, highly sensitive and has good reproducibility (coefficient of variation < 2%).
- The bioassay can determine the content of peroxides with great accuracy in products with very low concentrations of active substance. The lower detection limit is 0.0002% hydrogen peroxide in the product.
- In contrast to traditional redox titrations, the bioassay is not affected by any reducing or oxidising chemicals in the products.
- The catalase bioassay is suitable for tooth-whitening products with hydrogen peroxide as the active substance, no matter whether the peroxide is present as free hydrogen peroxide or bound in releasers.
- Products containing several different active substances may be tested, e.g. products containing both urea peroxide and calcium peroxide (1).
- It is highly probable that the bioassay may be suitable for use on other product types containing hydrogen peroxide, e.g. cosmetics containing fat, which complicates redox titrations.
- For four of the products tested, the concentrations found using the catalase bioassay and potassium permanganate titration corresponded well with the product specifications.
- For three of the products tested, the concentration of active substances was not stated.
- In repeated analyses of the same batch, two of the products tested (”E” and ”F”, which come in a set) showed no – or a very small – content of peroxide, both using the titration method and the catalase bioassay method. Both analysis methods found peroxide when a new set was bought and tested.
6 References
- Binnerup, SJ and Rastogi, SC (2006) Tandblegningsmidler, Report to the Danish EPA, Chemicals.
- Second Commission Directive 82/434/EEC of 14 May 1982 on the approximation of the Laws of the Member States relating to methods of analysis necessary for checking the composition of cosmetic products.
- Bottari E and Libert A, in: Universita degli Studi di Roma (Eds.). Analisi Chimica Quantitativa, Ferr V Printing – Lithographic Shop, Roma, pp. 267-271 280-281.
- Tang B, Zhang Li and Xu K (2005). FIA – near – infrared spectrofluorometric determination of trace determination of hydrogen peroxide using triachlorobocyanine (Cy.7.CI) and horseradish peroxidase (HRP). Talanta 68: 876-882.
- Campanella L, Roversi R, Sammartino MP and Tomassetti M (1998) Hydrogen peroxide determination in pharmaceutical formulations and cosmetics using a new catalase biosensor. J Pharmaceutical and Biomedical Analysis 18: 105-116.
- Campanella L, Favero G, Giancola D and Tomassetti M (2003) Determination of hydrogen peroxide in disinfectant solutions using a biosensor with two antagonist enzymes. J Pharmaceutical and Biomedical Analalysis 32: 737-751.
- Faguri RLRP, Lupetti KO and Fatibello O (2005) Flexible potentiometric minisensor based on manganese dioxide-composite for the determination of hydrogen peroxide in bleach and pharmaceutical products. Anal Lett 38: 1857-1867.
- SCCP. Appendix to opinion on hydrogen peroxide, in its free state or when released, in oral hygiene products. European Commission. SCCP/xxxx/07. (unpublished)
Anex 1: Technical specifications of the oxygen probe.
Annex 2: Measuring equipment used
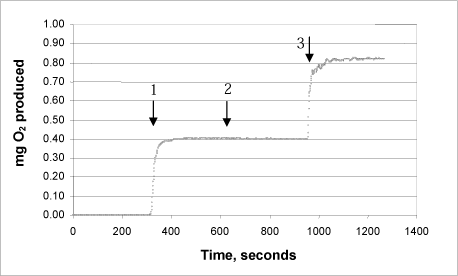
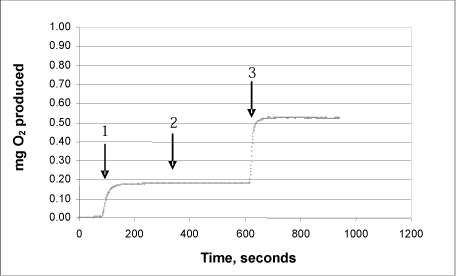
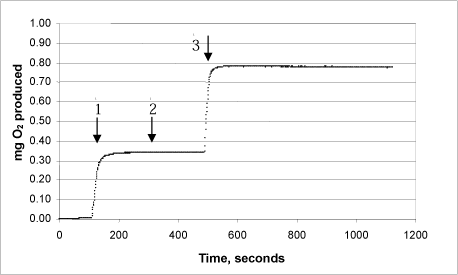
Annex 3: Test of the catalase bioassay on tooth-whitening products, curves
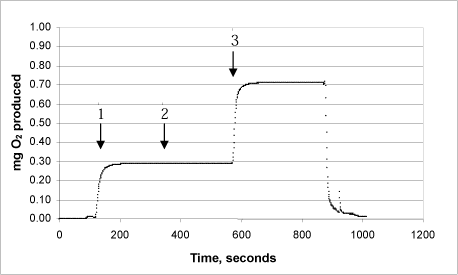
This Annex shows the curves for seven tooth-whitening products, analysed with the newly developed catalase bioassay. All the products were analysed as described in the protocol, and a known quantity of urea peroxide was then added after completion of the reaction. The analyses of the products confirm that there are no substances in the tooth-whitening products tested which inhibit the activity of the catalase.
The same procedure was used on each of the products:
Arrow 1 indicates where tooth-whitening product and catalase were added
Arrow 2 indicates where more catalase was added
Arrow 3 indicates where urea peroxide solution in a known concentration was added.
3a: Product ”A”
3b: Product “B”
3c: Product “C”
3d: Product “D”
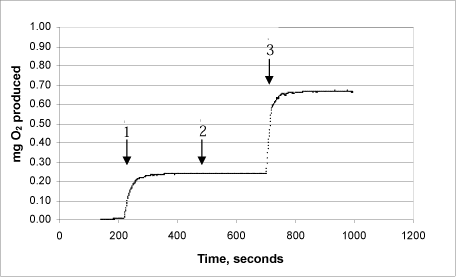
3e: Product “E” – first analysis (lot no. 30187)
3f: Product “E” – second analysis (lot no. 0704002)
3g: Product “F” – first analysis (lot no. 30187)
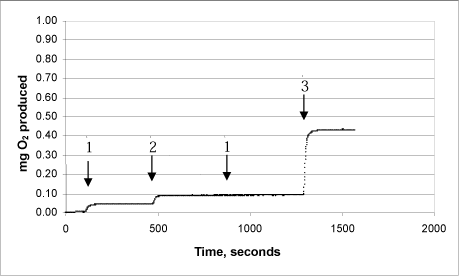
3h: Product “F” – second analysis (lot no. 0704002)
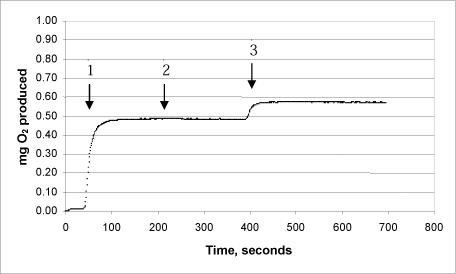
3i: Product “G”
Annex 4: Data from titrations and catalase bioassay
Clik here to see tabel "Data from titrations and catalase bioassay".
Annex 5: Draft Japanese Industrial Standard for tooth-whitening agents.
Version 1.0 Marts 2009, © Danish Environmental Protection Agency