Development of an analysis method to determine peroxides in or released from tooth-whitening/dental-bleaching products.
3 Development and testing of catalase bioassay to determine peroxides
- 3.1 Technical design of measuring chamber, probe and data collection
- 3.2 Determination of the optimal conditions for the catalase bioassay
- 3.3 Testing of the catalase bioassay on peroxides in pure form
As a part of the project a measuring chamber was constructed, which was subjected to a series of tests for tightness and measuring stability. Subsequently,
- the optimal quantity of active substance (peroxide) was determined;
- the optimal quantity of enzyme was determined;
- the appropriate reaction rate was mapped;
- the optimal pH was identified.
A protocol for the measurement of peroxides in tooth-whitening products was suggested on the basis of this test series. This protocol was subsequently tested on different tooth-whitening products purchased on the Danish retail market.
3.1 Technical design of measuring chamber, probe and data collection
An oxygen measurement and regulator system was used, designed and developed in cooperation with Loligo Systems, Tjele, Denmark. The system consists of a glass reaction chamber with a known volume (103-107.5 ml) and an acrylic lid fitted with an oxygen probe and two small ports (0.92 mm in diameter) for the injection of test material. Inside the measuring chamber is a glass-coated magnet, which, when rotated (1,000 rpm) ensures uniform mixture of all the components during the reaction and oxygen measurement.
Figure 1: Set-up for catalase bioassay
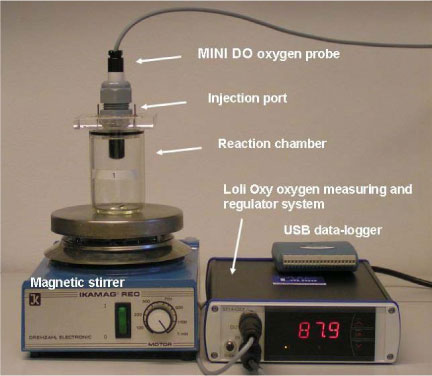
Oxygen measurements are performed by a galvanic oxygen probe (MINI-DO, Oxyguard, Birkerød, Denmark). According to the specifications the probe has a maximum measurement uncertainty of +/- 1% of the measured value. Data is collected every second using a data logger (from Measurement Computing, MA, USA) and transferred to a Windows-based software (TracerDAQ.
Specifications for the probe are included in Annex 1 and an order overview from Loligo Systems is in Annex 2.
3.1.1 Test set-up
Before measuring commences, the glass chamber is filled with autoclaved phosphate buffer (pH = 7) purged with nitrogen, after which the acrylic lid with the oxygen probe is mounted. Removal of oxygen in the buffer by nitrogen gassing ensures that the changes in oxygen concentrations can be monitored without bubbles forming due to over saturation in the chamber. The buffer is sterilised using autoclaving, while the equipment is sterilised with alcohol in order to prevent biological oxygen consumption during the run from affecting the measurements. Catalase (Sigma-Aldrich, cat. no. C100) is now added in a known quantity. In all of the tests, about 5,000 units of catalase were added to the test chamber (1 unit degrades 1 µmol H2O2 per minute at 25°C). Immediately prior to analysis, a known quantity of peroxide or tooth-whitening agent is added. Since the solubility of oxygen in a liquid is temperature-dependent, all measurements were carried out at the same temperature (22°C) in an air-conditioned room. Four replicate test chambers were used for the tests. The final calculations include adjustments for the small variations in chamber volume.
3.1.2 Testing of the stability of the probe
Prior to a measuring run, a two-point calibration of the probe is made with 0% oxygen saturation (solution of sodium sulfite) and 100% oxygen saturation (buffer bubbled with oxygen) as the two extreme points. A comparison of probe outputs measured in volts (V) in independent calibrations conducted over a 20-day period demonstrated great probe stability, as the deviation was less than 1% of the average value (Table 1).
Table 1. Stability of the oxygen probe tested by measuring output (volts) at 0 and 100% oxygen saturation (n = 20).
| Probe output | ||
| Oxygen saturation, % | Average (V) | Coefficient of variation (%) |
| 0 | 0.9913 | 0.3026 |
| 100 | 4.9511 | 0.4726 |
3.1.3 Testing of the tightness of the reaction chamber
In order to prevent the loss of oxygen during measuring, and correspondingly, to prevent air from entering the reaction chamber, the reaction chamber and the probe must comprise a tightly sealed unit.
To demonstrate the system’s tightness, a number of tests were conducted in which the chamber was assembled with 75, 22 and 1.5% oxygen-saturated water, respectively, and the oxygen level was subsequently monitored over an 18-20-hour period (figure 2).
Figure 2: Reaction chamber tightness and consumption of oxygen
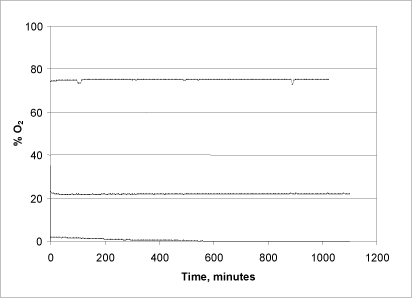
In the tests with the low concentration (1.5%), the oxygen level starts to drop fairly quickly after about two hours of reaction time, and in the course of 10 hours all of the oxygen has been consumed. This is probably due to microbial consumption of oxygen, as the measurement in this case was not conducted under sterile conditions. In the subsequent series of measurements (22% and 75%) and in all subsequent measurements, the liquid was sterilised and the chambers wiped off with alcohol beforehand to minimise this factor of uncertainty. As seen in Fig. 3, a stable oxygen level was maintained throughout the entire time of measuring, demonstrating the chambers’ tightness and, moreover, that the system does not itself consume a significant amount of oxygen during the measuring.
3.2 Determination of the optimal conditions for the catalase bioassay
The method was tested using either hydrogen peroxide and urea peroxide in known quantities or in pure forms. These two substances are the most commonly used peroxides in tooth-whitening products. The method was moreover tested on four pure substances, which are also used in tooth-whitening products, namely sodium perborate monohydrate, sodium perborate tetrahydrate and sodium percarbonate.
3.2.1 Testing the optimal measurement scope and lower detection limit of the method
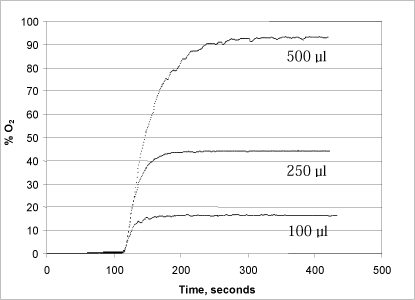
A series of tests were conducted with varying concentrations of both hydrogen peroxide (50, 150 and 170 µl of a 1% solution added to the reaction chamber) and urea peroxide (100, 250 and 500 µl of a 1% solution) in order to determine the method’s optimal measurement range (Figs. 3 and 4).
Figure 3: Changes in oxygen concentration in the reaction chamber after addition of 50, 150 and 170 µl, respectively, of a 1% hydrogen peroxide solution.
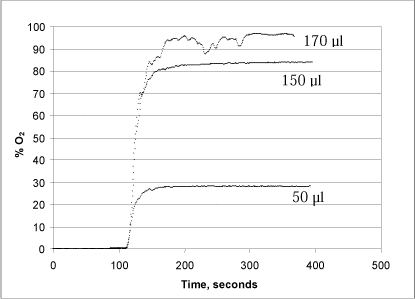
Figure 4: Changes in oxygen concentration in the reaction chamber after addition of 100, 250 and 500 µl, respectively, of a 1% urea peroxide solution.
When catalase is added after 110 sec., oxygen is rapidly released because the enzyme splits the hydrogen peroxide (Fig. 3). When using 5,000 units of catalase, the hydrogen peroxide is converted into oxygen and water in less than 1½ minutes, which results in an oxygen saturation of 28.1%, 83.9% and 96.4% in the glass chamber, respectively. Note that addition of 170 µl hydrogen peroxide results in an unstable signal, probably due to the formation of bubbles on the surface of the probe. The formation of bubbles is presumably because the equilibrium between dissolved and free oxygen cannot be maintained during the extreme, momentary reaction and oxygen release. Since the method requires the oxygen to remain dissolved in the liquid, it is important to take this into account, for instance by aiming for a test design in which the quantity of oxygen released corresponds to less than 80% of the oxygen saturation. Alternatively, a smaller quantity of enzyme can be added, whereby the reaction will run more slowly.
Addition of urea peroxide (Fig. 4) resulted in a somewhat slower development of oxygen, presumably because the peroxide is bound in a urea complex, from where it is continuously released during the enzymatic degradation of the free peroxide (Fig. 4). Thus it takes up to five minutes (to convert the added urea peroxide, dependent on the quantities added. Here, the problem of an unstable signal when the release of oxygen is high is less significant, probably because the release takes place over a longer period of time. As can be seen in Fig. 4, there is direct proportionality between the quantity of urea peroxide added and the development of oxygen.
A comparison between Figs. 3 and 4 reveals a generally lower signal when analysing urea peroxide. This is because hydrogen peroxide makes up only about 35% of the weight of the urea peroxide molecule. In other words, the quantity of oxygen that can be released from urea peroxide solution is only about 35% of the quantity of oxygen that can be released from a hydrogen peroxide solution in the same concentration.
3.2.1.1 Assessing the lower detection limit for the catalase bioassay
According to Danish legislation on cosmetics (Annex 3 of Statutory Order no. 422 of 4 May 2006) the highest concentration of hydrogen peroxide allowed in oral-care products is 0.1%, either present in the product or released during use.
The catalase bioassay is very sensitive, and it is possible to measure the precise quantity of peroxide in a sample, when oxygen development is kept between 1 and 80% of the chamber’s oxygen saturation.
On the basis of the tooth-whitening products tested (section 4), it was determined that a maximum of 10 grams of a product can be dissolved in the reaction chamber (100 ml). Since urea peroxide contains the lowest quantity of peroxide (% by weight), this substance was used as the basis of an assessment of the lower detection limit.
As shown in Fig. 4, addition of 100 µl of 1% urea peroxide to the reaction chamber will result in an oxygen development in the reaction chamber corresponding to 17.5% of the chamber’s oxygen. Addition of 100 µl of 0.1% urea peroxide will therefore result in approximately 1.75% of the chamber’s oxygen saturation.
If 10 grams (~10,000 µl) of a tooth-whitening product are added with a content of 0.1% urea peroxide, this, in turn, will result in 175% of the chamber’s oxygen saturation. An accurate result can however be achieved with an oxygen saturation in the reaction chamber as low as 1%, which would correspond to adding 10 grams of a tooth-whitening product with a content of 0.00057% urea peroxide.
For measurements of tooth-whitening products, the lower detection limit for the catalase bioassay is therefore 0.0006% urea peroxide, corresponding to 0.0002% hydrogen peroxide.
3.2.2 Testing of the stability of the catalase
The stability of the catalase, its pH sensitivity and reactivity were analysed in a series of tests. In the first test, peroxide and catalase were added repeatedly to the same reaction chamber (figure 5).
Figure 5: Repeated addition of H2O2 and urea peroxide to the reaction chamber. Starting from the left hand side, arrows 1+2 point to where 5,000 units of catalase were added. Arrow 3 points to where 100 µl 1% urea peroxide were added, whereas arrow 4 shows where 50 µl 1% hydrogen peroxide were added. Arrow 5 shows where the test stopped and the probe was transferred to an out-gassed phosphate buffer.
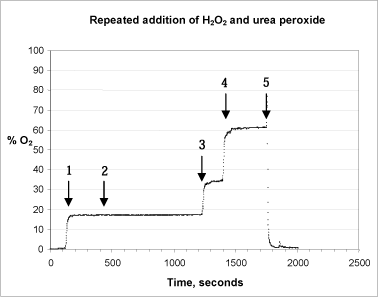
In the test 100 µl 1% urea peroxide were added from the start. When the catalase is added, (arrow 1, Fig. 5) the reaction proceeds exactly as expected, the signal stabilising within 1 minute. When more catalase is added (arrow 2) the signal remains stable. This shows that the first reaction has proceeded to the end and that an adequate initial quantity of active enzyme was added to the system. When 100 µl 1% urea peroxide (arrows 3 + 4) are added, the level of oxygen rises immediately as expected. This shows that the quantity of enzyme added is still active. After 9 min. (1,750 sec.), there is a marked change in the signal when the probe is removed from the test chamber and transferred to the out-gassed buffer solution, after which the signal stabilises once more at about 1.5% oxygen saturation
3.2.2.1 Testing of varying concentrations of catalase
Increasing concentrations of catalase, increases the speed at which the peroxide is split into oxygen and water but has no bearing on the determination of the content of peroxide (Fig. 6).
Figure 6: Effect of increasing concentrations of catalase on the reaction rate. 50 (1); 100 (2); 500 (3); 1,250 (4); 5,000 (5); and 10,000 (6) units of catalase were added.
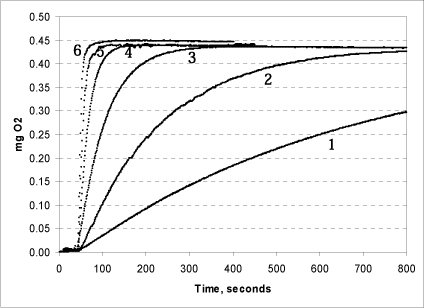
The tests shown in Fig. 6 were conducted in triplicate at pH 7. The same quantity (250 µl) 1% urea peroxide was added in all tests. When 10,000 units of catalase are added, the reaction is immediate and all of the peroxide is split in less than half a minute. If less catalase is added, the rate of the reaction drops. When 1,250 units of catalase are added, all of the peroxide is split within 1½ minutes. Even at very low concentrations of catalase in the chamber, however, the reaction concludes within 60 minutes, and, as expected, the final oxygen production is the same in all of the tests. The same was seen for hydrogen peroxide (data not shown). Based on this data, it is recommended that 5,000 units are added per reaction.
3.2.2.2 The shelf life of the catalase
Catalase (CAS no. 9001-05-2) is purchased in aqueous solution at a concentration around 1,379,400 units/ml. A stock solution of 140,000 units/ml was prepared by dilution in 50 mM phosphate buffer. In an attempt to examine the shelf life of the catalase, a stock solution was divided in two parts, of which one was stored in a refrigerator at 4°C, while the other was stored at around 20°C (room temperature). After 0, 1, 2, 3, 7, and 50 days, a standard test was set up at pH7. Catalase (5,000 units) was added to the chamber as well as 100 µl hydrogen peroxide (1%), corresponding to a theoretical oxygen development of 0.5377 mg.
Table 2: Assessment of the shelf life of the catalase in a solution at 4 °C and 20 °C.
| Time Day (24 hrs) |
Storage temp. °C |
O2 produced mg |
| 0 | 20 | 0.5299 |
| 1 | 4 | 0.5158 |
| 1 | 20 | 0.5255 |
| 2 | 4 | 0.5256 |
| 2 | 20 | 0.5277 |
| 3 | 4 | 0.5212 |
| 7 | 4 | 0.5341 |
| 7 | 20 | 0.5349 |
| 50 | 20 | 0.5350 |
The shelf life of the solution when stored at 4°C and 20°C is very long. As can be seen from Table 2, the catalase’s activity after 50 days storage at 20°C remained at the same level as just after the solution was prepared. Furthermore, the reaction rate was not affected by the long storage time (data not shown).
3.2.2.3 Effects of pH on the activity of the catalase
The release of peroxide from the releaser calcium oxide is pH-dependent. It is therefore relevant to test the method’s sensitivity to changes in pH. The pH optimum for catalase is around 7, which corresponds to the physiological pH in most cells. Deviations in pH may lead to changes in the configuration of the enzyme, reducing the activity of the enzyme.
Figure 7: The efficiency of the catalase at pH 4, 6, 7 and 10.
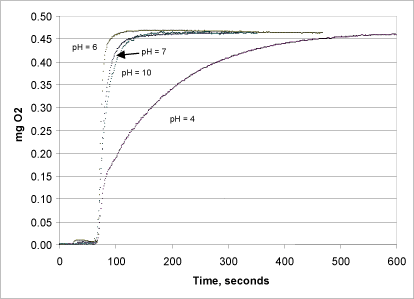
The pH dependency of the catalase was examined in a series of tests using buffer solutions of varying pH (4-10, Fig. 7) in the reaction chamber. All of the tests were conducted in triplicate, and the pH in the chamber was measured both before and after the reaction.
Using a buffer at pH values varying from 4-10 affected the reaction kinetics, however not the oxygen level measured at the end of the reaction (Fig. 7). The reaction was fastest at pH 6, where all of the peroxide was converted to oxygen within half a minute. At pH 7 and pH 10, the reaction rate was lowered by a factor of about three. At pH 4, the activity of the enzyme dropped drastically and the reaction was not complete until after about 10 minutes.
3.3 Testing of the catalase bioassay on peroxides in pure form
The catalase bioassay was tested on different peroxides in order to confirm a relationship between the peroxide content expected and that measured in the solutions used. Furthermore, the reproducibility of the method was tested in a series of independent experiments to describe its accuracy when used on the respective peroxides.
3.3.1 Hydrogen and urea peroxide
The catalase bioassay was applied to a number of different concentrations of hydrogen and urea peroxide in pure form, where the results were either compared to the expected quantity according to the product specifications (urea peroxide), or to the quantity found from KMnO4 titration (hydrogen peroxide). The latter was required with the hydrogen peroxide because the substance is unstable when stored and therefore the manufacturer’s statement of content is uncertain. In all the measurements, the probe signal was read 300 seconds (5 minutes) after adding the catalase.
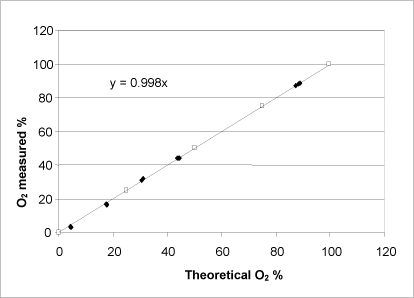
Figure 8: Relationship between the potential oxygen release calculated on the basis of a KMnO4titration (unshaded symbols) and determined by adding a varying quantity of H2O2 to the catalase bioassay (shaded symbols). Both axes show the percentage of oxygen saturation in the buffer at the reaction’s completion.
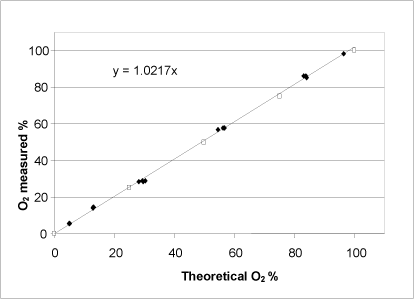
For hydrogen peroxide, a linear relationship between the expected oxygen development calculated on the basis of a redox titration, and the oxygen development determined using the catalase bioassay was observed (Fig. 8). Thus, the catalase bioassay can be applied to hydrogen peroxide determination within the entire measurement interval, which is defined by the oxygen saturation of the buffer. According to the product specifications, the concentration of the hydrogen peroxide purchased was stated to be 30%. The KMnO4titration determined the concentration to be 34.4% with a standard deviation of 0.2 (n=4), whereas the catalase bioassay determined the concentration to be 33.6% with a standard deviation of 0.7 (n=14).
Figure 9: Relationship between the theoretically possible oxygen release calculated on the basis of the manufacturer’s information about the purity of the substance (unshaded symbols) and determined by adding a varying quantity of urea peroxide to the catalase bioassay (shaded symbols). Both axes show the percentage of oxygen saturation in the buffer at the reaction’s completion.
Similar to hydrogen peroxide, urea peroxide showed a linear correlation between the measured and the theoretically possible oxygen development calculated on the basis of the quantity of substance added (Fig. 9). Therefore, it can be concluded that the bound peroxide is released from the urea peroxide and that it is cleaved by the catalase enzyme within the measurement period in question. The manufacturer stated the concentration of urea peroxide to be 97%, whereas the catalase bioassay determined it to be 97.4% with a standard deviation of 0.9 (n=12). On the basis of KMnO4 and S2O3 titrations, the content of urea peroxide was determined to be 95.83% with a standard deviation of 0.4 (n=3) and 99.17% with a standard deviation of 0.3 (n=3), respectively, which deviates somewhat from the manufacturer’s specifications and the result determined by the catalase bioassay.
3.3.2 Calcium peroxide
At physiological pH (pH=7), calcium peroxide has a very low solubility in water (<0.01% at 20°C), and calcium peroxide reacts differently with water at different pH values. The solubility of calcium peroxide increases as the pH value drops, and during the production of free hydrogen peroxide. The quantity of hydrogen peroxide being produced depends entirely on the pH value.
In order to determine the optimal pH value when analysing products containing calcium peroxide, a series of tests in which the pH value was set at various values from 4-10 were carried out. One mg of calcium peroxide dissolved in water was added in each test. According to the manufacturer (Sigma, MA, USA), the calcium peroxide has a purity of 75%. Thus 1 mg calcium peroxide will be able to release a maximum of 0.16647 mg O2. The recovery percentage was then calculated using the following formula:
mg O2 produced/ 0.16647 mg) x 100 = recovery (%)
The release of oxygen was found by conducting a reading of the oxygen produced after 10 minutes, as the signal was still not stable after 5 minutes. All tests were conducted in repetitions of 3-6, and the pH in the reaction chamber was measured both before and after the test.
Figure 10: Relationship between oxygen production (as a percentage of the maximum possible) from calcium peroxide and pH.
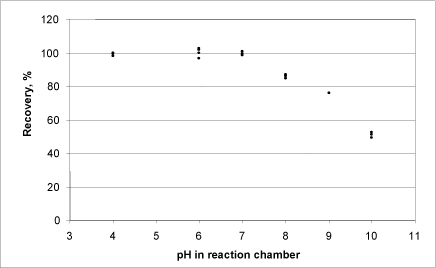
At a high pH value, the production of oxygen from calcium peroxide was lower than at around 6-7 (Fig. 10).
Calcium peroxide requires a low pH value (an acidic environment) to dissolve in water. In order to test whether the pH in the calcium peroxide solution that is added to the reaction chamber is of significance to the results of the analysis, 1 mg of calcium peroxide dissolved in water (pH=11.2) and in a H2SO4 solution with a pH value of 2.0 was added. The pH value in the measuring chamber itself was kept at 7.0 using the phosphate buffer.
Figure 11: Correspondence between reaction rate and pH in the calcium peroxide stock solution.
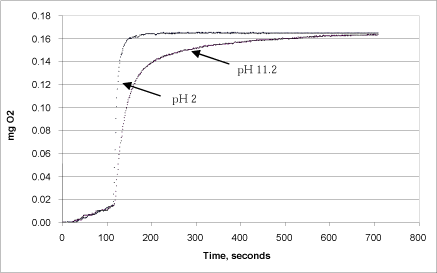
Fig. 11 shows that the reaction rate was highest when calcium peroxide was added after it had been dissolved in an H2SO4 solution of pH 2. Here, the development of oxygen took places immediately upon addition of catalase, and the reaction proceeded to an end within one minute. If calcium peroxide in water at pH 11.2 was injected instead, the reaction rate was slower, but it ended at the same level after 10 minutes. This difference is due partly to the fact that the calcium peroxide at low pH had already released the total pool of peroxide, and partly because the addition of calcium peroxide in undissolved form slowed down the speed at with which hydrogen peroxide was released to the liquid phase.
3.3.3 Sodium perborates and sodium percarbonate
Traditionally, sodium perborate monohydrate, NaBO3H2O (CAS no. 10332-33-9) and sodium perborate tetrahydrate, NaBO34H2O (CAS no. 10486-00-7) have been used as bleaching agents in washing powder. In recent years, sodium perborate has also been used in tooth-whitening agents. In contrast to products containing hydrogen peroxide and urea peroxide, in Denmark sodium perborates are only found in products used by dentists. The hydrogen peroxide releaser, sodium percarbonate, is not yet found in tooth-whitening products in use in Denmark (1, 8).
Peroxide release and oxygen development from the two sodium perborates and sodium percarbonate were tested. The two perborates differ from one another by having a differing amount of crystal water bound in them. Theoretically, sodium perborate monohydrate can release hydrogen peroxide corresponding to 34% of its molecular weight, whereas sodium perborate tetrahydrate releases hydrogen peroxide corresponding to 22% of its molecular weight. Sodium percarbonate can potentially release hydrogen peroxide corresponding to 28% of its molecular weight. These percentages are included in the calculation of the recovery percentage after the formation of oxygen in the catalase bioassay.
For all three substances, a series of tests were made with four repetitions. pH was adjusted to 7 and 100-250 µl of a 1% solution of the three substances were injected. The signal stabilised in all cases within about 2 minutes, the results were read after 5 minutes, and the oxygen quantity was used to calculate the recovery percentages (see table 3).
Table 3: Recovery – sodium perborates and sodium percarbonate.
| Chemical | Theoretical O2, mg |
Measured O2, mg |
Recovery, % |
Average | Standard deviation |
n |
| Sodium perborate monohydrate |
0.400 | 0.408 | 102.00 | 102.56 | 0.8260 | 4 |
| 0.400 | 0.414 | 103.50 | ||||
| 0.400 | 0.407 | 101.75 | ||||
| 0.400 | 0.412 | 103.00 | ||||
| Sodium perborate tetrahydrate |
0.259 | 0.270 | 104.17 | 104.07 | 1.4564 | 4 |
| 0.259 | 0.275 | 106.10 | ||||
| 0.259 | 0.267 | 103.01 | ||||
| 0.259 | 0.267 | 103.01 | ||||
| Sodium percarbonate | 0.143 | 0.143 | 100.00 | 100.03 | 0.9207 | 4 |
| 0.359 | 0.361 | 100.70 | ||||
| 0.359 | 0.361 | 100.70 | ||||
| 0.359 | 0.354 | 98.74 |
As can be seen from Table 3, there was a good correspondence between the theoretical and measured peroxide content with regard to sodium perborate monohydrate and sodium perborate tetrahydrate. The recovery percentages in all cases deviated by less than 1.5%.
3.3.4 Overview of recovery percentages and accuracy for the different peroxides measured in the catalase bioassay
The method developed was validated on a number of different peroxides in pure form (Table 4).
Table 4: Recovery percentages for pure peroxide compounds
| Active substances | Quantity added mg |
Recovery (%) | Standard deviation (%) |
n |
| Hydrogen peroxidea) | 0.25-1.0 | 100.18 | 1.5908 | 14 |
| Urea peroxide | 0.25-2.5 | 100.48 | 0.8915 | 12 |
| Calcium peroxide, pH 7 | 1.0 | 98.79 | 1.8686 | 8 |
| Sodium perborate, 1 H2O | 2.5 | 102.56 | 0.8260 | 4 |
| Sodium perborate, 4 H2O | 2.5 | 104.07 | 1.4564 | 4 |
| Sodium percarbonate | 1-2.5 | 100.03 | 0.9207 | 4 |
a): Recovery of hydrogen peroxide was calculated on the basis of the concentration in the stock solution found using KMnO4 titration.
The validation showed that for all substances tested there was very good correspondence between the theoretical and the measured oxygen development. The recovery percentages deviated in all cases by less than 1.9%, and this describes the method’s level of uncertainty under the analytical conditions chosen.
Version 1.0 Marts 2009, © Danish Environmental Protection Agency