Modellering af optagelse af organiske stoffer i grøntsager og frugt
Bilag C
Potato Model (Draft)
Potato is the vegetable with the highest production worldwide. In 1986, 308 548 million kg were produced, compared to, e.g., carrots with only 12 471 million kg (Franke 1989). Potato is also often homegrown in gardens. The consumption of potato, which is polluted with soil contaminants, may therefore pose an important risk to the exposed population. However, only a few studies are concerned with this issue, and available empirical data is limited.
In current risk assessment, e.g., for chemical risk assessment in the European Union, potato is considered being a "fine root", and uptake is calculated from the chemical equilibrium to soil (EC 1996). In reality, potato is not a root. The tuber is a storage organ and part of the stem (Franke 1989). It is not part of the root system, without connection to the xylem, and loaded from the assimilate stream in the phloem (Sitte et al. 1991). Advective transport of soil pollutants into the potato is therefore unlikely (the phloem is loaded in the leaves). Diffusive uptake of chemicals may occur, although potatoes have a low surface to volume ration, due to the spherical form. So when is diffusive uptake a relevant process? To answer this question, a "potato model", which estimates diffusion into a potato, is developed.
Potato Model - Diffusive Uptake into a Sphere
The "potato model" estimates diffusion into a sphere.
Diffusion into a plane sheet
The analytical solution for diffusion in z-direction into a plane sheet without advection, growth or reaction and with constant concentration C0 at the surface z = 0 has been used recently to calculate diffusion into a carrot (Trapp 2002) and is (Crank 1970):
| Equation 13 |
where
| D | is the diffusion coefficient, here of a chemical in plant tissue (see below). |
| C0 | is the concentration in the potato at equilibrium between soil pore water and potato |
| z | is the distance from the surface |
| t | time |
Diffusion into a sphere
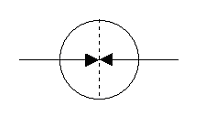
The diffusion into a sphere can be considered as symmetrical from all sides. Molecules from all directions arrive at the same time at the midpoint. Mathematically, this is identical to a reflection at the centre of the sphere (Figure C.1).

Figure C.1
Image of the diffusion process into the sphere
Assuming the following boundary conditions:
| t = 0: 0 £ x < r: C(x,0) = 0 (the initial concentration is zero). The situation simulated here is that a fully developed potato is put into the polluted soil at time t = 0. The actual situation is rather that the potato grow in the polluted soil together with that the chemical diffuse into the potato | |
| x = 0: the flux is zero | |
| x = r, t ³ 0: C(r,0) = C0 |
where
| r | is the radius of the vegetable |
| x | is the distance to the centre |
The solution is
| Equation 14 |
The solution above can solve the diffusion problem into a sphere. Interpret x = 0 as the
midpoint, and r as the radius. The sphere is divided into n layers of thickness dx. The
average concentration in the sphere is found by:
 |
Equation 15 |
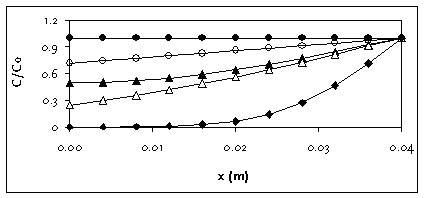
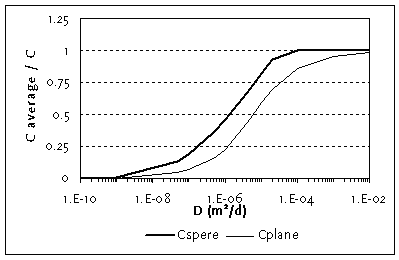
Figure C.2 gives an example of the difference between the solution for a plane sheet and a
sphere with a radius of 4 cm, for t = 60 days, and D between 10-4 and 10-6
m2/d. For small D, there is no difference between sphere and plane sheet: the
reflection does not occur, because the molecules do not reach the centre in 60 days. For
large D (>10-4 m2/d), the sphere has throughout a concentration C
> 0.99 C0, whereas this requires a larger D (approx. D = 0.1 m2/d)
in case of the plane sheet. Generally, averaged concentrations in the sphere are higher,
and equilibrium is reached earlier.

Figure C.2
Concentration profile in a sphere (open symbols) and a plane sheet (closed
symbols) for r is 4 cm, t is 60 days and D is 10-4 m2/d (bullets),
10-5 m2/d (triangles) and 10-6 m2/d
(rhomboids; symbols overlap)

Figure C.3
Averaged concentration in a sphere with r is 4 cm and in a plane
sheet for t is 60 d and for varying diffusion coefficients
Parameterization of the Model for Potatoes
There are only two plant and chemical specific parameters in the equation, namely C0 and D. C0 describes the concentration at x = r, the outer peel of the potato. This concentration is calculated from local equilibrium with the surrounding soil:
| C0 = KPW× CW = (L× 1.22× log KOW0.77+PW + PA× KAW + CH× KCH)× CW | Equation 16 |
where
| PW | is the volumetric water fraction of potato |
| PA | is the volumetric gas fractions of potato |
| KPW | is the partition coefficient potato to water |
| CW | is the chemical concentration in the soil solution |
| L | is the lipid content of the potato (0.003 g/g, Fødevaredirektoratet 2002) |
| CH | is the fraction of carbohydrates (0.172, Fødevaredirektoratet 2002) |
| KCH | is the partition coefficient to carbohydrates. |
| KCH = | 0.1 for log KOW < 0.2 0.2 for 0.2 < log KOW < 0.9 0.5 for 1 < log KOW < 1.9 1 for 2 < log KOW < 2.9 2 for 3 < log KOW < 3.9 3 for log KOW > 4 (Chiou et al. 2001) |
Values for water content of vegetables are well known, but can vary sligthly. Here an
average water content of 0.798 g/g (Fødevaredirektoratet 2002) is used. The volume
fraction of air in potato was measured by setting potatoes in water at around 10oC
in 3-4 days, and measuring the weight gain (DHI 2002, unpublished data). This weight gain
was assumed caused be the replacement of air with water. The air volume fraction was
measured to be 0.061. The volume fraction water was estimated from the volume fraction air
in the potato, and from the content of carbohydrates and lipids assuming a density of 2
kg/L for carbohydrates and 0,8 kg/L for lipids. The volume fraction was estimated to 0.85.
The fraction of chemical present in the water and the gas phase of the potato, fW and fA, can be estimated from
| fW = PW/(KPW + PW + PA× KAW) | Equation 17 |
| fA = PA KAW /(KPW + PW + PA× KAW) | Equation 18 |
The effective diffusion coefficients in water phase DW,eff and gas phase DA,eff
of potato are calculated from
DW,eff = T× fW× DW
DA,eff = T× fA× DA
D = DW,eff + DA,eff
where
| T | is a tortuosity factor reflecting physical hindrances. For wood, T » 0.01 was found (Mackay & Gschwend 2000). |
| DW | is the diffusion coefficients of the chemical in water (approx. 5´ 10–5 m2/d) |
| DA | is the diffusion coefficients of the chemical in gas phase (approx. 1 m2/d) |
The diffusion coefficient in potato D is the sum of DW,eff and DA,eff.
Sensitivity Study
Values of D for the chemicals of interest are listed in Table C.1. By comparison with Figure C.3, it can be seen that the uptake is very small for chemicals with a D around or below 10-9 m2/d, a value calculated for benzo(a)pyren. On the other hand, for all chemicals with a calculated D > 10-5 m2/d, the assumption of equilibrium (and therefore the use of the much easier equilibrium model) is justified. It is not so much the KOW, which determines the diffusion coefficient, but the ratio of KOW to KAW, also named KOA (octanol-air partition coefficient). The higher the KOA, the more chemical in the gas pores, where the diffusion process is much faster.
Table C.1
Values of the calculated diffusion coefficient for chemicals of interest
Chemical |
log KOW |
KAW |
D (m2/d) |
Naphthalene |
3.36 |
0.0167 |
2.7 · 10-6 |
Benzo(a)pyrene |
6.13 |
1.39× 10⁻⁵ |
2.7 · 10-9 |
MTBE |
1.14 |
0.0175 |
6.4 · 10-6 |
Toluene |
2.75 |
0.22 |
5.6 · 10-5 |
n-Dodecane |
5.8 |
307.7 |
9.2 · 10-4 |
Trichloroethene |
3.03 |
0.34 |
6.0 · 10-5 |
Benzene |
2.13 |
0.23 |
7.3 · 10-5 |
Tetrachloroethene |
2.87 |
0.83 |
1.4 · 10-4 |
Calculation
The calculated average concentration in potato tubers with the potato model is compared to the equilibrium concentration in Table C.2. In the case of the present study, the equilibrium assumption can be used for benzene, trichloroethylene, tetrachloroethene, toluene, n-dodecane, and almost for MTBE and naphthalene, but not for benzo(a)pyrene.
Table C.2
Calculated bioconcentration in potatoes (mg/kg fresh fruits : mg/kg wet
soil), diffusion model (CR) and chemical equilibrium (Eq.). Radius of the
potato = 4 cm. Soil: organic carbon content = 2%
Compound |
CR |
Eq. |
CR(Eq.)/ CR |
Naphthalene |
0.14 |
0.24 |
1.7 |
Benzo(a)pyrene |
6.0E-04 |
0.10 |
170 |
MTBE |
1.99 |
2.73 |
1.4 |
Toluene |
0.41 |
0.41 |
1.0 |
n-Dodecane |
0.12 |
0.12 |
1.0 |
Trichloroethene |
0.33 |
0.33 |
1.0 |
Benzene |
0.93 |
0.93 |
1.0 |
Tetrachloroethene |
0.36 |
0.36 |
1.0 |