Potential for Collection and Recycling of Plastic Cannisters, Buckets etc. from Relevant Industral Sectors
Summary and conclusionsCollection potentialCollection tests – small sources Questionnaire – large sources Environmental and economic conditions The objective of the project is:
The conclusions of the project are:
Collection potentialThe total potential for bottles, canisters, drums and pallet tanks made of HDPE from industry in 2000 has been assessed at 17,820 tons /1/.
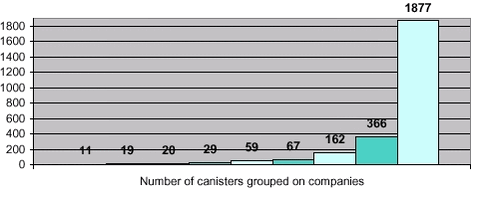
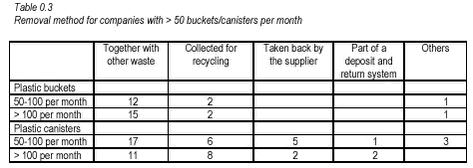
then a collection potential of 13,242 tons is obtained. In connection with buckets made of PP and used by industry, the total potential amounts to 10,228 tons /1/. Collection tests – small sourcesIn co-operation with the Danish company called Reno Fyn I/S collection of waste on an experimental basis has been carried out for small sources. A total of 48 companies participated in the collection test that took five months (10 collections) and a total of six tons was collected. Six companies out of 48 companies that were registered in the collection test did not deliver any plastic canisters etc. at all for collection during the five months test period. Figur 0.1 shows the total amount of canisters collected at the nine companies from where 10 or more canisters were collected during the entire test period (10 collections). As it appears from Figur 0.1 one company differs by having delivered a lot more canisters to the collection scheme than the other companies. If this company and the four companies that only delivered plastic canisters for the collection during the first collections2 are left out (see chapter 4.3), then the remaining 37 companies collected 194 canisters and 195 sacks with canisters in the course of the 10 collections (app. five months). The data material from these 37 companies gives a rather diffuse impression of which types of companies have contributed with canisters for the collection, and it is not possible on the basis of the test results to single out specific types of companies from which it can be assumed that there is reasonable potential for collecting plastic canisters, buckets etc. It must be concluded that the amounts collected during the test period are limited and, as it appears from chapter 4.5.1, the collection costs are considerable. Collection costs amount to app. DKK 4,800 per ton if all companies are included. If the amount collected at the company that in reality cannot be considered a "small" source is deducted, then the collection costs have been estimated at app. DKK 7,200 per ton. In comparison, collection costs for collection from "large" sources (as it appears from chapter 6.2.6.1.2) have been estimated at app. DKK 1,240 per ton. Questionnaire – large sourcesPlastic canisters and buckets as waste 241 companies state that they have waste in the form of plastic canisters, and 144 state that they have waste in the form of plastic buckets. Table 0.1 shows how many canisters and buckets the companies state they have per month. A total of 46 companies state that they have between 10 and 50 buckets per month, 14 companies state that they have between 50 and 100 buckets, and 18 companies that they have more than 100 plastic buckets per month. A total of 73 companies state that they have between 10 and 50 canisters per month, 27 companies that they have between 50 and 100 canisters, and 20 companies that they have more than 100 plastic canisters per month. Tabel 0.2 shows how the companies dispose of their plastic buckets and canisters. As it appears from Tabel 0.2 many more companies state that plastic canisters are returned to the supplier or form part of a deposit and return system than in the case of plastic buckets. Tabel 0.3 shows how plastic buckets and canisters are removed at the companies with 50-100 buckets or canisters and > 100 buckets or canisters, respectively, per month.
Plastic canisters and buckets as containers Out of the 349 companies, 136 companies state that they use plastic containers such as canisters etc. for their products (87 in the first questionnaire and 49 in the second). Tabel 0.4 shows the number of companies that use 0-100, 100-1.000 and > 1.000 plastic containers, respectively, per year (however, for pallet tanks 0-10, 10-50 and > 50 per year). 21% of the companies state that they take back plastic containers from their customers (primarily pallet tanks are in question). The main part of the plastic containers that are taken back are cleaned, rinsed and refilled.
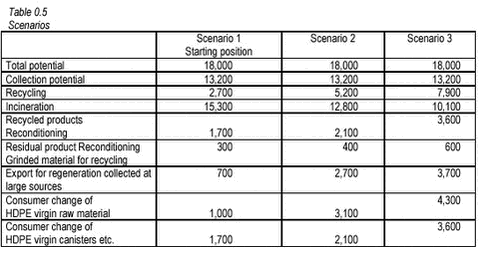
Environmental and economic conditionsIn chapter 6, the following three scenarios presented and compared: Scenario 1 describes the starting position (current situation) (2001). In scenario 2 recycling is increased from 2,700 tons to 5,200 tons. In scenario 3 recycling is increased to 7,900 tons. Tabel 0.6 shows the shifts in the environmental and economic consequences in scenario 2 and 3 compared to scenario 1. As it appears from Tabel 0.6 heavy gains are achieved in scenario 2 and 3 on the environmental factors applied, and heavy gains for the total economy of the company. There are gains on all environmental factors - primarily because during incineration only 31.9 MJ/kg of incinerated HDPE (and PP) is recovered, while 84 MJ/kg is used to produce virgin HDPE (and PP) raw material. The economic savings of the company are substantial. Savings include reduced costs for removal of HDPE (PP) for incineration at the waste manufacturers, and savings for the manufacturers of HDPE products for purchase of virgin products and raw materials. The economic analysis does not comprise lost earnings by the manufacturers of virgin canisters when the amount of canisters for reconditioning increases and the sale of virgin canisters is, thus, reduced. It has not been possible to procure data that illustrates lost earnings. ____________________________________________________________ 2 Companies where 366, 162, 59 and 29 plastic canisters were collected. |