Analyse af Danmarks muligheder for at reducere emissionerne af NOx i 2010
Summary and conclusions
Since the UN Geneva Convention was adopted in 1979, there has been international cooperation to limit transboundary atmospheric pollution. Through a number of protocols, the most recent one being the 1999 Gothenburg Protocol, ceilings have been set for countries' emissions of various atmospheric pollutants from 2010 onwards.
Similar work has been done within the EU, and in 2001, the EU Environment Ministers adopted the NEC Directive 2001/81/EC, which contains emission ceilings for the EU Member States.
According to the available calculations of emissions for Denmark in 2010, emissions of sulphur dioxide (SO2), organic hydrocarbons (VOC) and ammonia are expected to be below the ceiling from 2010 onwards. For nitrogen oxides (NOx) however, projections have so far shown that the emission exceeds the ceiling.
The Danish ceiling for NOx emissions in 2010 is 127,000 tonnes according to the Gothenburg Protocol and the NEC Directive. The NEC Directive requires Member States to prepare national programmes for reduction of emissions of the atmospheric pollutants by 2006, so that Denmark can comply with our obligations.
The objective of this report is to form a technical and economic basis for decisions as to how Denmark can fulfil the target of 127,000 tonnes NOx in 2010. This report was prepared by a working group with participants from a number of ministries and organisations, cf. the list of participants in Annex C. The working group is responsible for the content of the report.
Close to fulfilling the target
From 1985 to 2004, Denmark's total NOx emissions were reduced by approx. 112,000 tonnes, down from 293,000 tonnes to 181,000 tonnes. From 2004 to 2010, the projection made in connection with this report shows that we can expect a reduction of a further approx. 47,000 tonnes NOx.
The expected NOx emissions in 2010 will thus be around 134,000 tonnes, corresponding to a transgression of the ceiling of about 7,000 tonnes. In 2015, total emissions are expected to be approx. 3,000 tonnes lower than the emission ceiling.
This is a significant improvement since 2004, where projections showed a transgression of the ceiling of 40,000 tonnes. This means that we have come a lot closer to being able to stay below the ceiling. Among other things, this is due to the Government's Energy Strategy 2025 and its plan for new energy-saving measures as well as the change in energy taxes adopted in the 2006 Finance Act. In addition, power plants have advanced the installation of NOx-reducing equipment.
Reduction measures
This report studied how we can stay below the NOx-ceiling at the lowest cost possible for society. The calculations are associated with great uncertainties. They build on projections up to 25 years into the future, and these projections are naturally affected by technical, political as well as economic uncertainty. The calculations are thus only based on the best available knowledge at present.
With a few exceptions, the working group has only dealt with technological possibilities of reducing emissions. Behaviour-regulating measures such as economic instruments have not been included.
The most cost-effective way to remove the shortfall in 2010 will, at a welfare-economic level (i.e. for society in general), cost DKK 26 million per year. This will require:
- retrofitting of catalysts (SCR) on large fishing vessels,
- replacement to low-NOx burners at gas and light fuel kettles in industry, and
- better controls for gas engines at combined heat and power plants (CHP).
The welfare-economic costs will place a strain on different sectors in society. The business sector will have costs of DKK 32 million per year, which will mainly be borne by the energy sector, but also by industry and fisheries. The government will have a benefit of DKK 6 million per year from increased tax revenue.
The cheapest measures should not be seen as a recommendation for measures to be chosen by decision-makers. The purpose of the report is merely to show how Denmark can meet its obligations under the NEC Directive and the Gothenburg Protocol in the most cost-effective manner. The feasibility of the measures, financial considerations, the distribution of the initiatives among sectors or other considerations are not reviewed. For example, the legal protection period of eight years for enterprises' environmental approvals could in practice delay the effects of possible new emission requirements.
The expected NOx reduction and economic aspects of a long range of measures in various sectors have been studied. Figure 0-1 shows all the measures for which calculations have been made. The measures have been ranked according to their welfare-economic cost per kg removed NOx (shadow price). The shadow price can be seen from the curve. Thus, the curve shows how Denmark can meet the NOx objectives of the NEC Directive and the Gothenburg Protocol in the most cost-effective manner. This is the main focus of this report.
Figure 0-1 All measures ranked according to welfare-economic shadow price
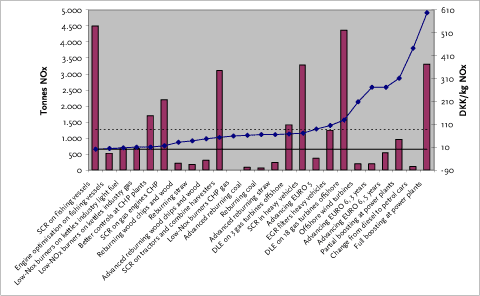
Note 1: The columns show NOx reduction and their values can be read off the left axis. The curve shows the welfare-economic cost per kg removed NOx (shadow price) and can be read off the right vertical axis.
Note 2: The price of DKK 85 per kg NOx only covers the health-related damage costs, and thus depends on amongst other things where emissions occur and on the population density at the place of exposure. Therefore, this price is particularly uncertain for the measures implemented at sea, i.e. in the fisheries and offshore sectors.
The measures are very diverse, and only a few of them have good potential for removing NOx. The measures analysed can remove a maximum of 24,000 tonnes NOx in 2010.
The National Environmental Research Institute of Denmark (NERI) has calculated the health-related damage costs for one kg NOx from a modern coal-fired power plant at DKK 85 per kg. The environmental damage costs of e.g. acidification and over-fertilisation have not been included as it has not been possible so far to quantify them satisfactorily. This means that if we for example assume that the damage cost of emissions of one kg NOx is, generally, DKK 85, all measures where the shadow price is below DKK 85 per kg would give a welfare-economic surplus, while measures that are more expensive would result in a deficit. The price of DKK 85 per kg is indicated as the dotted line in figure 0-1. As mentioned, the price of DKK 85 per kg NOx only covers the health-related damage costs and thus depends on amongst other things where emissions occur and on the population density in the area where the exposure is. Therefore, this price is particularly uncertain for the measures implemented at sea, i.e. in the fisheries and offshore sectors.
A number of sensitivity analyses have been carried out where assumptions are changed to show the influence on the results (the welfare-economic costs). Generally, the measures are robust to changes in interest rates and prices of derived environmental impacts. They are more sensitive to changes in investments, electricity price, CO2 and fuel prices, distribution of electricity displacement between Denmark and abroad, as well as electricity sales. A large group of measures can be described as very stable, including those with lower shadow prices. Conversely, there is a large group of measures that are very sensitive: the two measures for boosting at power plants, EGR on heavy vehicles, reburning/advanced reburning on CHP plants, offshore wind turbines, advance of EURO6 for heavy vehicles. These are either amongst the most expensive measures or they have a moderate reduction potential and are thus not among the most relevant measures.
This report describes the basis for the above conclusions in three chapters: National sources, Regulations of importance for NOx emissions, and Projection of NOx emissions. The following describes the main content of these three chapters. The economic calculations are documented in a background report prepared by the Danish EPA.
National sources
NOx primarily is emitted during combustion processes. The two main sources are transport and power and heating plants.
Transport represented 57 per cent of total emissions in 2004. This means that the transport area is by far the largest source, and that road traffic alone represents 33 per cent of total NOx emissions.
Stationary incineration plants represent 41 per cent of total Danish sources. Power and heating plants alone represent 24 per cent and are thus the second-largest source.
Table 0.1 NOx emissions in '000 tonnes, 1985-2004.
| 1985 | 1990 | 1995 | 2000 | 2004 | |
| Stationary sources | |||||
| Power and heating | 126.58 | 95.69 | 88.20 | 47.64 | 49.09 |
| Offshore | 2.73 | 3.68 | 5.09 | 9.35 | 10.00 |
| Manufacturing and construction | 23.03 | 20.94 | 21.16 | 19.88 | 18.21 |
| - of this cement production | 6.92 | 6.48 | 9.10 | 9.95 | 9.44 |
| Other stationary plants | 2.53 | 1.40 | 1.39 | 1.10 | 1.09 |
| Transport | |||||
| Road traffic | 89.62 | 102.09 | 94.69 | 72.52 | 59.09 |
| - of this passenger cars | 54.22 | 59.65 | 51.70 | 35.11 | 25.31 |
| Offroad vehicles | 20.56 | 20.02 | 24.51 | 24.47 | 23.38 |
| National fisheries | 11.76 | 13.87 | 10.18 | 11.16 | 8.53 |
| Domestic air, rail and sea transport | 15.38 | 15.36 | 17.03 | 12.00 | 12.02 |
| Burning of fields | 0.99 | - | - | - | - |
| Total | 293.18 | 273.04 | 262.23 | 198.08 | 181.36 |
Source: NERI's report to UNECE, February 2006
Emissions from generation of electricity and heating went down by 61 per cent from 1985-2004. This is due, amongst other things, to the Statutory Order on reduction of sulphur dioxide and nitrogen oxides from power plants and the Air Guidelines' regulation of industrial plants. Emissions from power plants alone were reduced by 56 per cent in the period 1995-2004, down from 71,000 tonnes to 31,000 tonnes. Furthermore, there has been increased use of natural gas and wind power and energy efficiency has been improved through expansion of decentral combined heat and power, amongst other things.
The manufacturing and construction industries have reduced emissions by a total of approx. 20 per cent, but emissions from the cement industry increased approx. 36 per cent. Total emissions from the offshore sector have - despite the use of more energy-efficient gas turbines in newer plants - more than trebled because of a steadily increasing production of oil and gas in the North Sea. It should be noted that NOx emissions from the offshore sector in table 0.1 are over-estimated because they are calculated using an emission factor for flaring that has subsequently been adjusted downwards.
NOx emissions from road traffic fell by 38 per cent in the period 1995-2004 despite a heavy increase in the number of petrol cars. By far the largest contribution to this fall comes from the petrol cars, because they have been equipped with catalysts since 1990 to meet emission standards.
Even for those sources where emissions have increased the most, the period 1985-2004 showed a fall in NOx emissions compared to their activity level. In 2004, NOx emissions per produced unit for the three areas Power and heating, Passenger cars and Offshore has been reduced to 41 per cent, 31 per cent and 52 per cent respectively of the corresponding value for 1985.
Regulations of importance for NOx emissions
NOx emissions are regulated by a number of EU Directives covering both stationary and mobile sources.
Two EU Directives regulate emissions from stationary sources, i.e. Directive 96/61/EC concerning integrated pollution prevention and control (the IPPC Directive) and Directive 2001/80/EC on the limitation of emissions of certain pollutants into the air from large combustion plants (the LCP Directive). These two Directives are de minimis directives, i.e. the Member States are allowed to go beyond the provisions of the Directives.
The IPPC Directive requires environmental approval for enterprises that exceed a certain capacity, within energy generation, waste incineration and a number of industrial sectors. In the approval, limit values are set for emissions of pollutants into the air. Emission limits are set in a number of statutory orders directed at different types of plant, e.g. power plants, combustion plants, engines and waste incineration plants.
In addition to the direct regulation of individual sources, annual allowances are set for total NOx emissions from large electricity generation plants.
The offshore industry is not covered by the Danish Environmental Protection Act, and therefore there is currently no regulation of NOx emissions from the offshore industry.
The Emission Trading Directive could affect NOx emissions, although it does not regulate them directly. The change of the energy taxes for CHP plants also influences NOx emissions and improves the framework for a long-term wind turbine expansion.
The EU regulation of mobile sources consists of a number of directives on exhaust standards, the so-called EURO standards. There is total harmonisation for the regulation of mobile sources. Therefore, the Member States are not allowed to go beyond the provisions of the Directives, but only to advance their entry into force.
The EURO standards have been tightened several times since the introduction for passenger cars in the early 1970s. EURO standards have now also been adopted for motorcycles, mopeds, offroad vehicles and machines, leisure vessels and most recently for locomotives and vessels on inland waterways.
The International Maritime Organization (IMO) regulates emissions for ships, and the International Civil Aviation Organization (ICAO) regulates emissions for aircraft. New regulation of international shipping and air traffic is, however, underway in the EU. However, NOx emissions from international shipping and air traffic are not included in the national emissions inventory.
Projection of NOx emissions
The result of the calculations of expected NOx emissions for 2005-2030 can be seen in table 0.2.
NOx emissions from power plants generally show a downward trend. Specifically, a fall is expected until 2010 due to installations of de-NOx equipment, then a minor increase until 2015 after which emissions will fall again because gas is expected to replace coal as fuel to a certain extent. The extent of imports and exports of electricity is very important for emissions. It has been assumed that emissions from electricity exports after 2010 will become ever smaller because of increasing self-sufficiency rates in Sweden and Finland.
Despite the use of more energy-efficient gas turbines on newer platforms, NOx emissions from the offshore industry are expected to increase rapidly and be more than doubled from 2005 to 2015. A relatively high emission factor for offshore turbines and increasing energy consumption mean that the offshore industry will contribute up to 30 per cent of total emissions from stationary plants until 2030.
Because of the generally low emission factors for natural gas, NOx emissions from industrial plants are almost constant in the projection period although a slight increase in energy consumption is expected.
A large fall in emissions from mobile sources is expected. By far the largest reduction will be within road traffic (despite increased energy consumption) and for offroad vehicles. This is due to the constant tightening of emission requirements.
Fisheries are expected to have unchanged energy consumption and thus NOx emissions in the entire period 2005-2030, as the existing information does not suggest otherwise.
Table 0.2. Projection of NOx emissions for 2005-2030 in '000 tonnes for selected source categories
| Source category | 2005 | 2010 | 2015 | 2020 | 2025 | 2030 |
| Stationary sources | ||||||
| Electricity and district heating | 33.3 | 27.1 | 28.4 | 24.6 | 23.8 | 22.6 |
| Industry, incl. cement production | 13.0 | 11.6 | 11.7 | 11.5 | 11.5 | 11.5 |
| Offshore | 7.1 | 11.3 | 18.2 | 20.4 | 17.2 | 17.2 |
| Residential | 4.8 | 4.7 | 4.7 | 4.7 | 4.9 | 5.0 |
| Refineries | 1.9 | 1.9 | 1.9 | 1.9 | 1.9 | 1.9 |
| Commerce, institutions | 1.8 | 1.4 | 1.3 | 1.3 | 1.3 | 1.3 |
| Agriculture | 1.6 | 1.4 | 1.4 | 1.4 | 1.4 | 1.4 |
| Mobile sources | ||||||
| Road traffic | 56.8 | 38.2 | 24.5 | 17.4 | 14.5 | 13.7 |
| Offroad vehicles | 22.6 | 16.7 | 12.3 | 8.8 | 7.0 | 5.9 |
| Fisheries | 10.7 | 10.7 | 10.7 | 10.7 | 10.7 | 10.7 |
| Air, rail and shipping traffic | 11.3 | 9.4 | 9.5 | 9.4 | 9.5 | 9.5 |
| Total | 164.9 | 134.4 | 124.5 | 112.2 | 103.6 | 100.8 |
As can be seen from table 0.2, the difference between the emission ceiling in the NEC Directive and the Gothenburg Protocol of 127,000 tonnes in 2010 and the expected NOx emissions according to the calculations at hand and including the further reduction of the contribution from cement production is approx. 7,000 tonnes NOx.
Version 1.0 August 2006, © Miljøstyrelsen.