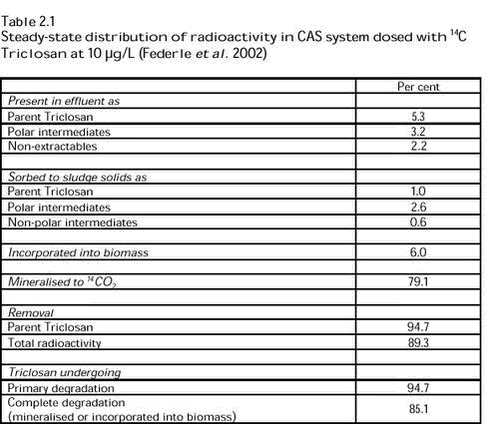
Fate and Effects of Triclosan2 Fate of Triclosan in wastewater treatment plants2.1 Studies of Triclosan degradation in laboratory tests2.1.1 Batch activated sludge mineralisation test 2.1.2 CAS test 2.2 Monitoring of Triclosan at wastewater treatment plants in the U.S.A. 2.3 Occurrence of Triclosan at wastewater treatment plants in Switzerland 2.4 Triclosan in samples of sludge and waste water from Swedish WWTPs 2.4.1 Sludge samples 2.4.2 Wastewater samples 2.5 Measurements of Triclosan at two Danish WWTPs 2.6 The relative quality of Danish WWTPs 2.7 Summary of the fate of Triclosan in WWTPs 2.1 Studies of Triclosan degradation in laboratory testsTriclosan is not readily or inherently degradable in standardised screening tests like OECD 301C (MITI I) or OECD 302C (MITI II). The negative results in these tests may be a consequence of the bacterial toxicity of Triclosan at the high substrate concentration required for these biodegradability screening tests. Therefore, a batch activated sludge mineralisation test and a continuous activated sludge (CAS) test were conducted by use of 14C-labelled Triclosan as radiotracer measurements allow the application of a relatively low, non-toxic concentration in mineralisation experiments (Federle et al. 2002). 2.1.1 Batch activated sludge mineralisation testTriclosan was uniformly 14C-labelled in the 2,4-dichlorophenoxy ring, which represents the most recalcitrant part of the molecule. The activated sludge mineralisation test was performed by use of activated sludge from the Avondale Sewage Treatment Plant in Avondale, Pennsylvania, which primarily receives domestic waste water. Triplicate samples of the sludge (1 L; 2,500 mg/L) were dosed with the test chemical and incubated in 2-L flasks, which were continuously mixed on a shaker at 22° ± 1.5°C. The head-space of each flask was continuously purged with CO2-free air, and evolved 14CO2 was trapped in 1.5 N KOH and quantified by liquid scintillation counting. Mineralisation of Triclosan began immediately in the batch activated sludge test, and the final recovery of 14 CO2 after 71 days attained 30.9%, 44.7% and 52.3%, for initial test substance concentrations of 20µg/L, 100µg/L and 200µg/L, respectively. Two of the 200-µg/L test systems were re-dosed with 1 mg/L and, following a lag period of 3 or 10 days, degradation proceeded, resulting in 78.9% and 80.9% of the second dose being recovered as 14CO2 after 52 days. 2.1.2 CAS testThe CAS systems were initially inoculated with activated sludge from either Avondale or Downingtown Regional Water Pollution Control Center, Pennsylvania, which also predominantly receives domestic waste water. Parallel systems, each consisting of a 6-L aeration chamber connected to a 2-L cylindrical clarifier with recycle discharge in the bottom and an effluent discharge tube at the side were used. The systems were incubated at 22° ± 2°C. Experiments were performed with groups of either two or five CAS systems. In each experiment, one of the systems served as a control unit receiving either waste water only or waste water and a constant influent concentration of Triclosan. The remaining systems received a mixture of waste water and variable influent concentrations of Triclosan. The radioactivity of Triclosan and its intermediates was quantified by liquid scintillation counting of samples of influent, effluent and sludge solids. The incorporation of 14C into constituents of biomass was determined by fractionation of extracted solids and quantification by liquid scintillation counting. Various experiments were conducted with CAS systems to examine the degradation of Triclosan and to study the effect of a shock loading with pulses of a high concentration of Triclosan. When the influent concentration of Triclosan was increased gradually from 40 to 2,000 µg/L, no intact 14C Triclosan was detected in the effluents of the CAS system, and removal of the parent compound exceeded 98.5%. The 14C present in the effluent consisted of polar intermediates, which were extractable into ethyl acetate (0.4-7.2%), and very polar intermediates, which could not be extracted with ethyl acetate (2.3-10.5%). At steady state, 76-90% of the added Triclosan was mineralised to14C CO2 whereas 2.2-6.8% of the labelled 14C was incorporated into the biomass. The amount of Triclosan sorbed to the activated sludge equalled 1.5-4.5% of the total 14C dosed to the influent. Primary degradation of Triclosan exceeded 94% whereas complete degradation (i.e. mineralisation and incorporation into biomass) exceeded 80% of the dosage in the influent. Approximately the same pattern was observed at lower concentrations of Triclosan, which were more representative of the actually expected concentrations in waste water (i.e. 7.5 to 50 µg/L). The fate and distribution of Triclosan added at 10 µg/L are shown in Table 2.1. Neither the removal of parent Triclosan or the mineralisation and formation of intermediates showed any correlation with the Triclosan concentration in the low concentration range. No adverse effects on the treatment process were observed at any influent concentration. Shock loading with Triclosan (i.e. 750 µg/L for 4 hours), which is representative of a situation in which a sewage treatment plant receives a consistent low level of Triclosan but with periodical pulses of higher levels, did not change the removal pattern significantly. In addition, the impact of shock loading of Triclosan on the operation of the CAS system was minimal and short term, as evidenced by changes in removal of solids, biological and chemical oxygen demand as well as nitrification.
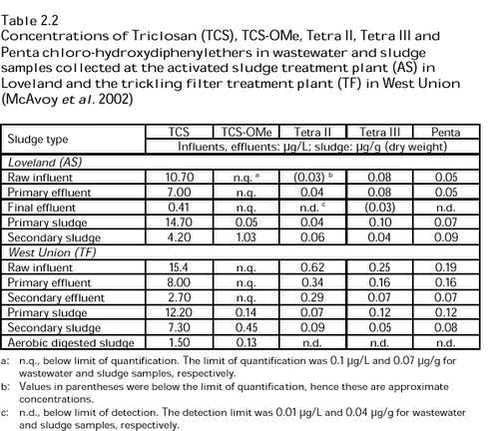
2.2 Monitoring of Triclosan at wastewater treatment plants in the U.S.A.A monitoring study was conducted with the purpose of obtaining field data that could be used for assessing the environmental exposure concentrations of Triclosan (McAvoy et al. 2002). In this study, samples of influent, primary effluent (when available) and final effluent were collected and analysed for Triclosan, a methylated byproduct of Triclosan and higher chlorinated closans, which may potentially be formed during wastewater treatment. The WWTPs selected for the monitoring of Triclosan included two activated sludge treatment plants (located in Columbus, Ohio and Loveland, Ohio) and two trickling filter treatment plants (located in Glendale, Ohio and West Union, Ohio). The wastewater samples were extracted and, following derivatisation, the samples were analysed by gas chromatography-mass spectrometry (GC-MS) (McAvoy et al. 2002). The substances included in the analyses were Triclosan, Tetra II (2,3’,4,4’-tetrachloro-2’hydroxydiphenylether), Tetra III (2,4,4’,5’- tetrachloro-2’hydroxydiphenylether), Penta (2,3’,4,4’,5’-pentachloro-2’hydroxydiphenylether) and Triclosan-OMe (2,4,4’-trichloro-2’-methoxydiphenylether). An evaluation of the analytical method showed that the average recovery (n = 4) of laboratory spiked sludge was > 79% of Triclosan, > 65% of Tetra II, > 91% of Tetra III, > 75% of Penta and > 70% of Triclosan-OMe. The concentrations of Triclosan in the influent waste water ranged between 3.8 and 16.6 µg/L (McAvoy et al. 2002). The authors explain this variation by the per capita water usage among the four communities, in which the individual WWTPs are located. The concentrations of Triclosan in primary effluent were reported to range between 3.4 and 8.0 µg/L while final effluent concentrations were 0.24-0.41 µg/L for activated sludge treatment and ranged from 1.6 to 2.7 µg/L for trickling filter treatment. A high overall removal of 95.4-96.2% of the influent Triclosan was seen at the activated sludge treatment plants, and this is in good agreement with the reported removals in laboratory CAS systems (Section 2.1; Table 2.1). The overall removal of Triclosan by trickling filter treatment was lower as the removals ranged from 58.0 to 86.1%. The higher chlorinated closans (Tetra II, Tetra III and Penta) were either not detected in influent and effluent waste water or were present at very low concentrations, generally <0.3 µg/L. The methylated product Triclosan-OMe was qualitatively detectable but the concentration was below the limit of quantification (0.1 µg/L) in all of the samples. The concentrations of Triclosan in sludge samples from the selected WWTPs ranged from 0.53 to 15.6 µg/g (dry weight), the sum of Tetra II, Tetra III and Penta ranged from the detection limit to less than 1 µg/g and Triclosan-OMe ranged from below quantification to 1.03 µg/g. The concentrations of Triclosan measured in sludge samples indicate that Triclosan is rapidly removed during the aerobic sludge digestion process (reduction from 12.2 µg/g in primary sludge to 1.5 µg/g in aerobically digested sludge at West Union; Table 2.2). However, at the trickling filter treatment plant in Glendale, little or no removal of Triclosan occurred during anaerobic sludge digestion as indicated by the presence of 7.5 µg/g in primary sludge and 15.6 µg/g in anaerobically digested sludge. This lack of anaerobic degradation of Triclosan has also been confirmed in laboratory studies (McAvoy et al. 2002). Table 2.2 presents the occurrence of Triclosan, Triclosan-OMe and higher chlorinated closans in waste water and sludges from the activated sludge treatment plant in Loveland and the trickling filter treatment plant in West Union.
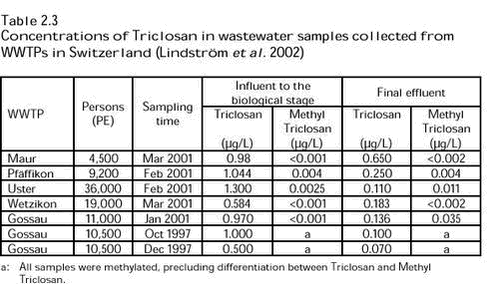
2.3 Occurrence of Triclosan at wastewater treatment plants in SwitzerlandTwenty-four-hour flow proportional samples of influent to the biological stage (effluent from the primary sedimentation) and of treated effluent emitted to rivers and lakes were collected from Swiss WWTPs in 1997 and 2001 (Lindström et al. 2002). The WWTPs are all modern 3- or 4-stage mechanical/biological/chemical plants serving populations from 4,500 to 36,000 persons. It was suspected that Triclosan might undergo biological methylation in WWTPs. Therefore, an analytical method was developed to distinguish between parent and methylated compounds. The samples were acidified for complete recovery of Triclosan by solid-phase extraction, ethylated, cleaned up and analysed for Ethyl Triclosan and Methyl Triclosan, the former compound representing parent Triclosan. Some of the WWTP samples were analysed directly for Triclosan and Methyl Triclosan without pH adjustment and derivatization. Furthermore, the samples collected in 1997 had been acidified, solid-phase extracted, and then methylated. The data from these samples included the combined amount of Triclosan and Methyl Triclosan. Aliquots of the sample extracts were analysed by GC-MS. Evaluation of the methods showed a recovery of Triclosan and Methyl Triclosan of 50-90% under acidic (pH ≈ 2) and neutral conditions (pH ≈ 7-8). Triclosan in the influent to the biological stage was found at concentrations of 0.6-1.3 µg/L and Methyl Triclosan was detected in much lower concentrations, from <0.001 to 0.004 µg/L. The corresponding effluent concentrations were between 0.11 and 0.65 µg/L (Triclosan) and <0.002 and 0.011 µg/L (Methyl Triclosan) (Table 2.3). The higher concentrations of Methyl Triclosan in the effluent than in the corresponding influent indicate a formation of this compound during the biological treatment.
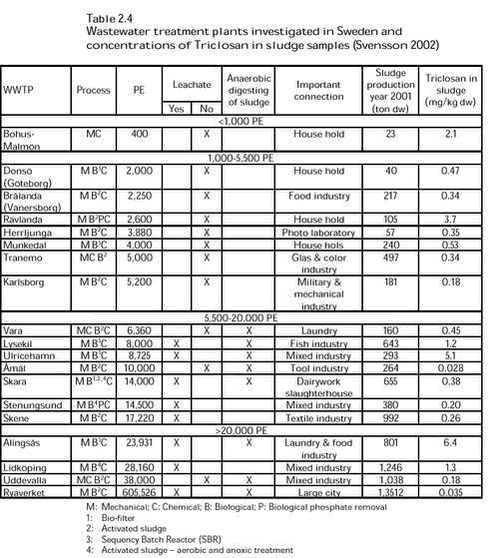
There is no information about the type of biological treatment process or other process conditions during the sampling except the flow rate. Therefore, it is not possible to draw any conclusions regarding the influence of the wastewater treatment process on the removal rate of Triclosan. The lowest removal is, however, found in the small size WWTP Maur. 2.4 Triclosan in samples of sludge and waste water from Swedish WWTPs2.4.1 Sludge samplesSludge from 19 WWTPs was sampled during 2001-2002 and analysed for a series of organic pollutants including Triclosan. The samples were collected from WWTPs of different size and geographic location. Furthermore, the WWTPs were selected to obtain loadings with variable types of industrial waste water. Only one sludge sample was collected from each WWTP. The samples were generally taken from freshly produced and stabilised sludge (Svensson 2002). The concentration of Triclosan in the sludge ranged from 0.028 to 6.4 µg/g d.w. (Table 2.4). The lowest concentration was found in a WWTP consisting of a mechanical process followed by an activated sludge treatment and a chemical precipitation (the Åmål plant). The highest concentration was found in a plant, in which the biological treatment process consisted of a bio-filter. The Triclosan concentration was generally between 0.2 and 0.5 µg/g d.w. in WWTPs with the activated sludge treatment. A concentration of 3.7 µg/g d.w. was, however, seen in Rävlanda WWTP receiving waste water from households only. A Triclosan concentration of 0.04 µg/g d.w. was found in the sludge sample taken from the largest of the investigated WWTPs (Ryaverket), which is treating waste water from approx. 600,000 persons.
The data do not allow further assessment of the influence of the treatment process on the concentration of Triclosan in sludge. There are no parallel analyses of influent and effluent waste water and it is not possible to evaluate whether e.g. a high sludge concentration is due to a high loading rate of Triclosan or the type of treatment process. Another investigation of sludge samples from four Swedish WWTPs in 2001 showed Triclosan concentrations between 2.8 and 4.4 µg/g d.w. in anaerobically digested sludge (Remberger et al. 2002). This is within the range found in the investigation of the nineteen WWTPs presented above. For one of the WWTPs (Bromma), both a primary and an anaerobically digested sludge sample were analysed. The results of these analyses supported the findings in the study performed by McAvoy et al. (2002) that little or no removal of Triclosan occurs during anaerobic digestion. 2.4.2 Wastewater samplesIn 1995, one-month composite samples of influent and effluent from six Swedish WWTPs of different size were collected and analysed for Triclosan and other organic compounds (Paxéus unpublished). The composite samples were prepared by combining daily random samples or daily flow proportional samples of the waste water. Three groups of WWTPs were represented:
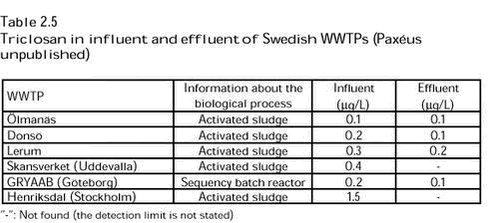
The Triclosan concentrations of the influent (0.1-1.5 µg/L) were higher than in effluent samples (up to 0.2 µg/L) as shown in Table 2.5. The lowest influent concentration was found in the small-size WWTPs while the highest concentration was found in the large WWTPs in Stockholm loaded with waste water from larger industries including fabricated metal production, pharmaceutical and circuit board production. Paxéus concluded that the removal of organic compounds in the treatment process appears to be independent of the WWTP size. Considering the removal of Triclosan from the water phase of the six Swedish WWTPs, it is, however, obvious that the highest removals are obtained in the medium-sized WWTP Skansverket and the large WWTP Henriksdal.
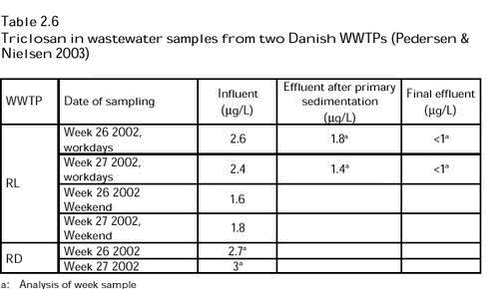
2.5 Measurements of Triclosan at two Danish WWTPsSeveral monitoring programmes have been running at the Danish WWTPs Renseanlæg Lynetten (RL) and Renseanlæg Damhusåen (RD) in Copenhagen. The plants serve the population and the industries in the area of Copenhagen and the capacities of RL and RD are approx. 750,000 and 350,000 PE, respectively. Both plants are modern WWTPs with biological wastewater treatment based on the activated sludge process and fully upgraded to nitrogen and phosphate removal. Analysis of Triclosan was included in the monitoring programme performed in June - July 2002. Samples of waste water were collected from the influent, the effluent of the primary sedimentation and the final effluent at RL and from the influent at RD. All samples were 24-h flow proportional samples collected and analysed after mixing either as whole week samples or as Saturday-Sunday and Monday-Friday samples. The wastewater samples were acidified and extracted with dichloromethane. Then the extracts were dried over sodium sulphate and analysed by GC-MS. The limit of detection was 1 µg/L The average Triclosan concentration in the influent samples of RL was 2.5 µg/L in the workday samples and 1.7 µg/L in the weekend samples. The concentration seems to be reduced significantly during the primary sedimentation process indicating that Triclosan is removed by sorption. In the effluent of RL, no concentration of Triclosan vas found above the detection limit.
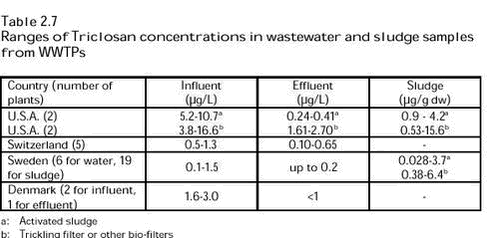
2.6 The relative quality of Danish WWTPsThe monitored U.S. WWTPs represent two different types of biological treatment, i.e. activated sludge and trickling filter. The data from Switzerland originate from 3- or 4-stage modern WWTPs of different size and all with biological treatment. However, the type of biological treatment is not described. In Sweden, the reported monitoring studies were performed mainly at WWTPs with activated sludge or bio-filter. The monitoring of sludge included WWTPs with and without primary sedimentation and WWTPs with capacities between 400 and 600,000 PE. Nutrient removal was included at some but not all of the Swedish WWTPs. Danish WWTPs were represented by a single monitoring study of a modern treatment plant based on the activated sludge process and upgraded to nutrient removal. Activated sludge treatment represents the major part of treated wastewater flows in Denmark. It is obvious that the best removal of Triclosan in the U.S. plants is obtained in the activated sludge treatment. The examined plant -located in Loveland - has a capacity of approx. 27,000 PE. The plant receives mainly municipal waste water (industrial flow contribution <1%), has a total hydraulic retention time of approx. 6 h, with approx. 3 h in the aeration basin and its effluent BOD5 and total suspended solids (TSS) concentrations are generally <5 mg/L. During the study, the BOD5 and TSS removal were very high (98.3% and 96.5%, respectively) and the plant thus represents a very well-functioning activated sludge plant with high removal efficiency. The Loveland plant was probably not upgraded for nutrient removal, which is the case for the WWTPs treating the major part of the municipal waste water in Denmark (approx. 90% (Danish EPA 2001)). Generally, both the hydraulic retention time (HRT) and the sludge retention time (SRT) are increased when a plant is upgraded for nutrient removal. This would eventually increase the time of biodegradation and of establishing a microbial population capable of degrading Triclosan. The lower effluent concentrations found in the monitoring studies in Switzerland and Sweden could be the results of a longer treatment period in the biological step but also a result of a lower loading with Triclosan. The results obtained in Sweden indicate that the highest removal is obtained in the larger WWTPs. However, the limited information and data material from the presented monitoring studies in Switzerland, Sweden and Denmark do not allow a more detailed evaluation concerning the role of the treatment process. It is expected that the efficiency of Triclosan removal in the majority of the Danish WWTPs (upgraded for nutrient removal and with high effluent quality) would be at the same level as in the Loveland plant or even better. The influent concentrations of Triclosan at the Danish WWTPs are higher than the concentrations measured in Switzerland and Sweden. This could lead to the conclusion that the Triclosan concentration in the effluents of Danish WWTPs might be higher than in Switzerland and Sweden. Based on the limited Danish analytical data, it is, however, not possible to draw any conclusions regarding the general level of Triclosan in WWTP effluents in Denmark. It is expected that the discharge of Triclosan from the WWTPs is dependent on the loading of Triclosan, the type of treatment plant and the operational conditions. Therefore, the concentrations of Triclosan in effluents from plants with e.g. only mechanical treatment or mechanical-chemical treatment will probably be higher than the concentrations in effluents from plants with biological treatment. In Denmark, waste water discharged from WWTPs without any biological treatment constituted, however, less than 2% of the total amount in 1998 (Danish EPA 2000). As mentioned above, the HRT and SRT may influence the overall efficiency of Triclosan removal together with parameters like temperature, loading rate and sludge treatment. Different sludge treatments were used at the WWTPs reported above. The highest removal of Triclosan was achieved when the sludge was aerobically digested while only negligible removal was seen during anaerobic digestion. The highest Triclosan concentration (16 µg/g d.w.) was found in a U.S. WWTP with trickling filter and anaerobic sludge treatment. The influent concentration of Triclosan at this WWTP was 3.8 µg/L and thus slightly above the influent concentration found at a Danish WWTP (RD) (approx. 3 µg/L). Therefore, it is not possible to exclude that Triclosan concentrations in sludge at this level (16 µg/g d.w.) might be found at local small size WWTPs in Denmark. However, the main part of the Danish sewage sludge would probably contain Triclosan in concentrations close to the level in the activated sludge plants in Sweden and the U.S.A. (0.028-4.2 µg/g d.w.). 2.7 Summary of the fate of Triclosan in WWTPsThe reviewed studies showed that Triclosan is degradable under aerobic conditions in WWTPs. Furthermore, the monitoring studies indicated that only little or no removal of Triclosan occurred during anaerobic sludge digestion. Degradation experiments in CAS laboratory systems showed that Triclosan was extensively degraded and removed in activated-sludge systems. The ranges of Triclosan concentrations in influent, effluent and sludge obtained by the presented monitoring studies at WWTPs in the U.S.A., Switzerland, Sweden and Denmark are summarised in Table 2.7.
Based on the limited number of observations available, it seems that influent concentrations of Triclosan are higher in the U.S.A. than in Europe. The Triclosan removal was better in the best U.S. WWTP than in the Swiss plants while the removal in the Danish plant cannot be evaluated due to a high limit of detection. Based on information on Danish WWTPs, it is considered likely that most Danish effluent waste water and most Danish sewage sludge will contain concentrations of Triclosan at the level of the lowest values presented in Table 2.7. Only at small local WWTPs, effluents and sewage sludge will attain the level of the lower technology foreign plants. |
