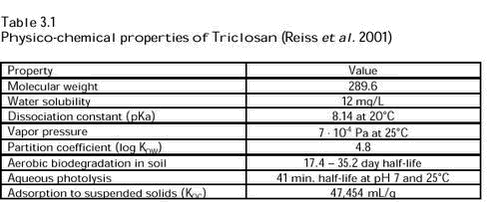
Fate and Effects of Triclosan3 Aquatic risk assessment of Triclosan3.1 Fate of Triclosan in aquatic environments3.1.1 Triclosan concentrations in U.S. rivers 3.1.2 Triclosan concentration in surface water and sediment in Sweden 3.1.3 Occurrence of Triclosan in surface water in Switzerland 3.1.4 Photochemical transformation of Triclosan in surface water 3.1.5 Triclosan at the discharge point of WWTPs 3.1.6 PEC for the aquatic compartment 3.2 Effects of Triclosan in aquatic environments 3.2.1 Toxicity 3.2.2 Bioaccumulation in fish 3.3 Risk assessment of Triclosan in surface water 3.1 Fate of Triclosan in aquatic environments3.1.1 Triclosan concentrations in U.S. riversThe results presented in Chapter 2 of the monitoring of Triclosan in wastewater treatment plants (WWTPs) in the U.S.A. have shown Triclosan concentrations in wastewater effluent from 0.24 to 2.7 µg/L (McAvoy et al. 2002). Therefore, there is a potential risk of adverse effects in aquatic environments caused by Triclosan discharged from WWTPs. A probabilistic assessment has been performed with the purpose of determining the frequency at which Triclosan river concentrations might exceed levels of ecological concern (Reiss et al. 2001). The majority of the U.S. WWTPs discharges their effluent to rivers. Therefore, only discharges to rivers were included in the analysis. Discharges to e.g. oceans and lakes as well as septic system discharges were assumed to have a smaller ecological impact than the river discharges. The probabilistic assessment was based on a compilation of all U.S. WWTP data (U.S. EPA in 1996) and a series of databases of national hydrological data, which uniquely identify and interconnect the stream segments or reaches that comprise the U.S. surface drainage system. The hydrological databases include data on the volume of flow, stream velocity, width, depth and pH. Data on the stream reaches, into which the WWTPs discharge, were obtained. Risk estimates were calculated for mean flows and low flows of 11,010 and 9,860 WWTPs, respectively. For the mean flow dilution of WWTP effluent, the lower 5th, 10th and 50th percentiles were 15, 33 and 583, respectively, while the lower 5th, 10th and 50th percentiles were 1.0, 1.4 and 27 for the low dilutions. These dilutions were calculated for a situation in which the waste water is completely mixed with the receiving water. However, for toxic substances, a different approach should be used since critical environmental conditions may occur near the discharge before complete mixing with the receiving water (U.S. EPA, 1991; Tørsløv et al. 2002). Triclosan concentrations measured in two activated sludge treatment plants and two trickling filter treatment plants located in Ohio (McAvoy et al. 2002) were used for the assessment. It was assumed that the influent concentration was independent of the treatment type or percentage removal and it is stated that one of the five influent concentrations found by McAvoy et al. (2002) was chosen for each treatment plant. However, there is no description of how this selection of the influent concentration was made. The removal percentages of Triclosan from the 11,010 WWTPs were selected among the data obtained in Ohio depending on the treatment system used in the specific WWTPs and used to calculate an effluent concentration. The physico-chemical properties of Triclosan were evaluated and data were selected for estimation of environmental exposures at the discharge point of a WWTP (Reiss et al. 2001). The removal of Triclosan by sorption to organic matter, i.e. through contact with the suspended solids from the wastewater effluent, with the suspended sediment and with the dissolved organic carbon from the river, was considered for the estimation of the exposure concentration at the discharge point. The pKa of Triclosan is 8.14 at 20°C and a significant amount of the substance may be found in ionised form in the water bodies. The ionisation of Triclosan was considered and it was assumed that only the unionised Triclosan sorbs to the organic matter. The Triclosan dissipation downstream was estimated using standard first-order kinetics. A first-order rate constant, k, of 0.054 hour-1 was used. The constant was estimated based on a river die away study by Morral et al. (not dated) and corrected for dilution. This study by Morral et al. is, however, still unpublished and has not been available for the present evaluation. The physico-chemical properties collected by Reiss et al. (2001) are summarised in Table 3.1.
The following aspects were either not considered significant for the estimation of the exposure concentrations or data were not available (Reiss et al. 2001):
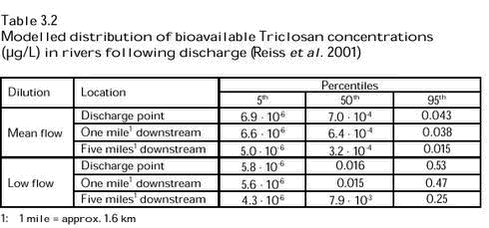
The estimate used for the suspended solid concentration of effluent at 5 mg/L is conservative. The recommended concentration of a WWTP effluent in Europe is 30 mg/L for a generic risk assessment (European Commission 2003). Suspended sediment and the dissolved organic carbon data for stream reaches were obtained from national water-quality monitoring networks in the U.S.A. Finally, the organic carbon content of the suspended sediment was estimated on the basis of a log-linear relationship obtained by using 131 sets of measurements in U.S. rivers. The available data on the dissipation of Triclosan during the river die-away study by Morral et al. and the water velocity in each stream reach were used to estimate the dissipation of Triclosan in the stream reaches at one and five miles downstream from the discharge point of the WWTPs. The results of the modelling are summarised in Table 3.2.
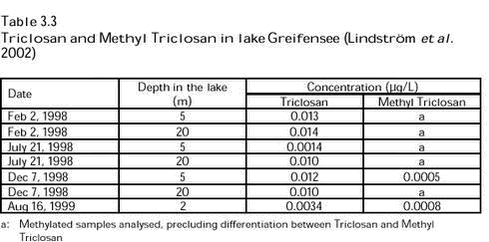
One significant uncertainty is the possibility of Triclosan discharges from several point sources into the same water body, which was not considered. This problem is discussed by Reiss et al. (2001) leading to the conclusion that accumulation may occur in some rivers, which is, however, not likely to be a major problem even in the most vulnerable rivers. Another critical point is that it is not possible to assess whether the combination of influent concentration and WWTP is reasonable. Furthermore, the removal rate of a substance in a WWTP may not only depend on the type of the biodegradation process (e.g. activated sludge or trickling filter) but also on the overall design of the plant, operational conditions, characteristics of the biomass etc. 3.1.2 Triclosan concentration in surface water and sediment in SwedenWater samples from three cost stations located at Stenungsund in Sweden were analysed for Triclosan as part of an investigation of the environmental fate of Triclosan and tetrabromobisphenol A in Sweden. Stenungssund represents an area with an extensive chemical production and heavy industry. Triclosan was only detected at one of the stations in a concentration at 160 ng/L in a bottom sample taken very close to the industrial area. Apparently, the concentrations at the other stations were very low (< 2 ng/L) (Remberger et al 2002). It should be mentioned that the report by Remberger et al. (2002) does not include details regarding sampling procedures or analytical methods so it has not been possible to evaluate the quality of the investigations. Samples of sediment were taken from the same three stations at Stenungssund and near to a closed wood preservation plant at Boro in the municipality of Vetlanda. Triclosan was found in sediment samples from all three locations at Stenungssund. The concentrations ranged between 8 and 17 µg/kg d.w., which indicates that Triclosan may be accumulated in the sea sediment. The Triclosan concentration in sediment samples down stream from Boro was 2-25 µg/kg d.w. while < 2 µg/L was found at a reference station at Boro (Remberger et al. 2002). 3.1.3 Occurrence of Triclosan in surface water in SwitzerlandWater samples from the lakes Greifensee, Zürichsee and Jörisee were analyzed for Triclosan and Methyl Triclosan (Lindström et al. 2002). Both Greifensee and Zürichsee receive considerable inputs from WWTPs. Additionally, samples taken from the river Glatt at its source (Greifensee) and its fall into the river Rhine were analysed. The principle of the analytical procedure used in the investigation is presented in the Section 2.3 above. Triclosan was detected in the lakes Greifensee and Zürichsee in concentrations up to 0.014 and 0.0031 µg/L, respectively, but remains undetected (<0.0004 µg/L) in the mountain lake Jörisee. The analyses of the water samples from the river Glatt showed Triclosan concentrations of 0.011 µg/L (source) and 0.074 µg/L (outfall). The river Glatt receives waste water from a population of 260,000. An estimation of the emission of Triclosan and Methyl Triclosan into the river Glatt showed a total input of Triclosan to the river between its source and outfall corresponding to 2.8 g/10,000 PE/day. This was found to be in reasonable agreement with the data obtained from the examination of individual WWTPs (Section 2.3). Estimates of the expected load of Triclosan entering Greifensee and Zürichsee and the resulting concentrations in the lakes showed that the actual concentrations were much lower than the expected concentrations of 0.050 and 0.008 µg/L, respectively. This together with observation of seasonal variations of the concentrations in different layers of the lakes indicated removal by photochemical transformation (Table 3.3). As a result of these observations, experiments with photolysis were performed (see Section 3.1.4).
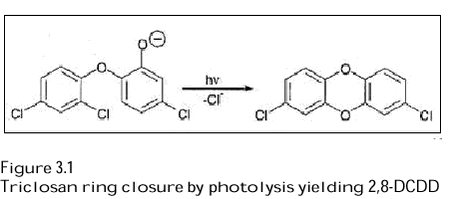
The removal of Triclosan and Methyl Triclosan in Greifensee was simulated using photolysis rates of Triclosan obtained in laboratory experiments and including removal by sorption/sedimentation. A dynamic lake model was set up based on a previous model developed to describe the behaviour of other organic pollutants in Greifensee. The results of the model calculation were consistent with the measured data indicating a pronounced seasonal variation in Triclosan concentration near the lake surface as a consequence of seasonally varying sunlight intensity (Lindström et al. 2002). 3.1.4 Photochemical transformation of Triclosan in surface waterA rapid removal of Triclosan was observed in the lake Greifensee in the investigation 1998-1999 by Lindström et al. (2002). The removal rate in the lake could not be explained by removal by sorption/sedimentation only. Indications of photochemical transformation being a further removal process came from Triclosan measurements at different depths in Greifensee (Table 3.3). An experiment was therefore carried out in which Triclosan and MethylTriclosan were exposed to natural sunlight in fortified lake water at different pH values. Neither Triclosan nor Methyl Triclosan were transformed at pH 5.6. Triclosan was, however, transformed at pH 8.0 whereas Methyl Triclosan was still not transformable. A parallel experiment performed at pH 8.0 in distilled water showed that the transformation of Triclosan was independent of the presence of natural organic matter and other water constituents. The results indicate that Triclosan is transformed via direct photolysis and that the dissociation of Triclosan governs its susceptibility to photooxidation. The transformation of Triclosan followed first order kinetics. At pH 8, the rate constant (2.7 h-1) was similar to that of dichlofenac, which was used as a reference compound. The photolysis experiment of Lindström et al. (2002) was carried out under clear sky conditions on 23 August 2001. The experimental conditions and the data evaluation are described in a previous investigation and are, therefore, not included in the present report. Triclosan has previously been detected in rivers along with structurally related compounds, including 2,8-dichlorodibenzo-p-dioxin (2,8-DCDD), which was hypothesized to be derived from the synthesis of Triclosan (e.g. Lopez-Avila & Hites 1980 quoted by Latch et al. 2003). Based on these considerations, the finding of the loss of Triclosan in Lake Greifensee and the general concern about dioxins in the environment, a study of the photochemical behaviour of Triclosan was performed (Latch et al. 2003). The influence of pH and irradiation wavelength on the reaction was studied in buffered solutions of osmosis-purified laboratory water. Furthermore, an investigation of the importance of the reaction under environmental conditions was performed in natural water taken from the Mississippi River. Aqueous solutions of Triclosan (3.5-76 µM) exposed to air in quartz bottles were irradiated in a merry-go-around reactor with filtered light (>280, >290 (Pyrex) or >320 nm). The experimental temperature is not stated. Small aliquots of samples were withdrawn at intervals for analyses of the kinetics, and substrate decay and product growth were determined by High Performance Liquid Chromatography (HPLC) analysis. Rate constants were determined from a least-squares fit of the data to numerically integrated solutions of differential equations. The presence of dioxin in the irradiated samples was confirmed by GC-MS, HPLC (UV absorbance) and Nuclear Magnetic Resonance (NMR) spectroscopy. The results showed that the ring closure to 2,8-DCDD was obtained in aqueous solution buffered at pH 8 or above (Figure 3.1). The quantum yields for Triclosan transformation (ΦT) and 2,8-DCDD formation ( ΦD) were found to be sensitive to pH (pKa of Triclosan is 7.9) suggesting that the phenolate form is the photoreactive species.
The transformation yields (ΦD/ ΦT) varied with pH and irradiation wavelength but were within the range of 1-4.6% at pH 8 (relevant for most Danish water bodies) and up to 12% at pH 11.5 (not realistic for Danish conditions). This indicates that conversion to 2,8-DCDD is a significant loss process but not the dominant one. Polymers derived from Triclosan are likely to be the main reaction products of a photolysis. The dioxin product 2,8-DCDD is further phototransformed. The decompostion products have, however, not been identified. They may include dechlorinated congeners or rearranged products (Latch et al. 2003). The transformation quantum yield of 2,8-DCDD was 2-20 times lower than the apparent quantum yield. The photolysis investigations with Mississippi water confirmed the finding in the buffered solutions indicating that Triclosan is likely to be converted to dioxin in sunlight-irradiated surface waters. Environmental risk assessments of the transformation products of Triclosan are outside the scope of this report and not included here. However, a simple “very worst case” calculation of a possible environmental concentration of 2,8-DCDD resulting from photolysis of Triclosan can be based on the local PEC values for Triclosan derived in Section 3.1.5 (PEClocal surface water 0.009-1.26 µg/L) and the transformation of Triclosan to 2,8-DCDD at the relevant pH of 8 (4.6%). This gives concentrations of the dioxin in the range of 0.0004-0.06 µg/L. Such a transformation can, however, only be expected in the upper water layers due to sorption of light in the water column and, therefore, dioxin concentrations in the entire water column are expected to be lower. In terms of human toxicology, 2,8-DCDD does not have “the dioxin effect", because it is not bound to the so-called dioxin receptor (Ah-receptor) in the human body. This is in line with the fact that the WHO has not assigned any dioxin toxicity equivalent to this substance (van den Berg et al., 1998) and with the fact that it was not included in the latest EU human risk assessment of dioxines (SCF 2000, 2001). 3.1.5 Triclosan at the discharge point of WWTPsThe Danish EPA recently published recommendations for the establishment of requirements to and regulation of hazardous substances in waste water (Tørsløv et al. 2002). In this publication, it is recommended to define a mixing zone on the basis of a dilution, which is achieved for the discharged waste water within a specific distance from the out-fall. As a starting point, a dilution factor of 2-10 may be chosen for watercourses and chronic criteria must be met at the edge of the mixing zone. Furthermore, protection against acute adverse effects of isolated peak concentrations of the substance should be ensured, e.g. by fixing a maximum value for the discharged concentration of a substance. A concentration range of Triclosan in surface water (Clocalwater) was estimated using the mixing zone approach mentioned above, the principles of the EU Technical Guidance Document (European Commission 2003) and the effluent data of WWTPs presented in Chapter 2. It was assumed that the concentration of Triclosan would be between 0.10 and 0.65 µg/L in effluents from modern WWTPs of the activated sludge type while the effluents from low technology WWTPs could reach concentrations of 1.6-2.7 µg/L (Table 2.7). The local concentration in surface water was calculated as follows (European Commission 2003):
The calculation resulted in concentrations of Triclosan in surface water between 0.009 and 0.303 µg/L at the edge of the mixing zone for high technology plants and between 0.149 and 1.26 µg/L for low technology plants. For the high technology plants, the estimated concentration range is within the range obtained in the probabilistic assessment made by Reiss et al. (2001) (6.9 · 10-6 to 0.53 µg/L) at the discharge point even if it is at the upper end. For the low technology plants, the estimated concentrations exceed the maximum value of Reiss et al (2001). Furthermore, the lowest concentration for the mixing zone is a factor of 1,348 higher than the 5th percentile found in the probabilistic assessment. In the probabilistic assessment, this very low concentration is caused by the use of dilution factors of up to 48,700 (the highest 95th percentile). The Triclosan concentrations of the Swiss river Glatt (0.011-0.074 µg/L) as well as the maximum concentrations of 0.16 µg/L found in Swedish surface water and of 0.014 µg/L in the Swiss lake Greifensee are within the concentration range obtained by the above EU TGD calculations (0.009-1.26 µg/L). The concentrations of Triclosan in the lake Zürichsee (maximum of 0.0031 µg/L) are, however, below the estimated values. Based on this, the concentration estimates are considered to be realistic worst case estimates. Considerable dilution in the water body will, however, take place in most Danish waters, because only very few WWTPs discharge into small water courses with a dilution as low as 2-10, while most others discharge into the sea (Danish EPA 2001). Therefore, for most of the Danish waste water, the dilution is expected to be a factor of 10-50. 3.1.6 PEC for the aquatic compartmentThe most conservative estimates of predicted Triclosan concentrations in the aquatic environment resulted from application of the principles of the EU TGD (European Commission 2003) and those of the Danish EPA (Tørsløv et al. 2002). Therefore, the estimation of the predicted local environmental concentration for surface water (PECsurface water ) was based on these results: PECsurface water : 0.009-0.303 µg/L for high technology plants It shall be noted that a potential background concentration of Triclosan was not included in the PECsurface water . 3.2 Effects of Triclosan in aquatic environments3.2.1 ToxicityThe available literature regarding the toxicity of Triclosan to aquatic organisms comprises the following studies:
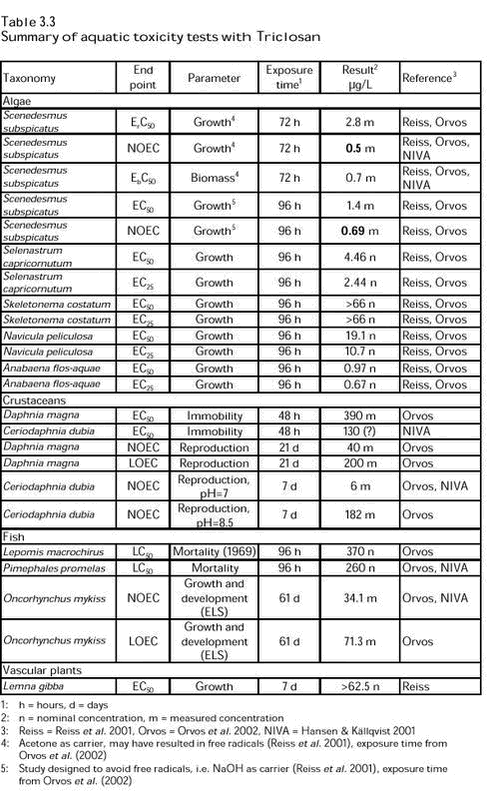
Results of toxicity and bioaccumulation tests quoted in this literature are summarised in Table 3.3. Below, the papers are summarised with respect to the possibilities of evaluating the quality of the studies, which they quote. In the NIVA report, Hansen & Källqvist (2001) quote results of toxicity tests with algae, crustaceans and fish, reported by CIBA and collected from Internet available databases. Apart from a discussion of the results of the test showing the lowest EC 50 value (algal growth inhibition), the quality of the studies/reports is not evaluated. The algal growth inhibition test under discussion was conducted with one of the species, which are recommended in international test guidelines like the OECD TG No. 201; Pseudokirchneriella subcapitata (formerly called Selenastrum capricornutum). The test procedure followed international guidelines except for the fact that measurements of algal populations were made only at the start and at test termination, which was after 96 hours as opposed to the recommended 72 hours for algal growth inhibition tests. Hansen & Källqvist (2001) conclude that a calculated ErC50 value of 15.7 µg/L after 96 hours will be rather close to the corresponding value, which could have been obtained after 72 hours. In addition to the data presented in Table 3.3, Hansen & Källqvist (2001) quotes data from safety data sheets and toxicity data, which are not measured after the standardised exposure periods. These data are all higher by up to one order of magnitude than the data presented in Table 3.3. The review paper by Orvos et al. (2002) summarises a series of fate, bioaccumulation and toxicity studies with Triclosan in detail. It is stated that all the toxicity tests conformed to Good Laboratory Practice procedures as prescribed by either the OECD or the U.S. EPA. However, not all tests were conducted according to international or national (U.S.) guidelines although most tests were based on such guidelines (developed for testing of chemicals or effluents) from the OECD, the U.S. EPA or the ASTM. Most tests were conducted under semi-static or flow-through conditions. The results of most tests were presented as measured concentrations. Therefore, these studies must be considered as being high quality studies. Studies with synthetic secondary effluent from laboratory scale CAS units, to which Triclosan had been added or not, were conducted with fish (Pimephales promelas) and crustaceans (Ceriodaphnia dubia). The methods applied were U.S. EPA methods for testing of effluents. The results of these tests showed no difference between effects of effluent from CAS systems with and without Triclosan, indicating that Triclosan had been degraded and/or sorbed in the CAS systems. Experimental details and results of the standard toxicity tests are summarised in Table 3.3. Reiss et al. (2001) focus on the integration of results of fate and effects studies in a probabilistic risk assessment of Triclosan. Therefore, data quality is not evaluated. However, in this paper, the same studies as reviewed by Orvos et al. (2002) are used and reference is made to original study reports. From this paper, it is obvious that most studies were carried out during the 1990s by laboratories known to be GLP contract laboratories. Therefore, this paper supports the above conclusions that these studies were high quality studies. In Table 3.3, the studies quoted by Reiss et al. (2001) are indicated.
The toxicity database for Triclosan is comprehensive and most studies referred in Table 3.3 seem to be high quality studies. The database comprises L/EC50 values from acute toxicity tests with the three main groups of aquatic organism (algae, crustaceans and fish) as well as NOEC values from chronic tests with organisms from all three taxonomic groups. According to the EU TGD (European Commission 2003), this justifies the estimation of a Predicted No Effect Concentration (PNEC) by dividing the lowest NOEC value by an application factor of 10. However, the choice of the lowest NOEC value is not evident. The discussion of Reiss et al. (2001) points to the fact that the lowest value of 0.5 µg/L (from an algal test with acetone as the solvent) may be overestimating the toxicity of Triclosan due to the possibility of acetone inducing formation of free radicals by photolysis. According to these authors, the NOEC value obtained with sodium hydroxide (0.69 µg/L) is more realistic. This test, however, raises another problem (as pointed out by Hansen & Källqvist (2001) who did not have access to the other study), viz. that the exposure time in the test with sodium hydroxide (96 hours) is deviating from the standard exposure time of 72 hours. In their discussion, Hansen & Källqvist (2001) emphasize that it is not possible to estimate whether a 72-hour effect concentration would be higher or lower than one measured at 96 hours. Therefore, the NOEC value estimated after the standard exposure period (72 hours) is preferred for the PNEC derivation. The lowest NOEC value is thus 0.5 µg/L and the assessment factor is 10, which results in a PNEC = 0.05 µg/L of Triclosan in freshwater aquatic environments. For marine water, only data from a single test with the marine alga Skeletonema costatum are available. The results of the test (nominal concentration) are not feasible for calculation of a PNEC value as both EC50 and EC25 are given as >66 g/L. Therefore, only data for freshwater environments are used. 3.2.2 Bioaccumulation in fishOrvos et al. (2002) refer a bioaccumulation study with zebra fish (Danio rerio) as being conducted according to methods modified from OECD TG 305C in a continuous flow system. Accumulation and depuration periods were five and two weeks, respectively, and results were based on measured exposure concentrations (3 and 30 µg/L). From this study, bioaccumulation factors (BCF) and depuration rates were calculated at the two exposure concentrations. At 3 µg/L, BCF = 4157 and, at 30 µg/L, BCF = 2,532. The depuration rate constants were 0.142 and 0.141/day, respectively. Hansen & Källqvist (2001) quote results from the Japanese MITI database, showing lower values with Cyprinus carpio: BCF: 2.7-44 and 15-90 at 3 and 30 µg/L, respectively. Furthermore, they quote data from a safety data sheet stating BCF values of 3,730-8,400. With the highest BCF values exceeding 500, Triclosan is considered to be bioaccumulative. The possibility of finding Triclosan in biota is confirmed by the results obtained in an investigation of twelve different locations in Sweden (Remberger et al 2002). Analyses of samples of different aquatic species showed concentrations ranging from < 0.1 to 13 µg/kg wet weight. 3.3 Risk assessment of Triclosan in surface waterFor surface water, the risk quotients based on the above PEC and PNEC values can be calculated as summarised in Table 3.4.
Based on the results of the test with the most sensitive species (the alga Scenedesmus subspicatus) and on PEC values, which are derived from Triclosan concentrations in U.S., Swedish and Swiss waste water, the risk quotients for surface water are > 1 for low technology WWTPs and for some of the high technology plants. However, with respect to the PEC values, it was concluded in section 2.7 that only at small local WWTPs, effluents and sewage sludge will attain the level of the lower technology foreign plants and for most waste water discharges from Danish WWTPs, the dilution will be considerably higher than 10. Therefore, Triclosan is not expected to cause effects in surface water unless discharges are from low technology plants to waters with low dilution. Most Danish WWTPs are high technology plants but the present information on concentrations of Triclosan in Danish waste water is from only one WWTP and is, furthermore, based on a rather high detection limit (1 µg/L). Therefore, no conclusions can be drawn regarding Danish conditions. Simple calculations – e.g. with an effluent concentration of <1 µg/L and the use of dilution factors of 2-10, resulting in PEC values in the range <0.5-<0.1 µg/L and risk quotients of <2 - <10 – indicate that, in general, the risk from Triclosan in Danish waste water may be moderate. Information on concentrations in Danish effluents as well as a site specific use of the higher dilution factors would be needed to confirm the above assumption regarding the majority of the Danish WWTPs leading to risk quotients below 1. |
