|
| Front page | | Contents | | Previous | | Next |
Spatial differentiation in LCA impact assessment
8. Human toxicity
Background information for this chapter can be found in:
- Chapter 7 of the "Environmental assessment of products. Volume 2: Scientific background" by Hauschild and Wenzel (1998a).
- Chapter 8 of the "Background for spatial differentiation in life cycle impact assessment – EDIP2003 methodology" by Potting and Hauschild (2005).
8.1 Introduction
Nearly all substances are in principle toxic to human beings. It is only the dose as determined by the exposure that can prevent a substance from exerting its human toxic potential. There are three main routes
of human exposure to environmental pollutants: (1) inhalation with air, (2) ingestion with food and water (and sometimes also soil), and (3) penetration of the skin after contact with air (sometimes also soil or
water) or polluted surfaces. The exposure of humans to environmental pollutants usually occurs via more than one route at the same time (multi-route exposure), but one exposure route often dominates over
the others. Exposure trough inhalation results in most cases directly from emissions to air. Exposure through ingestion is usually the result of re-distribution between different environmental media and the food
chain. The intake of food is dominating the exposure through ingestion but to some extent, emission to soil and water may also result in direct exposure by ingestion of soil (pica, contaminated vegetables) and
water (as drinking water).
Typically, characterisation of human toxicity focuses on inhalation and ingestion. The methodology presented in this chapter focuses on inhalation since this is the exposure route where spatial differentiation is
anticipated to be of the largest relevance.
8.2 Classification
For the classification of substances contributing to human toxicity, a screening tool has been developed as part of EDIP97 based on the substance characteristics that dispose a substance for toxicity (Wenzel
et al., 1997). It is recommended to use this tool in combination with some of the existing lists of priority pollutants like the list of undesirable substances and the effect list from the Danish EPA (2000a and b).
8.3 EDIP97 characterisation factors
Characterisation of human toxicity can be based on quite different types of modelling. Presently, characterisation factors can roughly be divided into factors based on multi-media full-fate modelling, and
factors based on some-fate modelling. The EDIP97 characterisation factors are representative of the latter group. The strategy behind the fate modelling of the EDIP97 method has been to identify those
properties that are important for the substance's potential for human toxicity and then combine these in a transparent way in the expression of the characterisation factor. This is seen as preferable to basing it on adaptation of one of the existing multimedia models which have been developed and used for something else, namely
generic risk assessment of chemicals, and which are generally of little transparency. The EDIP97 factors are retained in the new characterisation factors to characterise the site-generic human toxic impact.
Characterisation of human toxicity is complex because of the large number of relevant substances involved, and the various interacting environmental processes leading to exposure. Though spatial
differentiation may play a role in all processes, it was not further explored for exposures through ingestion. It was considered more important for inhalation exposures directly resulting from emissions to air
since these are known to be strongly influenced by spatial variation:
- The stack height together with local and regional meteorological conditions determine the pattern of concentration increases resulting from an emission. The size of the area of concentration increases differs
between substances, but has a radius of several hundreds kilometres (short-lived substances) to thousands of kilometres (long-lived substances). The exposure in the local area surrounding the source is most
important for short-lived substances, while the exposure in the long range dominates for long living substances.
- Population densities show considerable spatial variation within the exposed area, as well as between exposure areas, for emissions released at different geographic locations.
- The extent to which an area is already exposed to concentration increases from other sources (background concentration) depends on its location in relation to major industrial and inhabited areas. Most
areas receive pollutants from very many sources, which usually means that the contribution from any single source is very small at the regional level. At the local level, the concentration increase from the
source will be larger but in general, if regulated properly, as is usually the case in industrialised countries, not large enough on its own to cause no-effect-levels of toxic substances to be exceeded.
As a result, not all substance emitted will result in adverse human exposure. The final human exposure depends on the geographic location where an emission is released.
8.4 EDIP2003 factors for human toxicity
The EDIP2003 site-generic factors do not replace the EDIP97 characterisation factors. Rather, they should be considered as exposure factors to be used in combination with the EDIP97 factors which are
maintained to characterise the site-generic impact on human toxicity from emissions. The EDIP97 characterisation factors are listed in Annex 8.1 to
8.3.
The EDIP2003 exposure factors have been established to evaluate spatially determined variations in the increase of human exposure4 through inhalation resulting directly from air emissions. The exposure
factors have been established for combinations of the following situations:
- Emitted substance: a short-lived (hydrogen chloride) and a long-lived (benzene) model substance
- Different heights of emission
- Different geographical locations
- Actual variation in atmospheric conditions
- Actual variation in regional and local population densities
The range of variation in the site-dependent exposure factors, which can be found by varying these parameters, provides insight in the potential variation in the site-generic human toxicity impact potential.
The accumulated exposure increase has been calculated for a long-lived substance (benzene, residence time of about one week) and a short-lived substance (hydrogen chloride, residence time of about 7
hours). These two substances have been selected because the residence time, and thereby the accumulated exposure increase, for emissions of most substances will lie between those of hydrogen chloride
and benzene. The source strength is kept at one gram per second continuously, but the influence of the height of the release point is investigated (1m, 25m, and 150m). The accumulated human exposure
increase from a release is the product of concentration increase and population density integrated over the whole surface.
The site-dependent exposure factor consists of two parts, one quantifying the exposure close to the source (0-10km), and one quantifying exposure over longer distances from the source (>10km).
Concentrations local to the source are estimated with the EUtrend model5, while the WMI model6 is used for estimating concentration increases at longer distances from the source.
The EUTREND model describes the mixing of the plume with the surrounding air after a substance is released from its source. Within a few hundred meters, the plume usually results in concentration
increases at ground level. Wind speeds largely determine how fast the plume dilutes, whereas the release height also influences how fast the plume reaches ground level. EUTREND models the resulting
concentration increases at ground level with a Gaussian plume approach applying region-dependent atmospheric conditions. The calculations are performed for the three different release heights and for
sources located in different climates:
- A maritime climate (approximated by atmospheric conditions in the Netherlands
- Climate in North Europe (approximated by atmospheric condition in Finland)
- Climate in Central Europe (approximated by atmospheric conditions in Austria)
- Climate in South Europe (approximated by atmospheric conditions in Italy)
The EUTREND results show a modest difference in local accumulated exposure between the maritime and North European climate regions on the one hand, and the South and Central European climates on
the other hand. The influence of source height on local accumulated exposure is more moderate than anticipated, but nevertheless considerable for tall sources. The climate region becomes more important
with lower release heights due to the considerable difference in wind velocities between the regions. Low wind velocities give slower dilution and subsequently higher ground concentrations than high wind
speeds. In addition, low wind velocities are usually accompanied by modest mixing heights for the plume. Wind velocities in the south and central climate regions are on average lower than in the maritime and
northern climate regions.
At longer distances from the source, the plume attains a homogeneous vertical distribution in the mixing layer of the atmosphere. Trajectory or one-dimensional Lagrangian modelling is an often-used way to
trace concentration increases resulting from substance transport and removal at long ranges. The Wind rose Model Interpreter (WMI) has been adapted for our purpose from the EcoSense integrated
assessment model (Krewitt et al. 1997). For any receptor point, it models the input from outside the grid cell differentiating between twenty-four sectors of the wind rose, such that from each sector a
straight-line trajectory arrives at the receptor point. Concentrations at the receptor point are obtained by averaging over the dispersion results from these trajectories, suitably weighted by the frequencies of
winds in each 15° sector. WMI supports modelling of substance fate along these trajectories based on region-dependent atmospheric conditions (1990 annual statistics mean).
For the present study, it has been employed to set up a single layer model with a horizontal resolution of 150•150 km2 on the EMEP7 grid, assuming a constant mean mixing height.
The WMI results show that while high wind speeds cause dilute concentrations and thus decrease human exposure close to the source, they increase the distances over which a substance is transported.
Transport over longer distance results in more people being exposed but to a lower concentration. The direct net effect of high wind speed on accumulated exposure is therefore usually small. Spatial
variability of precipitation is also considered in the model. While wet deposition is of minor importance for benzene, hydrogen chloride is removed from the atmosphere with every shower due to its high
affinity for water. Precipitation varies strongly over the grid from 2000–3200 mm•a-1 in grid-squares at the Norwegian coast around Bergen down below 200 mm•a-1 in the Sahara Desert, parts of Turkey,
Southeast Russia and Kazakhstan. Due to its longer lifetime, the accumulated exposure to benzene is less dependent on local than on regional population density. The model domain (Europe) is actually too
small to trace benzene concentrations over their full residence time. Approximately 40% of the benzene emitted at the Central European site and almost 60% of the benzene emitted at the North European
site is subject to atmospheric transport beyond the edges of the model grid. An extrapolation has been performed to cover the exposure taking place outside the European grid (see Potting et al., 2005b).
Spatially resolved European population data from Tobler et al. (1995; see Annex 8.4) is used in the models to estimate the exposure which is expressed as the product of the concentration increase and the
population exposed to it (pers•μg/m3/g emitted).
The site-dependent factors for regional human exposure show a difference between highest rating area (South-Eastern Netherlands) and the very low ratings (in some very sparsely populated areas in the far
North) of less than a factor 20 for the long-lived benzene, but almost a factor 100 for the short-lived hydrogen chloride. While the uncertainties in the modelling underlying those factors are acceptable, the
spatial variation of the impact potential is thus considerable at the regional level.
The site-dependent factors for local human exposure (0-10km) show that exposure close to the source is less than a factor 2 higher from a release height of 1m than from a release height of 25m. The
exposure from a release height of 25m is a factor 6 to 10 higher than exposure from a release height of 150m. In comparison to the regional situation, these differences are moderate.
Application of the EDIP2003 exposure factors to evaluate the spatial variation in the human toxicity impact from inhalation is simple but does require additional information (see Section 8.6) on the emission
height and the geographical location where the emission takes place. Typical life cycle inventories already provide data about the region where an emission is released, but usually no information is available
on the height of the emission point and whether the emission is released in the vicinity of built-up areas. The latter two are of importance for the exposure local to the source.
Though the geographical region of release is often known, this information will not always be available, and for some applications it is also preferable to refrain from site-dependent characterisation. The
moderate range found between the highest and lowest site-dependent factors for local exposure moreover justifies being reluctant in applying these. Together with the fact that the exposure factors have only
been calculated for two model substances this means that the main interest of the established site-dependent local and regional exposure factors will be for sensitivity analysis to help quantify
the possible spatial variation underlying the site-generic impact potentials.
What do the impacts express?
The EDIP2003 human toxicity exposure factors for air-borne emissions express the exposure of human beings within the predicted deposition area as the product of the concentration increase and the
number of people exposed to it (g/m3•person), integrated over the full deposition area within Europe. The EDIP97 human toxicity characterisation factors for exposure via air represent the substance's
inherent ability to cause human toxicity via air exposure. They are calculated as the reciprocal of a fate-corrected human reference dose or –concentration and are thus really effect factors or severity factors
which inherently assume that an exposure takes place
(m3/g(/person)). The exposure factor for an emission and the effect factor of the substance are multiplied to calculate the human toxic impact potential. The exposure-corrected impact potential is
dimensionless.
In comparison, the EDIP97 factors express the volume of environmental compartment (air, water, soil) which can be polluted up to the human reference concentration or –dose, the level not expected to
cause effects on lifelong exposure (m3/g).
8.5 Site-generic characterisation, all exposure routes
Factors have been developed to evaluate exposure via inhalation for hydrogen chloride (atmospheric residence time of the substance around one day)
and benzene (atmospheric residence time around one week or longer). These two substances are intended to represent the dispersion pattern of short-lived and relatively long-lived pollutants respectively.
The site-generic human toxicity impact potential for exposure via air is calculated using the site-generic (European average) exposure factors in Table 8.1 in combination with the EDIP97 characterisation
factors for human toxicity via air from Wenzel et al. (1997) according to the following expression:
(8.1)
Where: sg-EP(hta)= The site-generic human toxicity impact from the product (dimensionless) through inhalatory exposure from atmospheric emissions
sg-HEFregional, s
= The site-generic exposure factor (person•μg/m3) from Table 8.1, which relates the emission of substance (s) (represented by HCl or benzene) to exposure at the regional level
sg-HEFlocal, s = The site-generic exposure factor (person•μg/m3) from Tale 8.1, which relates the emission of substance (s) (represented by HCl or benzene) to exposure at
the local level
CF(hta)s= The EDIP97 characterisation factor for human toxicity (in m3/g) from Annex 8.1, which relates the emission of substance (s) into air to the impact for
exposure via air
E(a)s = The emission of substance (s) to air (in g per functional unit).
The EDIP97 characterisation factors for human toxicity via air are found in Annex 8.1.
Table 8.1. Factors for site-generic, and for site-dependent human exposure assessment (in person•μg/m3 per gram emitted)
| Regional |
Site-generic assessment
Site-generic exposure factors =
sg-HEF(s) |
Site-dependent assessment
Site-dependent exposure factors |
| |
|
|
(factor to be found in Annex 8.5-8.7) |
| Substance |
Factor |
standard deviation |
factor = sd-HEF(s)i |
| C6H12 |
50000 |
33000 |
sd-HEFregional(C6H12)i |
| HCl-25m (*) |
2460 |
1600 |
sd-HEFregional (HCl)| |
| HCl-1m |
2190 |
1420 |
sd-HEFregional (HCl)| |
| HCl-150m |
3200 |
2080 |
sd-HEFregional (HCl)| |
| Local |
Site-generic assessment
Site-generic exposure factors
=
sg-HEF(s) |
|
Site-dependent assessment
Site-dependent exposure factors |
| |
|
|
(factor to be found in Annex 8.5-8.7) |
| Substance |
Factor |
standard deviation |
factor = sd-HEF(s)i |
| C6H12-25m (**) |
6970 |
|
PDi•sd-HEFlocal (C6H12)i |
| HCl-25m (**) |
3620 |
|
PDi•sd-HEFlocal (HCl)i |
*The value for a release height of 25m is taken as default
**These values refer to southern Europe, and a population density of 100 persons/km2
For exposure via inhalation, the potential spatial variation of the exposure and the resulting human toxicity impact can be estimated from the standard deviation in the site-generic exposure factors in Table
8.1.
8.6 Site-dependent characterisation
The human toxicity impact from a given product is in many cases dominated by one or a few processes. Even for applications, where a site-dependent assessment is preferred, it is therefore advised to start
with calculation of the site-generic impact of a product as described in the previous section, taking into account exposure in a site-generic situation. This site-generic impact can be used to select the
processes with the dominating contributions (step 1), and next to evaluate the actual spatial variation in the contribution from these processes by applying the relevant site-dependent factors (step 2 and
3).
Step 1
The site-generic human toxicity impact by inhalation resulting directly from air emissions, as calculated in the previous section, is broken down into the contributions from the separate processes. These
contributions are then ranked from the largest to the smallest contribution, and the process with the largest contribution is selected.
Step 2
The site-generic human toxicity impact from step 1 is reduced with the contribution of the process selected in step 1. Next, the site-dependent impact from the emissions of this process is calculated using the
relevant site-dependent factors.
Click here to see the Formula
(8.2)
Where:
sd-EP(hta)p = The site-dependent human toxicity impact (dimensionless) from process (p) through the inhalatory exposure from atmospheric emissions
d-HEFregional(h)s,i = The site-dependent exposure factor (person•μg/m3) which relates the emission of substance (s) (represented by HCl or benzene) released at height (h) in country or region (i) (where process (p) is located) to exposure at the regional level. The
site-dependent factors for regional exposure can be found in Annex 8.5 for hydrogen chloride and Annex 8.6 for benzene.
sd-HEFlocal(h)s,i = The site-dependent exposure factor (person•μg/m3) which relates the emission of substance (s) (represented by HCl or benzene) released at height (h) in country or region (i) (where process (p) is located) to exposure at the local level. The
site-dependent factors for local exposure can be determined from Annex 8.7.
PDi = The local population density in country or region (i) where process (p) is located. The local population density can be estimated from Annex
8.4, or roughly be taken as 100 person/km2 for rural areas, 500 person/km2 for urbanised areas, 1000-5000 person/km2 for built-up areas, and >10,000 person/km2 for city-centres
CF(hta)s = The EDIP97 factor for human toxicity (in m3/g) from Annex 8.1 which relates the emission of substance(s) into air to the impact from an exposure via air
E(a)s,p = The emission to air of substance (s) from process (p) (in g per functional unit).
The geographic region in which the emissions take place determines the relevant regional and local factors of the source. The impact of emissions from unknown but probably European regions can be
calculated with the site-generic exposure factors (see previous section). The information about the potential spatial variation in these factors (see table 8.1) should be taken into account in the next step.
As a first approach, also the emissions from a non-European or unknown region can be calculated with the site-generic exposure factors from previous section. The standard deviations for the site-generic
factors in Table 8.1 give a range for their spatial variation within Europe. Given the size of the variation in emissions and sensitivities within Europe, the site-dependent factor is expected to lie within this range
for most regions also in the rest of the world. Expert judgement may be used in the interpretation to assess whether the factor for emissions from processes in non-European regions should be found in the
lower or upper end of the range.
Step 3
The site-dependent contributions from the process selected in step 1 are added to the adjusted site-generic contribution from step 2. Step 2 is repeated until the site-dependent contribution from the selected
processes is so large that the residual spatial variation in the human toxicity score can no longer influence the conclusion of the study (e.g. when the site-dependent share is larger than 95% of the total impact
score).
8.7 Normalisation
The EDIP2003 person equivalent for human toxicity via air using the EDIP2003 exposure factors is 1.7•108 yr-1
Following the EDIP97 approach, the normalisation reference for human toxicity via air is based on the impact caused by the actual emission levels for 1994 (see Hauschild and Wenzel 1998f and Stranddorf
et al., 2005). Applying the EDIP2003 exposure factors for human toxicity via air together with the characterisation factors from EDIP97, the total impact from the emissions in a representative number of
European countries, for which relevant air emission data is found, is 4.4•1016. The person equivalent is calculated as an average European impact per person assuming a population in these countries of
2.55•108 persons. The calculation of the normalisation reference is documented in Annex 8.8.
8.8 Interpretation
Considering the moderate range found between the highest and lowest site-dependent exposure factors and acknowledging the fact that the exposure factors have only been calculated for two model
substances, the main interest of the established site-dependent exposure factors lies in their use for representing this part of spatial variation in a sensitivity analysis to help quantify the possible spatial variation
underlying the site-generic impact potentials.
The exposure factors relate emissions of toxic substances to the increase in human exposure. Combined with the EDIP97 or similar site-generic characterisation factors for human toxicity, the exposure
factors indicate the increase in human toxic pressure from the emission. The total human exposure to the given substance is unknown, since the full emissions of the process are unknown (the inventory relates
to the functional unit), as are the environmental background concentrations of the given substance. Compared to the factors developed for terrestrial eutrophication and acidification, the factors for human
toxicity thus cover a shorter part of the cause-impact chain. The present state-of-the-art in integrated assessment modelling of human toxicity does not allow a closer assessment of toxic effect.
To assist interpretation of the exposure estimates, a review is given with a selection of typical situations where background concentrations are near or above no-effect-levels for a number of important air
pollutants (see Annex
8.9). This review provides information to help evaluate whether no-effect-levels are likely to be exceeded by the emission of a given process. Such an evaluation must be very rough, given the limited data
available about background concentrations. Nevertheless, it is a first step in the interpretation for identifying those processes for which concentration increases may exceed no-effect-levels.
8.9 Example
Applying the EDIP2003 factors, characterisation is performed on the inventory presented in Section 1.6.
Site-generic characterisation
As described in Section 8.5, first the site-generic impacts for exposure via air are calculated. The human toxicity impact shown in Table 8.2 is determined using the EDIP97 factors from Annex 8.1 and the
site-generic exposure factors from Table 8.1 according to Equation 8.1. Among the airborne emissions for which EDIP97 factors exist, the metals (which are particle-bound), NOx and carbon moNOxide
are judged to have atmospheric residence times close to benzene (one week). In the characterisation they are therefore represented by the site-generic exposure factors for benzene. The residence time of
SO2 is expected to lie closer to the residence time of HCl (one day), and for SO2, the site-generic exposure factors of HCl are therefore chosen. For HEFregional, a release height of 25m is assumed
because the emissions are of industrial origin.
Table 8.2. Site-generic impact potentials for human toxicity via air exposure for one supporting block made from plastic or zinc. Expressed as area of unprotected ecosystem.
Click here to see the Table
Using site-generic exposure factors, the zinc supporting block has the largest human toxicity impact potentials. For both supporting blocks, SO2, NOx, and lead are important contributors while also the
cadmium emission contributes significantly for the zinc component. However, the potential spatial variation is so large (as revealed by the spatially determined standard deviation) that the conclusion might
change if spatial variation were to be included. Therefore, a site-dependent characterisation is performed for those processes that contribute the most to the site-generic impacts in order to reduce the
spatially determined uncertainty and strengthen the conclusion.
Site-dependent characterisation
Table 8.2 reveals that the predominant contributions to the human toxicity impact via air are caused by SO2, NOx, Pb and (for the zinc component) Cd. For the zinc component, the main sources for SO2
and NOx emissions are identified as the production of zinc from ore which takes place in Bulgaria, the casting of the component which takes place in Yugoslavia and that part of the transport of the
component, which takes place by truck through Germany. Both the lead and zinc emissions are nearly exclusively caused by the production of zinc from ore in Bulgaria (data not shown). For the plastic
component the main sources for SO2 and NOx are found to be the production of plastic polymer in Italy, the flow injection moulding of the supporting block in Denmark, and the transportation of the
component by truck, mainly through Germany. The lead emissions come from the consumption of electricity which takes place at a number of places throughout Europe. For the latter it is thus chosen to
retain the site-generic characterisation (idem). The emissions from the selected processes contribute a good 80% and 95% of the full site-generic impacts of Table 8.2 for the zinc component and the plastic
component respectively (data not shown).
In the calculation of the site-dependent impacts for these key processes, the relevant site-dependent regional exposure factors are read from the maps of Annex 8.5 and annex 8.6. The midpoint of the given
intervals is applied. The local exposure factors are found in Annex 8.7 covering the range up to 10 km distance. The population density in the local area is taken as rural (100 persons/km2). The results of the
site-dependent characterisation are shown in Table 8.3.
Exposure factors for HCl and benzene were used to represent substances of short respectively long residence times in the atmosphere. To check the robustness of the results for the choice of model
substance (HCl or benzene) in the best estimate calculation in Table 8.3, the lower and upper bond due to residence time of the substance is determined. The calculation of the site-dependent impacts is
repeated applying the HCl factors for all emissions (lower bond) and the benzene factors for all emissions (upper bond) (calculation not shown). For all three calculations, the site-generic impacts from the
key processes are subtracted from the original site-generic impacts in Table 8.2 and the site-dependent impacts (in Table 8.3 for the best estimate) are added. The thus corrected human toxicity impacts via
air are found in Table 8.4 and the difference to the original site-generic impacts of Table 8.2 is illustrated in Figure 8.1.
Table 8.3. Site-dependent impact potentials for human toxicity via air for key processes from either product system.
| Zinc part |
|
EF(hta) |
HEFregional |
HEFlocal |
PD |
|
Toxic impact EP(hta) |
| |
g/f.u. |
m3 air/g |
person•μg/m3/g |
person•μg/m3/g |
|
|
| SO2 emissions |
|
|
|
|
|
|
|
| Zinc production, Bulgaria |
9,16 |
1,30•103 |
1500 |
0,52 |
|
100 |
61 |
| Zinc casting, Yugoslavia |
2,71 |
1,30•103 |
1500 |
0,52 |
|
100 |
18 |
| Transport, mainly Germany |
1,18 |
1,30•103 |
3500 |
0,68 |
|
100 |
13 |
| NOx emissions |
|
|
|
|
|
|
|
| Zinc production, Bulgaria |
0,97 |
8,60•103 |
22500 |
1 |
|
100 |
246 |
| Zinc casting, Yugoslavia |
1,65 |
8,60•103 |
22500 |
1 |
|
100 |
418 |
| Transport, mainly Germany |
4,56 |
8,60•103 |
22500 |
1,75 |
|
100 |
1361 |
| Lead emissions |
|
|
|
|
|
|
|
| Zinc production, Bulgaria |
1,75•10-4 |
1,00•108 |
22500 |
1 |
|
100 |
516 |
| Cadmium emissions |
|
|
|
|
|
|
|
| Zinc production, Bulgaria |
6,50•10-5 |
1,10•108 |
22500 |
1 |
|
100 |
211 |
| Total, zinc part |
|
|
|
|
|
|
2843 |
| Plastic part |
|
|
|
|
|
|
|
| SO2 emissions |
|
|
|
|
|
|
|
| Plastic production, Italy |
2,43 |
1,30•103 |
1500 |
0,52 |
|
100 |
16 |
| Flow injection moulding, Denmark |
2,11 |
1,30•103 |
1500 |
0,28 |
|
100 |
9 |
| Transport, mainly Germany |
0,45 |
1,30•103 |
3500 |
0,68 |
|
100 |
5 |
| NOx emissions |
|
|
|
|
|
|
|
| Plastic production, Italy |
0,63 |
8,60•103 |
22500 |
1 |
|
100 |
160 |
| Flow injection moulding, Denmark |
0,48 |
8,60•103 |
22500 |
0,42 |
|
100 |
105 |
| Transport, mainly Germany |
1,74 |
8,60•103 |
22500 |
1,75 |
|
100 |
519 |
| |
|
|
|
|
|
|
|
| Total, plastic part |
|
|
|
|
|
|
814 |
Site-dependent characterisation reduces the size of the human toxicity impact via air for both components but strengthens the dominance of the zinc component. For the zinc-based component around 75%
of this impact is calculated using site-dependent characterisation factors while the site-dependent share for the plastic-based component is around 85%. Even if the site-dependent characterisation were
performed for all the remaining processes in the product system, the result will thus not change significantly, given their modest share in the total and the standard deviation. The major part of the spatially
conditioned potential for variation of the impact has been cancelled for both components. The upper and lower bonds calculated in Table 8.4 also reveal that the dominance of the zinc component in this
impact category is relatively insensitive to the residence time of the substance involved. Site is more important than residence time within the boundaries of the investigated model substances HCl and
benzene.
Table 8.4. Human toxicity impacts via air from either product system with site-dependent characterisation of key process emissions, best estimate (using exposure factors for HCl and benzene as judged
most appropriate), lower bond (exposure factors for HCl for all emissions) and upper bond (exposure factors for benzene for all emissions).
| |
Human toxicity via air, EP(hta) Best estimat |
Human toxicity via air, EP(hta) Lower bond |
Human toxicity via air, EP(hta) Upper bond |
| Zinccomponent |
3403 |
1216 |
3819 |
| Plastic component |
1291 |
672 |
1443 |
Figure 8.1 Site-generic and site-dependent human toxicity impacts via air from the two product systems. For the site-dependent impacts, the site-dependent exposure factors have only been applied for the
key processes as described above.
Annex 8.1: EDIP97 characterisation factors for human toxicity assessment for emissions to air (Wenzel et al., 1997)
| Emissions to air as first compartment |
| Substance | CAS no. | EF(hta)m3/g | EF(htw)m3/g | EF(hts)m3/g |
| | | | | |
| 1.1.1-Trichloroethane | 71-55-6 | 9.2E+02 | 9.9E-04 | 2.0E-03 |
| 1.2-Benzo-isothiazolin-3-one | 2634-33-5 | 2.8E+04 | 0 | 0 |
| 1.2-Dichlorobenzene | 95-50-1 | 8.3E+03 | 0.37 | 7.0E-03 |
| 1.2-Dichloroethane | 107-06-2 | 5.0E+04 | 3.9E-03 | 7.5E-02 |
| 1.2-Propylen oxide | 75-56-9 | 3.3E+04 | 2.9E-06 | 1.1E-03 |
| 1-Butanol | 71-36-3 | 1.3E+04 | 1.4E-03 | 1.4E-01 |
| 2.3.7.8-Tetrachlorodi-benzo-p-dioxin | 1746-01-6 | 2.9E+10 | 2.2E+08 | 1.4E+04 |
| 2.4-Dinitrotoluene | 121-14-2 | 1.1E+02 | 5.8E-03 | 9.6E-04 |
| 2-Chlorotoluene | 95-49-8 | 2.2E+03 | 0.98 | 1.9E-02 |
| 2-Ethyl hexanol | 104-76-7 | 1.8E+03 | 0 | 0 |
| 2-Ethylhexyl acetate | 103-09-3 | 9.5E+03 | 0 | 0 |
| 2-Propanol | 67-63-0 | 1.2E+02 | 7.5E-06 | 2.8E-03 |
| 3-Chlorotoluene | 108-41-8 | 2.2E+03 | 0.71 | 2.4E-02 |
| 4-Chlorotoluene | 106-43-4 | 2.2E+03 | 0.79 | 2.2E-02 |
| Acetaldehyde | 75-07-0 | 3.7E+03 | 0 | 0 |
| Acetic acid | 64-19-7 | 1.0E+04 | 3.3E-06 | 1.6E-03 |
| Acetone | 67-64-1 | 3.2E+04 | 8.5E-06 | 4.1E-03 |
| Acrylic acid | 79-10-7 | 6.7E+05 | 6.3E-05 | 1.6E-02 |
| Acrylic acid, 2-hydroxyethyl ester | 818-61-1 | 2,0E+02 | 0 | 0 |
| Anthracene | 120-12-7 | 9.5E+02 | 0 | 0 |
| Antimony | 7440-36-0 | 2.0E+04 | 64 | 17 |
| Arsenic | 7440-38-2 | 9.5E+06 | 7.4 | 1.0E+02 |
| Atrazine | 1912-24-9 | 1.4E+05 | 0 | 0 |
| Benzene | 71-43-2 | 1.0E+07 | 2.3 | 14 |
| Benzo(a)pyrene | 50-32-8 | 5.0E+07 | 0 | 0 |
| Benzotriazole | 95-14-7 | 1.3E+03 | 9.3E-04 | 2.0E-02 |
| Biphenyl | 92-52-4 | 2.3E+05 | 1.4 | 2.9E-03 |
| Butyl diglycol acetate | 124-17-4 | 1.3E+04 | 0 | 0 |
| Cadmium | 7440-46-9 | 1.1E+08 | 5.6E+02 | 4.5 |
| Carbon monoxide | 630-08-0 | 8.3E+02 | 0 | 0 |
| Chlorine | 7782-50-5 | 3.4E+04 | 0 | 0 |
Annex 8.1: EDIP97 characterisation factors for human toxicity assessment for emissions to air (Wenzel et al., 1997)
| Emissions to air as first compartment |
| Substance |
CAS no. |
EF(hta)m3/g |
EF(htw)m3/g |
EF(hts)m3/g |
| |
|
|
|
|
| Chlorbenzene |
108-90-7 |
2.2E+05 |
0.27 |
4.6E-02 |
| Chloroform |
67-66-3 |
1.0E+05 |
5.4E-02 |
0.20 |
| Chromium |
7440-47-3 |
1.0E+06 |
3.6 |
1.1 |
| Cobalt |
7440-48-4 |
9.5E+03 |
2.5E-03 |
0.17 |
| Copper |
7440-50-8 |
5.7E+02 |
3.4 |
4.0E-03 |
| DibutyltiNOxide |
818-08-6 |
1.4E+05 |
3.7E-03 |
4.2E-03 |
| Diethanolamine |
111-42-2 |
4.0E+04 |
0 |
0 |
| Diethylaminoethanol |
100-37-8 |
2.7E+04 |
0 |
0 |
| Diethylene glycol |
111-46-6 |
2.5E+05 |
0 |
0 |
| Diethylene glycol mono-n-butyl ether |
112-34-5 |
2.0E+06 |
0 |
0 |
| Ethanol |
64-17-5 |
1.1E+02 |
2.9E-07 |
1.5E-04 |
| Ethyl acetate |
141-78-6 |
6.9E+02 |
8.9E-06 |
1.2E-03 |
| Ethylene glycol |
107-21-1 |
8.3E+05 |
1.4E-03 |
2.0E-05 |
| Ethylene glycol acetate |
111-15-9 |
3.7E+03 |
0 |
0 |
| Ethylene glycol mono-n-butyl ether |
111-76-2 |
2.1E+04 |
0 |
0 |
| Ethylenediamine tetraacetic acid, EDTA |
60-00-4 |
3.7E+02 |
0 |
0 |
| Ethylenediamin, 1,2-ethanediamine |
107-15-3 |
2.0E+04 |
0 |
0 |
| Fluoride |
16984-48-8 |
9.5E+04 |
0 |
0 |
| Formaldehyde |
50-00-00 |
1.3E+07 |
2.2E-05 |
5.8E-03 |
| Glycerol |
56-81-5 |
70 |
0 |
0 |
| Hexamethylene diisocyanate, HDI |
822-06-0 |
7.1E+05 |
12 |
0.56 |
| Hexane |
110-54-3 |
1,6E+03 |
0.34 |
9.7E-04 |
| Hydrogen cyanide |
74-90-8 |
1.4E+05 |
1.5E-03 |
0.71 |
| Hydrogene sulphide |
7783-06-04 |
1.1E+06 |
8.1E-04 |
0.26 |
| Iron |
7439-89-6 |
3.7E+04 |
9.6E-03 |
0.77 |
| Isobutanol |
78-83-1 |
1.0E+07 |
2.8E-05 |
3.7E-03 |
| Isopropylbenzene, cumene |
98-82-8 |
1.0E+04 |
0.21 |
2.1E-02 |
| Lead |
7439-92-1 |
1.0E+08 |
53 |
8.3E-02 |
| Maleic acid, dibutyl ester |
105-76-0 |
7.7E+03 |
0 |
0 |
| Manganese |
7439-96-5 |
2.5E+06 |
5.3E-03 |
0.42 |
Annex 8.1: EDIP97 characterisation factors for human toxicity assessment for emissions to air (Wenzel et al., 1997)
| Emissions to air as first compartment |
| Substance |
CAS no. |
EF(hta)m3/g |
EF(htw)m3/g |
EF(hts)m3/g |
| |
|
|
|
|
| Mercury |
7439-97-6 |
6.7E+06 |
1.1E+05 |
81 |
| Methacrylic acid |
79-41-4 |
4.5E+04 |
0 |
0 |
| Methanol |
67-56-1 |
2.5E+03 |
3.0E-04 |
3.1E-04 |
| Methyl isobutyl ketone |
108-10-1 |
3.3E+03 |
3.6E-03 |
0.12 |
| Methyl methacrylate |
80-62-6 |
1.0E+07 |
0 |
0 |
| Methylenebis (4-phenylisocyanate), MDI |
101-68-8 |
5.0E+07 |
0 |
0 |
| Molybedum |
7439-98-7 |
1.0E+05 |
5.3E-02 |
1.5 |
| Monoethanolamin |
141-43-5 |
2.7E+04 |
0 |
0 |
| Morpholine |
110-91-8 |
1.3E+04 |
0 |
0 |
| n-Butyl acetate |
123-86-4 |
1.1E+03 |
7.0E-03 |
5.0E-02 |
| Nickel |
7440-02-0 |
6.7E+04 |
3.7E-03 |
0.12 |
| Nitrilotriacetate |
139-13-9 |
3.8E+04 |
0 |
0 |
| Nitrobenzenesulpho nic acid, sodium salt |
127-68-4 |
2.6E+03 |
1.7E-07 |
3.9E-05 |
| Nitrogen dioxide and other NOx |
10102-44-0 |
8.6E+03 |
0 |
0 |
| Nitrous oxide, N2O |
10024-97-2 |
2.0E+03 |
0 |
0 |
| Ozone |
10028-15-6 |
5.0E+04 |
0 |
0 |
| Phenol |
108-95-2 |
1.4E+06 |
0 |
0 |
| Phosgene |
75-44-5 |
2.0E+06 |
0 |
0 |
| Propylene glycol, 1,2-propanediol |
57-55-6 |
1.5E+03 |
0 |
0 |
| Selenium |
7782-49-2 |
1.5E+06 |
28 |
4.4E-02 |
| Silver |
7440-22-4 |
2.0E+05 |
5.3E-02 |
4.2 |
| Sodium benzoate |
532-32-10 |
1.4E+04 |
4.0E-07 |
1.4E-04 |
| Sodium hypochlorite |
7681-52-9 |
2.0E+03 |
0 |
0 |
| Styrene |
100-42-5 |
1.0E+03 |
0 |
0 |
| Sulphamic acid |
5329-14-6 |
9.0E+03 |
2.1E-09 |
9.7E-06 |
| Sulphur dioxide |
7446-09-5 |
1.3E+03 |
0 |
0 |
| Tetrachlorethylene |
127-18-4 |
2.9E+04 |
0.36 |
4.0E-02 |
| Thallium |
7440-28-0 |
5.0E+05 |
1.3E+04 |
10 |
| Titanium |
7440-32-6 |
1.8E+04 |
4.7E-03 |
0.38 |
Annex 8.1: EDIP97 characterisation factors for human toxicity assessment for emissions to air (Wenzel et al., 1997)
| Emissions to air as first compartment |
| Substance |
CAS no. |
EF(hta)m3/g |
EF(htw)m3/g |
EF(hts)m3/g |
| |
|
|
|
|
| Toluene |
108-88-3 |
2.5E+03 |
4.0E-03 |
1.0E-03 |
| Toluene diisocyanate 2.4/2.6 mixture |
26471-62-5 |
7.1E+05 |
2.1 |
1.2E-02 |
| Toluene-2.4-diamine |
95-80-7 |
1.4E+03 |
0 |
0 |
| Trichloroethylene |
79-01-6 |
1.9E+04 |
9.1E-04 |
6.9E-04 |
| Triethanolamine |
102-71-6 |
1.3E+04 |
0 |
0 |
| Triethylamine |
121-44-8 |
1.4E+05 |
0 |
0 |
| Vanadium |
7440-62-2 |
1.4E+05 |
3.7E-02 |
0.96 |
| Vinylchloride |
75-01-4 |
3.9E+05 |
0.40 |
4.0 |
| Xylenes, mixed |
1330-20-7 |
6.7E+03 |
1.1E-03 |
6.7E-05 |
| Zinc (as dust) |
7440-66-6 |
8.1E+04 |
4.1 |
1.3E-02 |
Annex 8.2: EDIP97 characterisation factors for human toxicity assessment for emissions to water (Wenzel et al., 1997)
| Emissions to water as first
compartment |
| Substance |
CAS no. |
EF(hta) |
EF(htw) |
EF(hts) |
| |
|
m3/g |
m 3/g |
3m/g |
| |
|
|
|
|
| 1,1,1-Trichloroethane |
71-55-6 |
9.2E+02 |
9.9E-04 |
2.0E-03 |
| 1,2-Benzoiso thiazolin-3-one |
2634-33-5 |
0 |
1.3E-04 |
0 |
| 1,2-Dichlorobenzene |
95-50-1 |
8.3E+03 |
0.37 |
7.0E-03 |
| 1,2-Dichloroethane |
107-06-2 |
0 |
2.0E-02 |
0 |
| 1,2-Propylene oxide |
75-56-9 |
0 |
1.5E-05 |
0 |
| 1-Butanol |
71-36-3 |
0 |
7.1E-03 |
0 |
| 2.3.7.8-Tetrachloro dibenzo-p-dioxin |
1746-01-6 |
0 |
1.1E+09 |
0 |
| 2,4-Dinitrotoluene |
121-14-2 |
0 |
2.9E-02 |
0 |
| 2-Chlorotoluene |
95-49-8 |
2.2E+03 |
0.98 |
1.9E-02 |
| 2-Ethyl hexanol |
104-76-7 |
0 |
2.8E-02 |
0 |
| 2-Ethylhexyl acetate |
103-09-3 |
9.5E+03 |
0 |
0 |
| 2-Propanol |
67-63-0 |
0 |
3.7E-05 |
0 |
| 3-Chlorotoluene |
108-41-8 |
2.2E+03 |
0.71 |
2.4E-02 |
| 4-Chlorotoluene |
106-43-4 |
2.2E+03 |
0.79 |
2.2E-02 |
| Acetaldehyde |
75-07-0 |
0 |
7.1E-06 |
0 |
| Acetic acid |
64-19-7 |
0 |
1.6E-05 |
0 |
| Acetone |
67-64-1 |
0 |
4.3E-05 |
0 |
| Acrylic acid |
79-10-7 |
0 |
3.1E-04 |
0 |
| Acrylic acid, 2-hydroxyethyl ester |
818-61-1 |
0 |
6.4E-04 |
0 |
| Anthracene |
120-12-7 |
0 |
11 |
0 |
| Antimony |
7440-36-0 |
0 |
3.2E+02 |
0 |
| Arsenic |
7440-38-2 |
0 |
37 |
0 |
| Atrazine |
1912-24-9 |
0 |
1.1 |
0 |
| Benzene |
71-43-2 |
1.0E+07 |
2.3 |
14 |
| Benzo(a)pyrene |
50-32-8 |
0 |
3.2E+02 |
0 |
| Benzotriazole |
95-14-7 |
0 |
4.6E-03 |
0 |
| Biphenyl |
92-52-4 |
0 |
7.1 |
0 |
| Butyl diglycol acetate |
124-17-4 |
0 |
3.3E-02 |
0 |
| Cadmium |
7440-46-9 |
0 |
2.8E+03 |
0 |
| Carbon monoxide |
630-08-0 |
8.3E+02 |
0 |
0 |
| Chlorine |
7782-50-5 |
3.4E+04 |
0 |
0 |
| Chlorobenzene |
108-90-7 |
2.2E+05 |
0.27 |
4.6E-02 |
| Chloroform |
67-66-3 |
1.0E+05 |
5.4E-02 |
0.20 |
Annex 8.2: EDIP97 characterisation factors for human toxicity assessment for emissions to water (Wenzel et al., 1997)
| Emissions to water as first
compartment |
| Substance |
CAS no. |
EF(hta) |
EF(htw) |
EF(hts) |
| |
|
m3/g |
3m/g |
m3/g |
| |
|
|
|
|
| Chromium |
7440-47-3 |
0 |
18 |
0 |
| Cobalt |
7440-48-4 |
0 |
1.2E-02 |
0 |
| Copper |
7440-50-8 |
0 |
17 |
0 |
| DibutyltiNOxide |
818-08-6 |
0 |
1.9E-02 |
0 |
| Diethanolamine |
111-42-2 |
0 |
3.9E-05 |
0 |
| Diethylaminoethanol |
100-37-8 |
0 |
3.2E-03 |
0 |
| Diethylene glycol |
111-46-6 |
0 |
3.1E-06 |
0 |
| Diethylene glycol mono-n-butyl ether |
112-34-5 |
0 |
3.4E-03 |
0 |
| Ethanol |
64-17-5 |
0 |
1.5E-06 |
0 |
| Ethyl acetate |
141-78-6 |
0 |
4.4E-05 |
0 |
| Ethylene glycol |
107-21-1 |
0 |
7.0E-03 |
0 |
| Ethylene glycol acetate |
111-15-9 |
0 |
1.5E-03 |
0 |
| Ethylene glycol mono-n-butyl ether |
111-76-2 |
0 |
8.4E-05 |
0 |
| Ethylenediamine tetraacetic acid, EDTA |
60-00-4 |
0 |
6.7E-09 |
0 |
| Ethylenediamine,1.2-ethanediamine |
107-15-3 |
0 |
1.4E-05 |
0 |
| Fluoride |
16984-48-8 |
0 |
1.2E-02 |
0 |
| Formaldehyde |
50-00-00 |
0 |
1.1E-04 |
0 |
| Glycerol |
56-81-5 |
0 |
1.3E-06 |
0 |
| Hexamethylene diisocyanate, HDI |
822-06-0 |
0 |
61 |
0 |
| Hexane |
110-54-3 |
1.6E+03 |
0.34 |
9.7E-04 |
| Hydrogen cyanide |
74-90-8 |
1.4E+05 |
1.5E-03 |
0.71 |
| Hydrogen sulphide |
7783-06-04 |
0 |
4.1E-03 |
0 |
| Iron |
7439-89-6 |
0 |
4.8E-02 |
0 |
| Isobutanol |
78-83-1 |
0 |
1.5E-05 |
0 |
| Isopropylbenzene, cumene |
98-82-8 |
1.0E+04 |
0.21 |
2.1E-02 |
| Lead |
7439-92-1 |
0 |
2.6E+02 |
0 |
| Maleic acid, dibutyl ester |
105-76-0 |
0 |
14 |
0 |
| Manganese |
7439-96-5 |
0 |
2.7E-02 |
0 |
| Mercury |
7439-97-6 |
6.7E+06 |
1.1E+05 |
81 |
| Methacrylic acid |
79-41-4 |
0 |
6.0E-03 |
0 |
Annex 8.2: EDIP97 characterisation factors for human toxicity assessment for emissions to water (Wenzel et al., 1997)
| Emissions to water as first
compartment |
| Substance |
CAS no. |
EF(hta) |
EF(htw) |
EF(hts) |
| |
|
m3/g |
3m/g |
m3/g |
| |
|
|
|
|
| Methanol |
67-56-1 |
0 |
1.5E-03 |
0 |
| Methyl isobutyl ketone |
108-10-1 |
0 |
1.8E-02 |
0 |
| Methyl methacrylate |
80-62-6 |
0 |
4.9E-03 |
0 |
| Methylenebis(4-phenylisocyanate), MDI |
101-68-8 |
0 |
2.8E+02 |
0 |
| Molybdenum |
7439-98-7 |
0 |
0.27 |
0 |
| Monoethanolamine |
141-43-5 |
0 |
3.5E-05 |
0 |
| Morpholine |
110-91-8 |
0 |
1.0E-04 |
0 |
| n-Butyl acetate |
123-86-4 |
0 |
3.5E-02 |
0 |
| Nickel |
7440-02-0 |
0 |
1.9E-02 |
0 |
| Nitrilotriacetate |
139-13-9 |
0 |
8.2E-14 |
0 |
| Nitrobenzenesulpho nic acid, sodium salt |
127-68-4 |
2.6E+03 |
1.7E-07 |
3.9E-05 |
| Nitrogen dioxide and other NOx |
10102-44-0 |
0 |
3.7E-05 |
0 |
| Nitrious oxide, N2O10024-97-2 |
|
2.0E+03 |
0 |
0 |
| Ozone |
10028-15-6 |
5.0E+04 |
0 |
0 |
| Phenol |
108-95-2 |
0 |
3.4E-02 |
0 |
| Phosgene |
75-44-5 |
2.0E+06 |
0 |
0 |
| Propylene glycol,1.2-propanediol |
57-55-6 |
0 |
4.8E-06 |
0 |
| Selenium |
7782-49-2 |
0 |
1.4E+02 |
0 |
| Silver |
7440-22-4 |
0 |
0.27 |
0 |
| Sodium benzoate |
532-32-10 |
0 |
2.0E-06 |
0 |
| Sodium hypochlorite |
7681-52-9 |
0 |
2.6E-04 |
0 |
| Styrene |
100-42-5 |
1.0E+03 |
0 |
0 |
| Sulphamic acid |
5329-14-6 |
0 |
1.1E-08 |
0 |
| Sulphur dioxide |
7446-09-5 |
1.3E+03 |
0 |
0 |
| Tetrachlorethylene |
127-18-4 |
2.9E+04 |
0.36 |
4.0E-02 |
| Thallium |
7440-28-0 |
0 |
6.5E+04 |
0 |
| Titanium |
7440-32-6 |
0 |
0.02 |
0 |
| Toluene |
108-88-3 |
2.5E+03 |
4.0E-03 |
1.0E-03 |
| Toluene diisocyanate 2.4/2.6 mixture |
26471-62-5 |
0 |
10 |
0 |
| Toluene-2.4-diamine |
95-80-7 |
0 |
1.3E-04 |
0 |
| Trichloroethylene |
79-01-6 |
1.9E+04 |
9.1E-04 |
6.9E-04 |
Annex 8.2: EDIP97 characterisation factors for human toxicity assessment for emissions to water (Wenzel et al., 1997)
| Emissions to water as first
compartment |
| Substance |
CAS no. |
EF(hta) |
EF(htw) |
EF(hts) |
| |
|
m3/g |
3m/g |
m3/g |
| |
|
|
|
|
| Triethanolamine |
102-71-6 |
0 |
8.4E-05 |
0 |
| Triethylamine |
121-44-8 |
0 |
0.23 |
0 |
| Vanadium |
7440-62-2 |
0 |
0.19 |
0 |
| Vinylchloride |
75-01-4 |
3.9E+05 |
0.40 |
4.0 |
| Xylenes, mixed |
1330-20-7 |
6.7E+03 |
1.1E-03 |
6.7E-05 |
| Zinc (as dust) |
7440-66-6 |
0 |
21 |
0 |
Annex 8.3: EDIP97 characterisation factors for human toxicity assessment for emissions to soil (Wenzel et al., 1997)
| Emissions to soil as first compartment |
| Substance |
CAS no. |
EF(hta) |
EF(htw) |
EF(hts) |
| |
|
m3/g |
3m/g |
3m/g |
| |
|
|
|
|
| 1.1.1-Trichloroethane |
71-55-6 |
9.2E+02 |
9.9E-04 |
2.0E-03 |
| 1.2-Benzoiso thiazolin-3-one |
2634-33-5 |
0 |
0 |
0.32 |
| 1.2-Dichlorobenzene |
95-50-1 |
8.3E+03 |
0.37 |
7.0E-03 |
| 1.2-Dichloroethane |
107-06-2 |
0 |
0 |
9.4E-02 |
| 1.2-Propylene oxide |
75-56-9 |
0 |
0 |
1.4E-03 |
| 1-Butanol |
71-36-3 |
0 |
0 |
0.18 |
| 2.3.7.8-Tetrachloro dibenzo-p-dioxin |
1746-01-6 |
0 |
0 |
1.8E+04 |
| 2.4-Dinitrotoluene |
121-14-2 |
0 |
0 |
1.2E-03 |
| 2-Chlorotoluene |
95-49-8 |
2.2E+03 |
0.98 |
1.9E-02 |
| 2-Ethyl hexanol |
104-76-7 |
0 |
0 |
1.5E-03 |
| 2-Ethylhexyl acetate |
103-09-3 |
9.5E+03 |
0 |
0 |
| 2-Propanol |
67-63-0 |
0 |
0 |
3.5E-03 |
| 3-Chlorotoluene |
108-41-8 |
2.2E+03 |
0.71 |
2.4E-02 |
| 4-Chlorotoluene |
106-43-4 |
2.2E+03 |
0.79 |
2.2E-02 |
| Acetaldehyde |
75-07-0 |
0 |
0 |
9.2E-04 |
| Acetic acid |
64-19-7 |
0 |
0 |
2.0E-03 |
| Acetone |
67-64-1 |
0 |
0 |
5.2E-03 |
| Acrylic acid |
79-10-7 |
0 |
0 |
2.0E-02 |
| Acrylic acid, 2-hydroxyethyl ester |
818-61-1 |
0 |
0 |
7.6E-02 |
| Anthracene |
120-12-7 |
0 |
0 |
1.1E-04 |
| Antimony |
7440-36-0 |
0 |
0 |
21 |
| Arsenic |
7440-38-2 |
0 |
0 |
1.3E+02 |
| Atrazine |
1912-24-9 |
0 |
0 |
4.2E-02 |
| Benzene |
71-43-2 |
1.0E+07 |
2,3 |
14 |
| Benzo(a)pyrene |
50-32-8 |
0 |
0 |
1.8E-03 |
| Benzotriazole |
95-14-7 |
0 |
0 |
2.5E-02 |
| Biphenyl |
92-52-4 |
0 |
0 |
3.6E-03 |
| Butyl diglycol acetate |
124-17-4 |
0 |
0 |
0.27 |
| Cadmium |
7440-46-9 |
0 |
0 |
5.6 |
| Carbon moNOxide |
630-08-0 |
8.3E+02 |
0 |
0 |
Annex 8.3: EDIP97 characterisation factors for human toxicity assessment for emissions to soil (Wenzel et al., 1997)
| Emissions to soil as compartment
first |
| Substance |
CAS no. |
EF(hta) |
EF(htw) |
EF(hts) |
| |
|
m3/g |
3m/g |
3m/g |
| |
|
|
|
|
| Chlorine |
7782-50-5 |
3.4E+04 |
0 |
0 |
| Chlorobenzene |
108-90-7 |
2.2E+05 |
0.27 |
4.6E-02 |
| Chloroform |
67-66-3 |
1.0E+05 |
5.4E-02 |
0.20 |
| Chromium |
7440-47-3 |
0 |
0 |
1.4 |
| Cobalt |
7440-48-4 |
0 |
0 |
0.21 |
| Copper |
7440-50-8 |
0 |
0 |
5.0E-03 |
| DibutyltiNOxide |
818-08-6 |
0 |
0 |
5.3E-03 |
| Diethanolamine |
111-42-2 |
0 |
0 |
5.9E-03 |
| Diethylaminoethanol |
100-37-8 |
0 |
0 |
0.30 |
| Diethylene glycol |
111-46-6 |
0 |
0 |
4.7E-04 |
| Diethylene glycol mono-n-butyl ether |
112-34-5 |
0 |
0 |
0.16 |
| Ethanol |
64-17-5 |
0 |
0 |
1.8E-04 |
| Ethyl acetate |
141-78-6 |
0 |
0 |
1.5E-03 |
| Ethylene glycol |
107-21-1 |
0 |
0 |
2.5E-05 |
| Ethylene glycol acetate |
111-15-9 |
0 |
0 |
6.6E-02 |
| Ethylene glycol mono-n-butyl ether |
111-76-2 |
0 |
0 |
3.5E-03 |
| Ethylenediamine tetraacetic acid, EDTA |
60-00-4 |
0 |
0 |
2.5E-06 |
| Ethylenediamine, 1,2-ethanediamine |
107-15-3 |
0 |
0 |
1.5E-03 |
| Fluoride |
16984-48-8 |
0 |
0 |
6.4E-04 |
| Formaldehyde |
50-00-00 |
0 |
0 |
7.2E-03 |
| Glycerol |
56-81-5 |
0 |
0 |
1.7E-04 |
| Hexamethylene diisocyanate, HDI |
822-06-0 |
0 |
0 |
0.70 |
| Hexane |
110-54-3 |
1.6E+03 |
0.34 |
9.7E-04 |
| Hydrogen cyanide74-90-8 |
|
1.4E+05 |
1.5E-03 |
0.71 |
| Hydrogene sulphide |
7783-06-04 |
1.1E+06 |
0 |
0 |
| Iron |
7439-89-6 |
0 |
0 |
0.96 |
| Isobutanol |
78-83-1 |
0 |
0 |
4.6E-03 |
| Isopropylbenzene, cumene |
98-82-8 |
1.0E+04 |
0.21 |
2.1E-02 |
| Lead |
7439-92-1 |
0 |
0 |
0.10 |
Annex 8.3: EDIP97 characterisation factors for human toxicity assessment for emissions to soil (Wenzel et al., 1997)
| Emissions to soil as compartment
first |
| Substance |
CAS no. |
EF(hta) |
EF(htw) |
EF(hts) |
| |
|
m3/g |
3m/g |
3m/g |
| |
|
|
|
|
| Maleic acid, dibutyl ester |
105-76-0 |
0 |
0 |
3.4E-03 |
| Manganese |
7439-96-5 |
0 |
0 |
0.53 |
| Mercury |
7439-97-6 |
6.7E+06 |
1.1E+05 |
81 |
| Methacrylic acid |
79-41-4 |
0 |
0 |
0.22 |
| Methanol |
67-56-1 |
0 |
0 |
3.9E-04 |
| Methyl isobutyl ketone |
108-10-1 |
0 |
0 |
0.15 |
| Methyl methacrylate |
80-62-6 |
0 |
0 |
3.2E-02 |
| Methylenebis(4-phenylisocyanate), MDI |
101-68-8 |
0 |
0 |
4.0E-04 |
| Molybdenum |
7439-98-7 |
0 |
0 |
1.9 |
| Monoethanolamine |
141-43-5 |
0 |
0 |
5.4E-03 |
| Morpholine |
110-91-8 |
0 |
0 |
1.6E-02 |
| n-Butyl acetate |
123-86-4 |
0 |
0 |
6.2E-02 |
| Nickel |
7440-02-0 |
0 |
0 |
0.15 |
| Nitrilotriacetate |
139-13-9 |
0 |
0 |
5.1E-05 |
| Nitrobenzenesulphonic acid, sodium salt |
127-68-4 |
2.6E+03 |
1.7E-07 |
3.9E-05 |
| Nitrogen dioxide and other NOx |
10102-44-0 |
0 |
0 |
3.7E-03 |
| Nitrous oxide |
10024-97-2 |
2.0E+03 |
0 |
0 |
| Ozone |
10028-15-6 |
5.0E+04 |
0 |
0 |
| Phenol |
108-95-2 |
0 |
0 |
6.4E-05 |
| Phosgene |
75-44-5 |
2,0E+06 |
0 |
0 |
| Propylene glycol,1.2-propanediol |
57-55-6 |
0 |
0 |
7.7E-04 |
| Selenium |
7782-49-2 |
0 |
0 |
5.5E-02 |
| Silver |
7440-22-4 |
0 |
0 |
5.3 |
| Sodium benzoate |
532-32-10 |
0 |
0 |
1.7E-04 |
| Sodium hypochlorite |
7681-52-9 |
0 |
0 |
2.5E-02 |
| Styrene |
100-42-5 |
1.0E+03 |
0 |
0 |
| Sulphamic acid |
5329-14-6 |
0 |
0 |
1.2E-05 |
| Sulphur dioxide |
7446-09-5 |
1.3E+03 |
0 |
0 |
Annex 8.3: EDIP97 characterisation factors for human toxicity assessment for emissions to soil (Wenzel et al., 1997)
| Emissions to soil as compartment
first |
| Substance |
CAS no. |
EF(hta) |
EF(htw) |
EF(hts) |
| |
|
m3/g |
3m/g |
3m/g |
| |
|
|
|
|
| Tetrachlorethylene |
127-18-4 |
2.9E+04 |
0.36 |
4.0E-02 |
| Thallium |
7440-28-0 |
0 |
0 |
13 |
| Titanium |
7440-32-6 |
0 |
0 |
0,47 |
| Toluene |
108-88-3 |
2.5E+03 |
4.0E-03 |
1.0E-03 |
| Toluene diisocyanate 2.4/2.6 mixture |
26471-62-5 |
0 |
0 |
1.5E-02 |
| Toluene-2.4-diamine |
95-80-7 |
0 |
0 |
1.1E-02 |
| Trichloroethylene |
79-01-6 |
1.9E+04 |
9.1E-04 |
6.9E-04 |
| Triethanolamine |
102-71-6 |
0 |
0 |
1.4E-02 |
| Triethylamine |
121-44-8 |
0 |
0 |
1.2 |
| Vanadium |
7440-62-2 |
0 |
0 |
1.2 |
| Vinylchloride |
75-01-4 |
3.9E+05 |
0.40 |
4.0 |
| Xylenes, mixed |
1330-20-7 |
6.7E+03 |
1.1E-03 |
6.7E-05 |
| Zinc (as dust) |
7440-66-6 |
0 |
0 |
1.6E-02 |
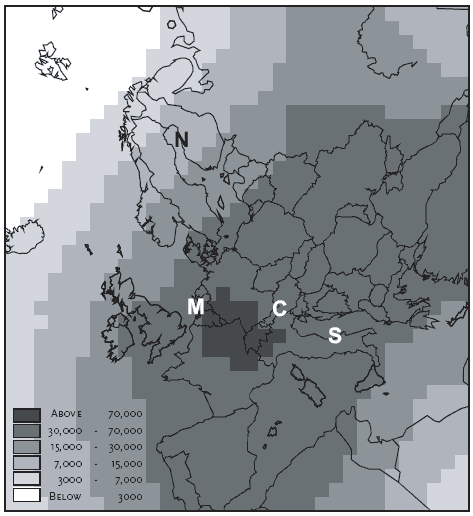
Annex 8.4: Populations densities spatially resolved over Europe
(Tobler et al. 1995)
Estimate of population densities for 1994 from Tobler et al. (1995). Locations of the Northern, Central, Southern European and maritime sites are indicated with capital letters.
Annex 8.5: Regional exposure to hydrogen chloride
The regional exposure (in person•μg•m-3) over the total receiving area (from 10km to several hundred to thousand kilometres) caused by the release of one gram hydrogen chloride gas at a height of 25m in
the source grid-square. The mean exposure is 2460 person•μg•m-3 per gram emitted, and the standard deviation is 1600 person•μg•m-3 (both weighted for population density). The exposure caused by a
similar emission released at a height of 150m can be obtained by multiplying with a factor 1.30 (stdev. 0.02). The exposure caused by a release at 1m can be obtained by multiplying with a factor 0.89 (stdev. 0.04). The large capitals in the figure indicate the point for which local exposures in Annex 8.7 have been calculated.
Annex 8.6: Regional exposure to benzene
The regional exposure (in person•μg•m-3) over the total receiving area (from 10km to several hundred to thousand kilometres) caused by a release of one gram benzene at a height of 25m in the source
grid-square. The mean exposure is 50000 person•μg•m-3 per gram emitted, and the standard deviation is 33000 person•μg•m-3 (both weighted for population density). The exposure increase is extrapolated
outside the European grid to cover transport distances up to the level where all benzene is removed from the atmosphere (see Potting et al., 2005b). The height of release hardly influences the resulting
exposure due to the long lifetime of benzene, and therefore no calculations are made for the other release heights of benzene. The large capitals in the figure indicate the points for which local exposures in
Annex 8.7 have been calculated.
Annex 8.7: Local exposure to hydrogen chloride and benzene
The table shows the exposure from an emission of one gram of benzene and hydrogen chloride local to the source (0-10km) and released at different heights (1m, 25m and 150m) and in different climate
regions in Europe. Also given are the exposures at smaller distances from the source (0.5km, 5km and 10km). The exposures are expressed as a proportion of the accumulated benzene exposure at 10km
distance (20•20km2) resulting from a release at a height of 25m in South Europe (69.7 person•μg•m-3). The population density is in all cases one person•km-2. The locations chosen to represent the four
European regions in the table are indicated on the maps of Annex 8.5 and 8.6.
| | |
Benzene |
|
Hydrogen chloride |
|
|
| |
|
0.5km |
5km |
10km |
|
0.5km |
5km |
10km |
|
|
| R |
150m |
|
0.02 |
0.05 |
Maritime |
Similar as for benzene |
150m |
R |
| E |
|
|
0.02 |
0.04 |
North europe |
|
E |
| L |
|
|
0.03 |
0.07 |
Central europe |
|
L |
| E |
|
|
0.04 |
0.08 |
South europe |
|
E |
| A |
25m |
0.02 |
0.2 |
0.31 |
Maritime |
|
0.16 |
0.23 |
25m |
A |
| S |
|
0.03 |
0.25 |
0.42 |
North europe |
|
0.2 |
0.28 |
|
S |
| EH |
|
0.04 |
0.53 |
0.93 |
Central europe |
|
0.36 |
0.5 |
|
EH |
| E |
|
0.04 |
0.57 |
1 |
South europe |
|
0.38 |
0.52 |
|
E |
| I |
1m |
0.24 |
0.49 |
0.59 |
Maritime |
0.2 |
0.33 |
0.37 |
1m |
I |
| G |
|
0.25 |
0.53 |
0.67 |
North europe |
0.2 |
0.33 |
0.38 |
|
G |
| H |
|
0.68 |
1.41 |
1.75 |
Central europe |
0.45 |
0.63 |
0.68 |
|
H |
| T |
|
0.75 |
1.55 |
1.91 |
South europe |
0.47 |
0.63 |
0.67 |
|
T |
Annex 8.8: EDIP2003 normalisation reference for human toxicity via air
Based on national emission inventories for a number of European countries provided by Christensen, 2005, a European normalisation reference is calculated for human toxicity via air applying the EDIP2003
exposure factors and the EDIP97 characterisation factors according to Equation 8.2 for site-dependent human toxicity impact.

A number of assumptions have been made:
1. In the absense of a complete set of national emission inventories for the EU countries, the normalisation reference has been based on inventories which cover relatively few priority emissions and which
have been available for 11 European countries. The inclusion of the missing EU countries is not expected to change the resulting European normalisation reference significantly.
2. For every substance in the national emission inventory, it has been decided whether the atmospheric residence time is best represented using hydrogen chloride or benzene as model compound.
3. The regional site-dependent exposure factor (sd-HEFregional(h)s,i) has been assumed constant for the whole emission country and determined as the midpoint of the interval which covers the largest part
of the country in the maps in Annex 8.5 and Annex 8.6 (for hydrogen chloride like and benzene like substances respectively).
4. For nearly all substances in the national emission inventories, it has been assumed that the emission source is industrial and that the emission height is 25 m. For the emissions of NOx and PM10, the main
emission source has been assumed to be transport processes where an emission height of 1 m is more appropriate. For the HCl-like emissions the exposure factors given in Annex 8.5 are multiplied by a
factor 0.89. For benzene-like substances no the exposure is only insignificantly influenced by the emission height. The influence of the assumed emission height on the normalisation reference is modest.
5. The site-generic local exposure factor (sg-HEFlocal(h)s,i) is determined from Annex 8.7 where it is tabulated for benzene-like and HCl-like substances as a function of European region and emission
height. The site-dependent local exposure factor is found by multiplying by the population density (PDi) in the surroundings of the emission point. In the lack of such specific information for the individual
emissions behind the national emission
inventories, the average population densities of the respective countries have been assumed (varying from 20 persons/km2 in Norway to 456 persons/km2 in the Netherlands). Particularly for the short-lived
HCl-like substances this may be a significant source of error.
The total impact for Europe as well as for the 11 individual countries is calculated in the the table below and the person equivalent is calculated using the size of the population in the 11 countries together.
| |
|
|
|
Austria |
|
Denmark |
|
| |
Main source |
Benzene orHCl |
Char. factor |
Emission |
Impact potential |
Emission |
Impact potential |
| |
|
|
(EDIP97) |
1994 |
sd-EP(HTA) |
1994 |
sd-EP(HTA) |
| |
|
|
EF(hta) |
ton/Year |
|
ton/year |
|
| Total impact (/year) |
|
|
|
|
4.48E+14 |
|
3.96E+14 |
| |
|
|
|
|
|
|
|
| Population (persons) |
|
|
|
|
8.00E+06 |
|
5.13E+06 |
| |
|
|
|
|
|
|
|
| Normalisation reference(/year/person) |
|
|
|
|
5.60E+07 |
|
7.71E+07 |
| Substance |
|
|
|
|
|
|
|
| SO2 |
industry |
Benzene |
1.30E+03 |
5.49E+04 |
4.01E+12 |
1.58E+05 |
1.10E+13 |
| NOx |
transport |
HCl |
8.60E+03 |
1.71E+05 |
1.13E+13 |
2.76E+05 |
1.08E+13 |
| N2O |
industry |
Benzene |
2.00E+03 |
1.27E+04 |
1.43E+12 |
1.22E+04 |
1.31E+12 |
| CO |
industry |
Benzene |
8.30E+02 |
1.18E+06 |
5.51E+13 |
7.15E+05 |
3.18E+13 |
| nmVOC |
industry |
HCl |
1.00E+04 |
2.90E+05 |
1.99E+13 |
1.54E+05 |
5.95E+12 |
| Cd |
industry |
Benzene |
1.10E+08 |
2.72E+00 |
1.68E+13 |
1.19E+00 |
7.01E+12 |
| As |
industry |
Benzene |
9.50E+06 |
3.26E+00 |
1.74E+12 |
7.42E-01 |
3.77E+11 |
| Cr(VI) |
industry |
Benzene |
1.00E+06 |
6.62E+00 |
3.72E+11 |
3.49E+00 |
1.87E+11 |
| Hg |
industry |
Benzene |
6.70E+06 |
2.18E+00 |
8.21E+11 |
7.58E+00 |
2.72E+12 |
| Ni |
industry |
Benzene |
6.70E+04 |
3.55E+01 |
1.34E+11 |
2.21E+01 |
7.93E+10 |
| Pb |
industry |
Benzene |
1.00E+08 |
2.43E+01 |
1.37E+14 |
3.95E+01 |
2.11E+14 |
| Se |
industry |
Benzene |
1.50E+06 |
4.71E+00 |
3.97E+11 |
1.32E-01 |
1.06E+10 |
| Cu |
industry |
Benzene |
5.70E+02 |
9.24E+00 |
2.96E+08 |
1.06E+01 |
3,24E+08 |
| Zn |
industry |
Benzene |
8.10E+04 |
2.08E+02 |
9.47E+11 |
1.18E+02 |
5,12E+11 |
| Formaldehyde |
industry |
HCl |
1.30E+07 |
|
0.00E+00 |
|
0.00E+00 |
| Benzene |
industry |
Benzene |
1.00E+07 |
|
0.00E+00 |
7.33E+01 |
3.92E+13 |
| Phenol |
industry |
HCl |
1.40E+06 |
|
0.00E+00 |
|
0.00E+00 |
| Styrene |
industry |
HCl |
1.00E+03 |
|
0.00E+00 |
|
0.00E+00 |
| Toluene |
industry |
HCl |
2.50E+03 |
|
0.00E+00 |
1.84E+02 |
1.78E+09 |
| Xylenes |
industry |
HCl |
6.70E+03 |
|
0.00E+00 |
7.33E+01 |
1.90E+09 |
| PAH |
industry |
Benzene |
5.00E+07 |
4.58E+02 |
1.29E+15 |
3.70E+01 |
9.91E+13 |
| Fluoranthen |
industry |
Benzene |
n.a. |
|
|
2.30E+01 |
|
| Benzo(b)fluoranthen |
industry |
Benzene |
n.a. |
|
|
3.62E+00 |
|
| Benzo(k) fluoranthen |
industry |
Benzene |
n.a. |
|
|
1.36E+00 |
|
| Benzo(a) pyren |
industry |
Benzene |
n.a. |
|
|
2.67E+00 |
|
| Benzo(g,h,i)per ylene |
industry |
Benzene |
n.a. |
|
|
4.29E+00 |
|
| Indino(1.2.3-c,d)pyren |
industry |
Benzene |
n.a. |
|
|
2.29E+00 |
|
| PAH-eq. (benzo(a) pyren) |
industry |
Benzene |
5.00E+07 |
5.43E+01 |
1.53E+14 |
4.38E+00 |
1.17E+13 |
| Dioxin |
industry |
Benzene |
2.90E+10 |
2.90E-05 |
4.73E+10 |
1.40E-05 |
2.17E+10 |
| PCP |
industry |
Benzene |
8.30E+03 |
|
0.00E+00 |
|
0.00E+00 |
| Hexachlor-benzene (HCB) |
industry |
Benzene |
8.30E+03 |
|
0.00E+00 |
6.26E+03 |
2.78E+12 |
| Tetrachlorometh ane (TCM) |
industry |
Benzene |
2.90E+04 |
|
0.00E+00 |
3.00E-01 |
4.66E+08 |
| Trichloro-ethylene (TRI) |
industry |
Benzene |
1.90E+04 |
|
0.00E+00 |
4.78E+02 |
4.86E+11 |
| Tetrachloroethy lene (PER) |
industry |
Benzene |
2.90E+04 |
|
0.00E+00 |
3.54E+02 |
5.50E+11 |
| Trichloro-benzene (TCB) |
industry |
Benzene |
8.30E+03 |
|
0.00E+00 |
4.06E+02 |
1.80E+11 |
| Trichloro-ethane (TCE) |
industry |
Benzene |
9.20E+02 |
|
0.00E+00 |
1.00E+01 |
4.93E+08 |
| Hexachloro-hexane (HCH) |
industry |
Benzene |
8.30E+03 |
|
0.00E+00 |
9.20E+00 |
4.09E+09 |
| Chlorbenzenes |
industry |
Benzene |
8.30E+03 |
|
0.00E+00 |
1.41E+03 |
6.27E+11 |
| Vinylchloride |
industry |
Benzene |
3.90E+05 |
|
0.00E+00 |
|
0.00E+00 |
| Particulate matter (PM10) |
transport |
Benzene |
2.00E+04 |
3.70E+04 |
4.57E+13 |
5.10E+04 |
5.68E+13 |
| |
|
|
|
|
|
|
|
| Total |
|
|
|
|
4.48E+14 |
|
3.96E+14 |
| Exposure factor (person•μg/m3/g) |
egional, sd-HEFreg(h) |
|
|
|
|
|
|
| -benzene |
|
|
|
50000 |
|
50000 |
|
| -HCl |
|
|
|
3500 |
|
1500 |
|
| Exposure factor (person•μg/m3/g) |
ocal, sd-HEFloc(h) |
|
|
|
|
|
|
| -benzene |
|
|
|
0.93 |
|
0.42 |
|
| -HCl |
|
|
|
0.5 |
|
0.28 |
|
| Population density |
(pers/km2) |
|
|
96 |
|
121 |
|
Click here to see the Table
Click here to see the Table
| | United Kingdom |
|
Europe |
| |
Emission |
Impact potential |
|
| |
1994 |
sd-EP(HTA) |
|
| |
ton/Year |
|
|
| Total impact (/year) |
|
1.13E+16 |
4.37E+16 |
| Population (persons) |
|
5.82E+07 |
2.55E+08 |
| Normalisation reference(/year/person) |
|
1.95E+08 |
1.71E+08 |
| |
|
|
|
| Substance |
|
|
|
| SO2 |
2.70E+06 |
1.94E+14 |
|
| NOx |
2.39E+06 |
1.95E+14 |
|
| N2O |
9.95E+04 |
1.10E+13 |
|
| CO |
5.97E+06 |
2.73E+14 |
|
| |
|
|
|
| nmVOC |
2.35E+06 |
1.73E+14 |
|
| |
|
|
|
| Cd |
2.35E+01 |
1.43E+14 |
|
| |
|
|
|
| As |
1.12E+02 |
5.87E+13 |
|
| |
|
|
|
| Cr(VI) |
6.33E+01 |
3.49E+12 |
|
| |
|
|
|
| Hg |
1.95E+01 |
7.21E+12 |
|
| |
|
|
|
| Ni |
4.67E+02 |
1.73E+12 |
|
| |
|
|
|
| Pb |
1.75E+03 |
9.66E+15 |
|
| |
|
|
|
| Se |
9.93E+01 |
8.22E+12 |
|
| |
|
|
|
| Cu |
7.92E+01 |
2.49E+09 |
|
| |
|
|
|
| Zn |
1.31E+03 |
5.86E+12 |
|
| |
|
|
|
| Formaldehyde |
|
0.00E+00 |
|
| |
|
|
|
| Benzene |
|
0.00E+00 |
|
| |
|
|
|
| Phenol |
|
0.00E+00 |
|
| |
|
|
|
| Styrene |
|
0.00E+00 |
|
| |
|
|
|
| Toluene |
|
0.00E+00 |
|
| |
|
|
|
| Xylenes |
|
0.00E+00 |
|
| |
|
|
|
| PAH |
7.64E+02 |
2.11E+15 |
|
| |
|
|
|
| Fluoranthen |
|
|
|
| Benzo(b)fluoranthen |
|
|
|
| Benzo(k)fluoranthen |
|
|
|
| Benzo(a)pyren |
|
|
|
| Benzo(g,h,i)perylene |
|
|
|
| Indino(1.2.3-c,d)pyren |
|
|
|
| PAH-eq. (benzo(a)pyren) |
9.05E+01 |
2.50E+14 |
|
| Dioxin |
7.93E-04 |
1.27E+12 |
|
| PCP |
5.55E+02 |
2.54E+11 |
|
| Hexachlorobenzene (HCB) |
1.20E+00 |
5.50E+08 |
|
| Tetrachloromethane (TCM) |
3.19E+03 |
5.11E+12 |
|
| Trichloroethylene (TRI) |
2.03E+04 |
2.13E+13 |
|
| Tetrachloroethylene (PER) |
1.13E+04 |
1.81E+13 |
|
| Trichlorobenzene (TCB) |
6.29E+02 |
2.88E+11 |
|
| Trichloroethane (TCE) |
2.47E+04 |
1.25E+12 |
|
| Hexachlorohexane (HCH) |
1.14E+02 |
5.22E+10 |
|
| Chlorobenzenes |
|
0.00E+00 |
|
| Vinylchloride |
|
0.00E+00 |
|
| Particulate matter (PM10) |
2.70E+05 |
2.98E+14 |
|
| Total |
|
1.13E+16 |
|
| Exposure factor regional, sd-HEFreg(h) (person• μg/m3/g) |
|
|
|
| -benzene |
50000 |
|
|
| -HCl |
3500 |
|
|
| Exposure factor local, sd-HEFloc(h) (person• μg/m3/g) |
|
|
|
| -benzene |
0.31 |
|
|
| -HCl |
0.23 |
|
|
| Population density(pers/km2) |
240 |
|
|
Annex 8.9: Typical situations where background concentrations are near or above no-effect-levels for selected air pollutants The information may be used as a first step in the interpretation to
help evaluate whether no-effect-levels are likely to be exceeded by the emission of a given process.
| Substance |
Recommendedtreshold level(s)# |
Sources |
Typical exposure situations and exposure levels in relation
to treshold
level, focus on"near or above treshold"& |
| NOx |
one hour daily maximum 200 μg/m3(0.11 ppm) |
Outdoor
Mainly combustionprocesses:Traffic (50%), industry
(20%), other mobile sources(10-15%) |
Outdoor, air
>40μg /m3 (annual average)
in large American, European, and Asian cities>50 μg/m3 (annual
average) for 40% of European urban population>400 μg/m3 (1-h)
in some megacities(e.g. Cairo, Delhi, London, Los Angeles, Sao Paulo) Regional
conc. may reach 60-70μg/m3 (24-h) in most of Central europe |
| 40μg/m3 (0.023 ppm) annual average |
| Indoor Gas stoves, unven-ted gas
space |
| 150 μg/m3 |
| 24 hour average |
heaters, waterheaters etc.Outdoor sources |
Indoor, air>100 μg/m3 (average over 1-2 weeks)
in 50% of homes and >480 μg/m3 in
8%of homes with kerosene heaters >100 μg/3 (average over 1-2 weeks) in70%
of homes and >480 μg/m3 in
20%of homes with unvented gas spaceheaters> 100 μg/m3 (average
over 1-2 weeks)in some homes with gas coolers andgas stoves 849 μg/m3 (peak
1-h) in homes with kerosene heaters Indoor exposure especially highduring winter
(high heatproduction and low ventilation) |
| Substance |
Recommendedtreshold level(s)# |
Sources |
Typical exposure situations and exposure levels in relation
to treshold
level, focus on"near or above treshold"& |
| SO2 |
500 μg/m3
10 min. average |
OutdoorMajor sources:
Fuel combustion (especially energyproduction
and manufacturing industries) |
Outdoor, air
> 6000 μg/m3 (short
term) in somehighly industrialised areas> 700 μg/m3 (peak-concentrations)
in
some megacities> 100 μg/m3 (24-h) for 70% of
European urban population100-150 μg/m3 (24-h)
during smogperiods in some parts of Central/East Europe. No indication of
whether
the annual average will be
exceeded.> 150 μg/m3 (annual average)
in
some megacities (e.g. Beijing. MexicoCity and Seoul)50-100 μg/m3 (annual
average) in
some other megacities (e.g. Rio deJaneiro and Shanghai) |
| 350 μg/m3one hour average |
| 125 μg/m324 hour average |
Other sources:
Industrial processes
and road traffic |
| 50 μg/m3annual average |
| Particles. |
|
Outdoor |
Outdoor, air |
| PM10 |
No human threshold mechanism (noWHO nor EU Guideline) Recommended
UKlimit value:50 μg/m324 hour average |
Combustion processes (especially dieselengines )Natural
sources |
50 μg/m3 (24-h) exceeded extensive-ly
in many European cities Regional concentrations up to 25μg/m3 (annual
average) in certain parts of Central/North EasternEurope 200-600 μg/m3 (annual
average) in12 megacities (mainly Asian, butalso Mexico City and Cairo) |
| CO |
100 μg/m3 |
Main source: |
Outdoor, air |
| |
15 min. average |
Road traffic |
up to 67 μg/m3 (1-h) in Mexico City30-60 μg/m3 (1-h),
10-20 μg/m3 (8-h) in some megacities (Cairo, Jakarta, London, Los
Angeles, Moscow, NewYork, Sao Paulo) Often > 10 μg/m3 (8-h)
in 10-15worst European cities. No indication of whether one houraverage levels
will be exceeded. |
| 60 μg/m330 min. average |
| 30 μg/m3one hour average |
| 10 μg/m38 hour average |
| Substance |
Recommended treshold level(s)# |
Sources |
Typical exposure situations andexposure levels in
relation totreshold level, focus on"near or above treshold"& |
| NMVOCs |
Substance specific. |
Outdoor |
Outdoor, air |
| |
Road traffic (30%)Solvent and otherproduct handling |
Potential problem close to pointsources (e.g. solvent
industry)Traffic (mainly benzene, see below) |
| |
| |
| The different VOCshave different threshold levels. Therefore
it is problematic thatthe substances are usually measured and the resultsreported
be the group parameter`VOC'. Site characterisation must be performedbased on
the individual substances. |
(30%)Agriculture,forestry, etc. (20%)Other non-combustionprocesses
(10%) |
|
| Indoor, airPotential problem. see `sources'column |
| |
| |
Indirect exposure via theenvironment (drinking water
andfood stuff)Needs case-to-case assessment.Especially a problem for bio-accumulating
and difficultdegradable substances |
| Indoor |
| Office machinesCleaning agentsTobacco smoke MicrobialformationBio
effluents (fromhumans)Cosmetics Building materials Stripped from tapwater duringshowering,
toiletflush. etc. |
| |
| |
| Substance |
Recommendedtreshold
level(s)# |
Sources |
Typical exposure situations andexposure levels in relation totreshold
level, focus on"near or above treshold"& |
| Benzene |
6 μg/m3 (life time) |
Outdoor
Non combusted benzene in petrol |
Outdoor. air
up to 100 μg/m3 in urban
areas withhigh traffic intensity |
| |
Drinking water:10 μg/l |
Point sources (e.g.petrol fillingstations and other fuel
handling facilities )Underground petroleum tanks (in relation to drinking watercontamination) |
5-30 μg/m3 general urban populationmay > 6 μg/m3 in
someindustrialised areas3.2 -10 μg/m3 (= 3200 -10.000 μg/m3)during
petrol filling (short term!) |
| |
| Indirect exposure via the environment (drinking
water and food stuff)Up to 330 μg/l has been measured in drinking water locally Levels
usually below 10 μg/l |
| |
Indoor
Cigarette smoke Building materials Stripped
from tapwater during showering. toiletflush. etc. |
| |
Indoor. air
Cigarette smokers have a high intake758-1670 μg/m3 (short
term) has been measured in the shower stallduring showering366-498 μg/m3 (short
term) hasbeen measured in bathroom duringshowering |
| |
| Substance |
Recommendedtreshold level(s)# |
Sources |
Typical exposure situations and exposure levels in relation
totreshold
level, focus on"near or above treshold"& |
| Chloro-form |
TDI: 8-10 μ g/kg bw/day |
Outdoor |
Outdoor, air |
| |
|
Manufacturing and further processing of the substance Reactions
between organic matter and chlorine (paperbleaching.chlorination of drinking
water. chlorination
of cooling water.chlorination of waste water) Decomposition of other chlorinated compounds |
0.1 - 0.25 μg/m3 in remote cleanareas
in the US 0.3 - 9.9 μg/m3 in urban US areas 4.1 - 160 μg/m3 occasionally
near US point sources< 1 μg/m3 (general exposure level) for
Dutch and German conditions |
(23 μg/m3 over lifetime)
See footnote!! |
| |
| |
Indirect exposure via the environment (drinking
water and food
stuff)
Drinking water: Occasionally up to 60 μg/l (equalling approx. 2 μg/kg
bw day assuming 2 l water consumption a day and 64 kg body weight) in theUS
Op
til 14 μg/l
in Germany
Op til 18-36 μg/l in Japan |
| |
Indoor
Stripped from tapwater during showering,
toilet flush, etc. |
|
Indoor, air
1-10 μg/m3 (general indoor level) 100 μg/m3 is
common in swimmingpools |
| |
| Substance |
Recommendedtreshold level(s)# |
Sources |
Typical exposure situations andexposure levels in relation totreshold
level, focus on"near or above treshold"& |
| HCB |
TDI: 0.11 μg/kg bw/dag |
Outdoor |
Outdoor. air |
| |
|
Chlorinated pesticides Incomplete combustion Old
dump sites Waste managemen tof chlorinated solvents and pesticides |
few ng/m3 (or less) distant frompoint
sourcesHigher near point sources |
(0.47 μg/m3 lifetime)≠
See footnote!! |
| |
| |
Indirect exposure via the environment (drinking
water and food stuff) 0.0004-0.003 μg/kg bw./day; estimated usual US intake
(<<TDI) Critical
exposure levels may be reached in population groups with a diet high in wild
life animals. HCB
accumulates in breast milk. where baby exposures of 0.0018-5.1μg/kg bw/day
have been reported |
| |
| Dioxins |
TDI: 10 pg/kg bw*/day |
Outdoor |
Outdoor. air |
| |
|
Combustion processes (wastes. fossils and wood) Production.
use and disposal of certain chemicals (e.g.chlorinated pesticides and benzenes) Pulp
bleaching Recycling of metals |
Critical exposure levels can be reached near combustion
plants State-of-the-art incinerators with proper air pollution prevention devices
should not pose significant risk |
| |
Indirect exposure via the environment (drinking
water and
food stuff)
0.3-3.0 pg/kg bw/day - general population
Critical exposure levels
may be reached in breast milk and populations eating many wild life fish |
| |
| Substance |
Recommended treshold level(s)# |
Sources |
Typical exposure situations and exposure levels in relation
to treshold level,
focus on"near or above treshold"& |
| Lead. Pb |
0.5 μg/m3annual average |
Outdoor |
Outdoor. air |
| |
Mining and smelting of lead
Lead in petroladditives Handling
of products containing lead (batteries, cables. pigments,solder, steelproducts) Oil
and coalcombustion Natural sources (volcanicactivity and geological weathering) |
Threshold may be exceeded in areas with a high traffic
intensity in countries where lead is still used as a petrol additive Highexposure
levels may be reached close to point sources (e.g. in the vicinity of lead smelters) |
| |
| Drinking water:0.05 μg/l |
| |
| |
Indirect exposure via theenvironment (drinking water
andfood stuff)
Drinking water levels usually < 5μg/l. but may exceed 100 μg/l
(0.1μg/l) in taps with lead plumbing Average US adult intake is 56.5mg/day
mainly from food stuff (dairy products, meat, fish,poultry, grain & cereal
products, vegetables. fruits and beverages). Levels in food stuff rely on background
concentration/production site and lead intakelevels may locally be critical Especially
high intakes may occur for "soil-eating" children playing at contaminated
sites |
| |
| Substance |
Recommended treshold level(s)# |
Sources |
Typical exposure situations and exposure levels in relation
to treshold
level, focus on"near or above treshold"& |
| Cadmium, Cd |
5 μg/m3 (life time) |
Outdoor |
Outdoor. air |
| |
|
Metal mining and production (zinc, cadmium, copper,lead)
Phosphate
fertiliser manufacture |
Elevated levels close topollution sources maycontribute
significantly to thetotal intake |
| |
Drinking water:0.005 μg/l
Provisional intake:0.4-0.5 μg/week |
Indirect exposure via the environment (drinking
waterand
food stuff)
Average US adult intake is 0.21-0.23 μg/week mainly from food stuff
(grain, cereal products, potatoes and other vegetables) Levels in food stuff
rely on background concentration/production site and cadmiumintake levels may
locally be above the recommended weekly intake level |
| |
| Cement manufacture |
| |
| |
| Wood combustion |
| |
| Natural sources (volcanic activity and geological weathering) |
| |
| Other routesIntake via smoking |
Other routes
Smokers may obtain inhalation intake
levels comparable to the provisional intake |
| |
| Substance |
Recommended treshold level(s)# |
Sources |
Typical exposure situations and exposure levels in relation
to treshold
level, focus on"near or above treshold"& |
| Mercury. Hg |
1 μg/m3annual average |
Outdoor |
Outdoor. air |
| |
|
MiningIndustrial processes incl. Hg (e.g. chlor-alkali)Coal
and otherfossil fuelcombustion Cement production
Waste incineration |
Air intakes usually of minor importance |
| |
| Drinking water0.001 μg/l (organic Hg) |
Indirect exposure via the environment (drinking
water and
food stuff) General intake levels 0.22-0.86μg/kg/week Critical levels may
be reached in population groups with a high consumption of marine mammals (mainly
fish) and in particular breast feed children (due to Hg accumulation in milk) |
| |
| Provisional intake5 μg/kg bw*/week (total Hg)3 μg/kg
bw*/week (CH3Hg) |
| |
| |
Other routes
Dental amalgam |
|
Other routes
Dental amalgam may contribute about 10 μg/day (equalling about 1 μg/kg/week) |
| |
≠ To be used with caution. Has been derived from the TDI assuming: 64 kg body weight, inspiration of 22 m3 per day and the same bioavailability/uptake via oral and inhalation exposure. Especially the
latter assumption may be questioned.
* `bw': Abbreviation for `body weight'.
# In relation to LCA, attention must be paid to substances with non-threshold mechanisms, e.g. benzene and particles. For these substances, any elevation in exposure will result in an elevated risk. The
recommended threshold levels are therefore less relevant in relation to site characterisation. & For industrialised countries, regulation of point sources will often aim at protecting the surrounding area from
above threshold exposure situations. This assumption may often be interpreted as default, but exceptions may occur.
Footnotes
4 The term "exposure" in the remainder of this chapter is equivalent with the term "increase of accumulated exposure" in Chapter 6 in Potting and Hauschild (2004).
5 The EUTREND model follows a
Gaussian plume approach to calculate concentration spatially resolved over the European grid. A specific strength of EUTREND is its capacity to accurately model the local dimension of emission dispersion
by using 1990 meteorology (annual statistics mean).
6 The Wind rose Model Interpreter (WMI) is part of the integrated assessment model EcoSense. WMI follows trajectory modelling based on region dependent atmospheric conditions (1990 annual
statistics mean).
7 Co-operative Program for Monitoring and Evaluation of the long range transmission of air pollutants in Europe.
| Front page | | Contents | | Previous | | Next | | Top |
Version 1.0 january 2006, © Danish Environmental Protection Agency
|