|
Pesticides Research no. 97, 2005 Autonomous Weeder for Christmas Trees – Basic Development and TestsContents2 Previous studies and development work 3 Requirements and system concept
PrefaceAgriculture, horticulture and forestry have in the past benefited from a succession of technological developments that have brought greater productivity and economic efficiency. Historically, the emphasis of these developments has been on the mechanisation to increase work rates through use of larger and more powerful machines. The newer information based technologies have already been used for some time to improve functions and controls of machinery, especially for spatial variation of treatments or commonly known as Precision Farming. These technologies have now reached a stage, which seems to make it realistic to develop autonomous field machinery and methods for individual treatment of plants. Christmas trees are, because of their size and the way they are grown, well-suited for a first attempt, as it is impossible to use standard agricultural machinery for non-chemical treatments. The previous feasibility study of developing an autonomous weeder for Christmas trees (Have et al. 2002) led to the conclusion, that it would be realistic, and that it would lead to a number of environmental benefits compared to the present practise of using frequent herbicide applications. On the basis of these results, the present development was carried out in collaboration between the AgroTechnology group and the Research Centre of Forestry and Landscape, of the Royal Veterinary and Agricultural University, Denmark. The results are positive and this phase of the development work is completed. Although the experimental weeder is able to operate as planned, more work is needed before it is ready for commercialisation. The authors would like to acknowledge with thanks the valuable contributions and assistance we have received from:
The study was supported financially by the Danish Environmental Protection Agency of the Ministry of Environment. SammenfatningRobotlugning af juletræer er nu en realistisk mulighedUdviklingsarbejde har vist, at det er muligt at udvikle en lille førerløs maskine, der effektivt kan bekæmpe ukrudt i juletræsplantager. Baggrund og formålUkrudtsbekæmpelse i juletræsplantager er essentiel for god vækst og kvalitet. Den udføres oftest ved sprøjtning med herbicider, der kan have uønskede miljømæssige effekter. Nyere mekaniske bekæmpelsesmetoder er udviklet, men disse må udføres med specialmaskiner, som er dyre at anvende, især på grund af det høje arbejdskraftbehov. Formålet med nærværende projekt har været at udvikle og afprøve en førerløs lugemaskine med henblik på løsning af disse problemer og gøre produktionen af juletræer mere bæredygtig. Udgangspunktet for arbejdet var forsøg, der viste, at det af hensyn til væksten er tilstrækkeligt at bekæmpe ukrudtet i cirkler af 40 cm radius omkring det enkelte træ, svarende til ca. 40 % af det totale areal i kulturer med normal planteafstand. Det ikke bekæmpede ukrudt på den øvrige del af arealet kan måske have både positive og negative virkninger på træerne. UndersøgelsenDen autonome maskine er opbygget på en platform fra en selvkørende 4-hjulet græsslåmaskine af en størrelse og udformning, der passer til færdsel mellem juletræer. Modificeringen af maskinen er udført med henblik på at opfylde definerede krav til autonom operation. Den har omfattet udskiftning af den originale centerplacerede klipperotor med en mindre enhed (diameter 320 mm). Denne nye enhed blev monteret på en arm, som kunne svinges ud til siden under træernes grene og således klippe omkring stammerne. Maskinens betjeningshåndtag til aktivering af kobling/bremser, gear, styretøj, gasspjæld, klipperotorarm og klipperotorkobling blev erstattet med elektriske aktuatorer. Endvidere blev der monteret et antal sensorer, herunder et meget præcist RTK GPS (Real Time Kinematic Global Positioning System). Disse eksterne enheder blev forbundet til en indlejret computer, som sammen med det øvrige elektroniske udstyr er placeret i en beskyttende boks foran på maskinen. Brugeren kan kommunikere med computeren gennem en trådløs LAN-forbindelse. På maskinens sider, er der monteret skærme, som beskytter træerne mod beskadigelser. I projektet er der udviklet et deterministisk kontrolsystem, hvor styringen af maskinen er baseret på et meget præcist kort over træernes positioner og plantagens afgrænsninger. Ud fra dette kort er der defineret en ruteplan for køretøjet i passende afstand fra rækkerne. Denne ruteplan er anvendt til styring af maskinen, medens træernes positioner kan anvendes til at styre den svingbare klipperotor i forhold til træerne. Plantagegrænserne er anvendt til at sikre, at maskinen kun kan arbejde i den plantage, som aktuelt er repræsenteret ved kortet i computerens hukommelse. Den svingbare klipperotors positionering i forhold til træerne kan styres passivt og aktivt. Den passive styring fungerer på den måde, at rotorarmen holdes inde i rækken mod et stop af en fjeder. Når rotorenheden, hvis topplade har en lidt større diameter end selve rotoren, under kørslen får kontakt med en stamme, bliver den presset tilbage imod fjederkraften, glider udenom og svinger tilbage til den indstillede position. Den aktive styring funger på den måde, at kontrolenheden løbende beregner afstanden mellem klipperotoren og det næste træ. Når afstanden kommer under en vis værdi svinges rotoren væk indtil træet er passeret. Denne styringsmetode er beregnet til nyplantede træer, der er mindre modstandsdygtige mod mekaniske påvirkninger. Styresystemet er udviklet i programmerings- og simuleringsværktøjet Simulink fra MathWorks. Dette værktøj blev først anvendt til at bygge integrerede modeller af både køretøjet og kontrolsystemet. Disse modeller blev derefter benyttet til at simulere funktionen af delsystemer og derefter funktionen af det samlede system indtil den var tilfredsstillende. Da dette var opnået blev modellen af køretøjet populært sagt erstattet af det virkelige køretøj og derefter afprøvet med det udviklede styresystem. Denne afprøvning blev først foretaget i en fysisk model af en juletræsplantage og derefter i en egentlig juletræskultur med forskellige arter og størrelser. Afprøvningen har dog samlet set endnu kun været af begrænset omfang. HovedkonklusionerUdviklingsarbejdet har vist, at det er teknisk muligt at bygge en robot til renholdelse af juletræsplantager og lignende kulturer. Det udviklede kontrolsystem er på jævn overflade i stand til alene på grundlag af information fra GPS-modtageren, at styre maskinen indenfor få cm fra ruteplanen. Men på ujævn overflade er der som ventet behov for korrektion med data fra et hældningsmeter. Det udviklede klippeorgan, der kan arbejder under træernes grene, klippede i de bedste tilfælde helt ind til træernes stammer uden at forårsage observerbare skader. Maskinen fungerede således godt, men driftssikkerheden var lang fra acceptabel. Det samme gælder sikkerheden i forhold til omgivelserne, idet der endnu ikke er udviklet nogen egentlig reaktiv adfærd. Arbejdet har imidlertid også vist, at der findes overskuelige løsninger til afhjælpning af disse problemer, og vi ved nu hvordan fuld autonom operation kan opnås. Konceptet synes lovende for kommercialisering, idet denne type af maskiner også vil kunne anvendes i mange andre rækkekulturer og strukturer, der ligner. Metoden kan således bidrage væsentligt til begrænsning af brugen af herbicider, ligesom maskinen vil være et plus for arbejdsmiljøet. Et økonomisk overslag indikerer, at maskinen med det nuværende prisniveau på komponenter kan blive konkurrencedygtig med den mekaniske renholdelse, der er forbundet med en omkostning på ca. 3000 kr./ha og år. Overslaget indikerer også, at formodede fremtidige prisreduktioner og forbedrede præstationer af komponenter på sigt vil kunne gøre maskinen konkurrencedygtig med kemisk renholdelse, hvilket har en omkostning på ca. 1500 kr./ ha og år). ProjektresultaterI modelplantagen, hvor overfladen var næsten vandret og jævn fulgte maskinen ruteplanen inden for få cm. Klipperotoren arbejdede helt ind til stammerne, når den blev styret på den passive måde, men mindre nøjagtigt når den aktive metode blev brugt. I juletræsplantagen, hvor overfladen var mindre jævn, var maskinen ikke så god til at følge ruteplanen. Dette var forventet idet GPS-antennen som følge af ujævnhederne svingede i forhold til maskinens position og derfor ikke målte maskinens position korrekt. Dette gav en slingrende kørsel. Men kvaliteten af klipperotorens arbejde var alligevel fremragende, når den blev styret på den passive måde. Næsten alle ukrudtsplanter omkring træerne blev klippet af uden observerbare skadevirkninger på træerne. Afprøvningerne viste også, at maskinens pålidelighed og sikkerhed må forbedres betydeligt før den er interessant til praktisk anvendelse. Således forekom der som forventet ret ofte stop som følge af utilstrækkelig kvalitet af GPS-signalet (antagelig som følge af radio skygge fra store træer eller simpelthen fordi der var for få "synlige" satellitter). For at undgå dette problem er det nødvendigt at supplere GPS-systemet med mindst én yderligere sensor. Foreløbige undersøgelser tyder på, at en laser afstandsskanner vil være egnet, idet den formentlig kan detektere rækkernes position og orientering i forhold til maskinen. Endvidere er det nødvendigt at sammensmelte signalet fra denne supplerende sensor med signalet fra GPS-modtageren i et Kalman-filter for at få ekstra nøjagtighed og pålidelighed. Der er også behov for en sensor, der kan detektere større forhindringer foran maskinen. Dette synes også muligt med laser afstandsskanneren. Endelig er der behov for kontaktsensorer, der kan detektere påkørsler. SummaryRobotic weeding of Christmas trees is now a realistic possibilityDevelopment work has shown that it is possible to develop a small driverless machine that can effectively control weeds in Christmas tree plantations. Background and purposeControl of weeds in Christmas tree plantations is essential for good growth and quality of the trees. Weeds are usually controlled by frequent spraying, which may have undesired environmental effects. Recent mechanical weed control methods have been developed, but these must be carried out with special machines, which are expensive to use, especially because of the high labour requirement. The purpose of the present project was to develop and test a small, driverless weeding machine in order to alleviate these problems and make Christmas tree production more environmentally and economically sustainable. The starting point for development of the machinery concept was field experiments, which showed that it with regards to growth was sufficient to control weeds within a circle of 40 cm radius around each tree. This corresponds to about 40 % of the total area. Plants growing on the rest of the area may be left as they provide some shelter and may have a positive effect on the trees. The investigationThe ACW (Autonomous Christmas tree Weeder) is based on a platform from a self-propelled 4-wheel grass mower of a size and shape suitable to operate between rows of Christmas trees and cut weeds around the trees. The machine is modified to include computer control of all major functions and the cutter was changed to suit weed cutting the tree canopy. The modifications included replacement of the original centre mounted rotor cutter with a smaller unit mounted on a swinging arm, which could be moved into the row and under the branches to cut close to the trunks of the trees. The normal driver interfaces were replaced with linear actuators for operation of the clutch, brake, gear, steering, throttle, cutter drive clutch and cutter arm. The primary position sensor was a Real-Time Kinematic Global Positioning System (RTK GPS). These peripherals were connected to an embedded computer, which together with the other electronics were encapsulated in a weatherproof box on the front of the ACW. The computer communicated with the coordinator through a radio Ethernet connection (WiFi). Finally, side shields were fitted to the ACW to protect the trees from damage as the machine passed down the row. This phase of the ACW project developed a deterministic control of the machine which was based on a precise map of the tree positions and the plantation boundaries. From this map a suitable vehicle route plan was defined along the tree rows. This route plan was used to control the machine movement in the rows, while the tree map was used to control the swing-arm rotor cutter. The plantation borders were used to make sure that the machine would only work within the plantation boundary. The swing-arm cutter unit had a passive and an active control mode. In the passive mode the rotor was pulled out into the intra-row area by a spring. On contact with the tree trunk, the cutter unit would be pushed back, slide around the tree trunk and be released into the intra-row area again. The trees were shielded by a padded cover disc which had a slightly larger diameter than the rotating knives. In the active mode the cutter arm would pull in the rotor cutter when it approached a tree and releasing it back into the intra-row area when the tree had passed. This active mode was considered necessary for weeding in plantations with small, newly planted trees, which may be susceptible to being touched by the machine. The control system was developed in the programming and simulation tool: Simulink from MathWorks. This tool was used to build integrated models of the vehicle as well as the control system. These models were used to simulate the functionality of the different elements and the complete system until it worked satisfactorily. When this was achieved the vehicle model was replaced by the real vehicle and tested physically with the control algorithm, first in a full scale model of a plantation and then to a limited extent in a real Christmas tree plantation. The main conclusionsThis work has shown that it is technically feasible to build an autonomous vehicle for weeding in Christmas tree plantations and similar environments. The control system was able to navigate the vehicle within a few cm from the planned track, based on RTK-GPS readings. However, in uneven terrain corrections from a tilt-meter were needed as undulating ground had a serious effect on the roll of the vehicle and therefore changed its indicated position. In the best cases, weeds were cut right up to the trees and there were no significant damages, although repeated touching may cause problems. Although the ACW functioned well, the reliability was not acceptable. Likewise, as the machine operation was totally deterministic no reactive behaviours were programmed into it. Hence the safety with respect to the surroundings was not satisfactory. However, the allied work has led to feasible solutions to these shortcomings and we now know what is needed to make this machine truly autonomous. This concept seems promising for commercialization, since this kind of machine can also be used in other row crops. Thus it seems this method can contribute significantly to reductions in herbicide usage, as well as providing an improved work environment. An economic estimate indicates that an autonomous weeder with the present price levels may be competitive with conventional mechanical weed control (about 3000 DKK/ha). The estimate also indicate that price reductions on electronical components and sensors assumed during the next 5 years may reduce the costs to a level competitive to spraying with herbicides (about 1500 DKK/ha). Project resultsIn the model plantation, with an almost level surface, the ACW followed the route plan with cm-level precision. In passive mode the rotor cutter blades weeded very close to the tree trunks but less precise when the active control mode was used, although this could be improved with a better control model. In the Christmas tree plantation, where the surface was uneven, the ACW had sometimes problems keeping to the route plan. This was due to the GPS antenna translating laterally as the machine rolled. However, the quality of the weeding by the cutter unit was excellent, when used in the passive mode. Almost all weeds around the trees were cut without damage to the trees. To achieve acceptable machine precision under rough conditions it is necessary to use a tilt-meter in combination with the GPS. The trials also showed that the reliability and safety of the ACW needs significant improvements to be acceptable for unsupervised work. Quite often the vehicle stopped (as it should) due to insufficient GPS quality (usually due to radio shadow from large trees or simply due to lack of enough visible satellites). To avoid this problem it is necessary to supplement the GPS (absolute positioning) with at least one relative positioning system such as an Inertial Navigation System (INS) or a local proximity sensor such as a 2D laser scanner, which can detect the row position and orientation relative to the ACW. Furthermore it is necessary to have “sensor fusion” of the signals from this extra sensor and the GPS in a Kalman filter. Finally, it is necessary to have a sensor which can detect large obstructions in front of the ACW, and a bumper with simple force sensors for collision detection. 1 IntroductionChristmas trees occupy a small fraction of the cultivated land, but count for a relatively high input of chemicals per area (Christensen 2003). This may cause problems of leaching of both pesticides and nutrient (Pedersen et al. 2002). Another negative consequence is low flora diversity in plantations treated in this way. These problems place Christmas tree plantations as a high priority area for alternative weeding methods. Some growers already use mechanical weeding implements (Keller, 1997), but these are costly to use because of the high investment, low capacity and high labour requirement. These weeding implements are able to remove weeds between the rows, and a few of them have tools that can remove weeds in the intra-row areas, where weeding is most important. The generally applied strategy of mechanical weeding is the same as for spraying, i.e. to remove all weeds. Therefore, mechanical weeding in the form of tillage also causes problems of leaching and low biodiversity. In latter years several traditionally used persistent soil weed herbicides have been either forbidden or re-evaluated and some producers have started to use screened spraying systems. Weed control by grazing sheep (Theilby 1997) and also soil covering with different materials (Kjærbølling 1997) are possibilities that have been tried, but both methods turned out to be too expensive. Therefore, Christmas trees are still a high priority area for development of alternative weeding methods. In a preliminary feasibility study Have et al. 2002 concluded that use of small, autonomous weeders in Christmas trees would not only be technically feasible but also friendlier to the environment. In addition such weeders could be competitive to ordinary mechanical row weeders in a shorter term. The study also investigated the requirements of weed control, gave an overview of the state of the art of autonomous field vehicle technology and defined the technical requirements of a weeder. It also considered various vehicle concepts and system architectures. The purpose of the present project was to develop and test such a small, autonomous Christmas tree weeder (ACW), including:
2 Previous studies and development workThe present methods of Christmas tree cultivation were described in details in the preliminary feasibility study (Have et al. 2002). The minimum requirement to weeding is determined by: 1) Weed competition on water and nutrients and 2) Damage to the tree branches because of wear against woody weeds. The weed competition was found to be insignificant when weeds were removed within a radius of approximately 40 cm around each tree, when they are small. With increasing tree size weeding is needed in a larger diameter, while the need for weeding close to the trunk is reduced because of low light intensity. Damage of branches can occur during the sensitive sprouting period if weeds are close enough to rub the growing points when moved by the wind. Weeds outside these areas were considered to be harmless or even beneficial, as they may improve biodiversity and have sheltering effects to small trees as well. However, during spring all weeds should be removed to allow heat radiation from the ground to reduce frost damage of the sensitive growing points. The idea and overall concepts of a small, autonomous weeding machines was outlined, including suggestions of operation patterns, physical designs of the vehicle and the system architecture with sensors, databases, navigation system, and actuators. Also the likely costs of using such a machine were estimated and compared to current contractor rates. This study led to the conclusion, that it is realistic to develop an autonomous Christmas tree weeder from a technical point of view, and also that it is possible to fulfil the aim of weeding only part of the area. In addition the machine was considered suitable for collection of tree specific data concerning condition and development for use in plantation management and product documentation. It was also estimated in the study that such a concept would have significantly lower environmental effects than present technologies (spraying and mechanical weeding). In the future it could be of considerable interest in other special cultures such as fruit and berry orchards and plantations. The control concept was based on centimetre precision of the geo-position of each tree as well as the current position of the ACW by means of a RTK GPS (Real Time Kinematic Global Positioning System). The positions of the trees could be measured automatically during machine planting or surveyed-in later on. The resulting tree map is the basis for generating a suitable route plan for navigation over the entire lifetime of the plantation. As a weed control tool, a rotor cutter similar to those used in hand held grass cutters (“Strimmers”) was proposed, because it requires less energy than tillage tools, while the effect on weeds is nearly the same as by tillage. Two platform concepts were proposed: 1) A small, stable machine able to move between the trees. This gives a low mobility platform and a high mobility cutter. (The machine drives in a straight line while the cutter moves in and out) 2) A portal machine with a set of wheels spanning the row and a working tool on either side of the row. The first of these was found to be the simplest and best suited to the purpose. 2.1 Recent developments in field robot technologyAutonomous vehicles are widely used in industrial production and warehouses, where controlled environments can be guaranteed. Autonomous vehicles for use in open environments are much more difficult to develop and this work is at an early stage. No autonomous field machines have yet been marketed for professional use; but a few experimental vehicles have been developed. An overview of the research and development in the area is provided in the feasibility study (Have et al. 2002). The work on field machine automation started long ago, (the first radio controlled tractor was developed in the 1920s) but it was only with access to the high precision RTK GPS and other advanced sensor systems that it became practically realistic to build autonomous field machines (Wilson, 2000; Hollingum, 1999). Development work is now being undertaken in several places, notably Japan and America. A few publications have been published on fully autonomous vehicles, such as the Demeter system for harvesting equipped with a video camera and a GPS for navigation (Pilarski et al. 2002), as well as semi-autonomous vehicles. During recent years, many researchers have started to develop more rational and adaptable vehicles based on a behavioural approach (Blackmore and Fountas et al. 2004; Bak and Jakobsen 2003). Much effort has been put in to developing control systems and architectures to deal with the complexity of the interaction between robots and the semi-natural environment. 2.2 Specific control related issuesThe approach, and hence the system architecture, that has gained increased attention is the hybrid system. This approach combines both deterministic control and reactive behavior. The deterministic control is hierarchical and is used for pre-planned operation in a structured and known environment (e.g. a field), while the reactive behavior is used to respond directly to events and is used for unstructured or unknown environments and conditions (e.g. a tree fallen over in a field). The advantage of reactive behavior is that it can deal with uncertainty in perception. In contrast, a hybrid system combines reactive and goal-oriented control. These hybrid approaches, based on behavior are therefore the centre of focus for many researchers and there have been many control architectures proposed (e.g. Yavuz and Bradshaw, 2002). Recent work at KVL has demonstrated a deterministic tractor capable of carrying out field operations and a fully reactive research robot capable of exploring unknown areas (Blackmore and Griepentrog et al. 2004). A hybrid system that uses the advantages of both techniques is needed to make a practical system. 3 Requirements and system concept
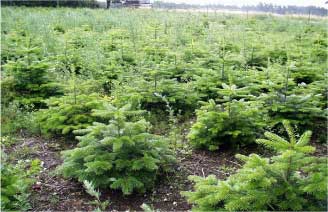
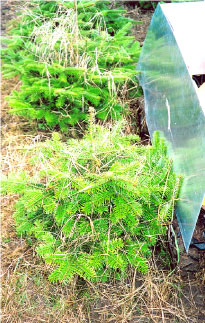
Christmas trees may be considered as an agricultural crop as they are mostly grown on ordinary farmland in rows 1.2 m apart with 1.2 m spacing within the row (Fig. 3.1). The young trees are planted in stands when they are about 20-30 cm high. For the first two years weeds can be controlled by use of long-finger harrows as the young trees are supple enough to withstand the harrows but after that, when the first branches have developed, this method will cause excessive damage and other methods are needed. In the case of Normann fir the first branches develop very close to the ground, but after a few years these branches are removed to restrict top growth of the trees in order to get more homogeneous shapes.
Fig. 3.1. Normann firs in a typical stand. 3.1 Design requirementsThe main requirements for the ACW were defined in the feasibility study (Have et al. 2002) and are shown in Table 3.1. In addition the ACW should handle the trees gently during the 3 weeks from mid May when the shoots are very sensitive to damage. Also it might be relevant to consider so-called negative obstacles (holes or tracks). 3.2 System conceptTo meet these requirements the recommendations made in the feasibility study was followed, i.e.:
Table 3.1 Christmas tree plantation parameters and requirements chosen for the ACW development.
3.3 Choice of vehicle conceptOn basis of the above system requirements a range of methods were considered and evaluated in terms of advantages and disadvantages. This led to the choice of a small vehicle that can move between the trees and cut the weeds close to tree trunks beneath the branches (Fig. 3.2). 3.4 Plantation mappingThe positions of individual trees were measured by means of an RTK GPS ranging pole equipped with a special shoe and antenna arm to ensure that it was placed precisely above the tree trunks (Fig. 3.3). The locations were stored in the hand held data logger and used afterwards to construct a tree map as shown in Fig. 3.4. 3.5 Route plan generationThe tree map was used to define a suitable vehicle route plan (fig. 3.5) in the form of waypoints (one for each tree) along the middle of the inter-row strip. Additional waypoints were defined at the headlands to connect to the next inter-row strip. Each waypoint was defined by its absolute geo-position (Northing and Easting in UTM), and had associated information for control of the rotor cutter (park, idle or active near trees). This information was stored as a text file and arranged sequentially in the route plan.
Fig. 3.2. Sketch of the chosen weeder concept. The vehicle should follow the predefined route plan between the rows, while positioning the rotor cutter to cut the weeds around the trees in the intra-row area. This concept would make it possible to leave the weeds between the rows uncut for improvement of the biodiversity. A future commercial vehicle could be designed with a cutter on both sides to increase capacity.
Fig. 3.3. Schematic diagram of the rig used for measurement of the tree positions. A program called XMAS, was written in C, to import data from the Trimble Geomatics Office (raw GPS data) or corrected data from Excel and help to generate the route plan. The vehicle and plantation parameters were configured in a C-file. With regular fields this system could generate a route plan almost automatically. This method was used both for the plantation model at the Taastrup campus and for the Christmas tree plantations. Another route planning tool used was AgroNav Plan from GEOTEC, which was primarily used as an aid for controlling autonomous tractors (Blackmore and Griepentrog et al. 2004). It is a graphical tool that allows the user to construct a route plan interactively. It uses Autodesk Map 5 (www.autodesk.com) as the “graphical engine”. An inconvenience is however that UTM-coordinates are used on the ACW, which makes it necessary to convert UTM to WGS84 in AgroNavPlan and then after definition back to UTM. This was done by the program KMSTrans available from “Kort og Matrikelstyrelsen” (www.kms.dk, version November 2, 2002). When this method was used for generation of route plans for the ACW the “Power Take Off” code was used for the cutter clutch while the “Hitch Point Lift” code was used for cutter arm positioning.
Fig. 3.4. Sketch of a plantation map showing the borders, numbered tree positions, route plan and docking station, i.e. the place from where the ACW operation is started and stopped after completion.
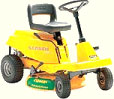
Fig. 3.5. Typical route plan applied during the experiments. The ACW had to travel back and forth along each row as this model was designed to cut weeds only to one side at a time. The turning circles were offset laterally in order to have a smooth approach to the next inter-row strip. The thin lines, originating from the vehicle track, symbolize the cutter arm, when the cutter is activated. The route plan was made up of waypoints, typically 1.2 to 3 m apart, thus the trace shown is not the connecting lines of these points, but the expected path of the ACW (mainly determined by turn radius) given the switch distances (tolerances) specified for each waypoint. 3.6 Control system developmentThe development of the ACW control system was done in the programming and simulation tool: Simulink from MathWorks (http://www.mathworks.com) as described in (Bak et al., 2004). The application of this software was chosen because it allows modelling, simulation, and analysis with focus on functionality and interfaces in an abstract form that represents the actual programming tasks. Simulink also provides executable graphical models for specifying and implementing embedded software, and it supports automated embedded code creation. This allows programs to be generated automatically and subsequently executed in real-time on the platform computer. In the present project the Simulink software was used to build a model of the vehicle and the control system. This model was then used to simulate the functionality of the different elements and the whole system until it was found to work satisfactorily. Finally the vehicle model was replaced by the real vehicle and tested physically. As part of the model a system for storage of parameter values during the tests was developed. This proved to be very useful for error detection and correction. 4 Weeder platform developmentTo minimise trivial and time demanding work on developing a new weeding platform, it was decided to adapt an existing lawn mower with the necessary characteristics to work in a Christmas tree plantation. 4.1 Platform selection and modificationOn the basis of the concepts described in section 3 the following requirements were specified: A 4-wheel platform (2-wheel drive, 2-wheel steered, and a wheel diameter of min. 25 cm), a speed range of 0.4 –2.0 m/s, a turning radius less than 1.5 m, a ground clearance greater than 200 mm, a width of less than 750 mm and a length of less than 1500 mm, and equipped with an electrical system comprising alternator, battery and starter. The market for lawn mowers of this type was investigated and the vehicle chosen was a Stiga Garden Combi (Fig. 4.1), which fulfilled all the requirements. This platform has a width of 700 mm, a length of 1400 mm and is powered by a 9 kW petrol engine through a V-belt drive and a 5-speed gearbox. At 1800 RPM (the chosen engine speed) the vehicle would travel with a forward speed of 0.30, 0.58, 0.84, 1.08, and 1.42 m/s. and a rearwards speed of 0.49 m/s. The vehicle has front wheel steering, an axle distance of 950 mm and a minimum turning radius of about 1050 mm measured at the rear axle centre. This platform also has alternator, battery, and electric starter.
Fig. 4.1. The Stiga Garden Combi lawn mower used as platform for the experimental ACW. The driver's seat and the steering wheel console were removed to give space for the control components and GPS-antenna (Fig. 4.2, left). Also the 700 mm diameter standard rotor cutter unit was replaced by a new cutter mechanism consisting of a 320 mm diameter rotor cutter unit (Stihl), which was mounted on an arm that could be moved between the trees. This new cutter rotor was powered through a twisted V-belt drive and a flexible driveshaft from a hand held rotor cutter (Stihl). 4.1.1 Vehicle cover and protection skirtsTo protect the Christmas trees from damage during operation the ACW was shielded on the sides by removable aluminium screens as shown in Fig. 4.2, right, and Fig. 6.6. 4.1.2 Vehicle control actuatorsThe control of the vehicle was facilitated through 6 linear 12 V electric actuators (Fig. 4.3 and 4.4) that were mounted between a frame fixed on the top of the vehicle chassis and the engine throttle wire, steering rod, gearshift lever, clutch/brake lever, rotor cutter arm and rotor cutter clutch (V-belt) respectively. The actuators differed in terms of length, operation speed and force in order to match with the requirements. All of them had built in potentiometers that delivered a feed back voltage proportional with their extents to the control system.
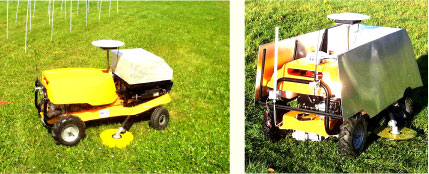
Fig. 4.2. The experimental, autonomous Christmas tree weeder configured with the power unit at the rear end, the control system at the front, the GPS antenna in the middle and the rotary cutter unit between the axles below the chassis. On the picture to the left the vehicle is shown next to the model plantation at campus where the Christmas tree positions were indicated by ground fixed, white plastic tubes. For weeding in the real Christmas tree test plantation the vehicle was shielded with side screens in order to minimise tree damage (right).
Fig. 4.3. The Linak actuator LA 12, which was powered by a 12 V DC motor through a worm gear.
Fig. 4.4. Arrangement of the four Linak actuators for control of the vehicle operation. 4.2 Weed cutter selection and developmentAs defined in the previous feasibility study (Have et al. 2002) the weed cutter unit should be able to:
In order to accomplish this, the design shown in Fig. 4.5 and 4.6 was developed. The cutter rotor could be engaged by use of a V-belt clutch, which was activated by a LINAK actuator. During operation the cutter unit was operated at a speed of about 3800 RPM, which corresponded to a peripheral speed of about 54 m/s.
Fig. 4.5. Cutter arm suspension (Top view). The cutter arm is connected to the chassis in the shown pivot point and pulled out into its outermost position by the spring. If the cutter hits a solid object, e.g. a tree trunk, it will be pushed back against the spring force. The outermost position of the arm can be set by the LINAK actuator to have a proper overlap to the strip cut from the other side of the row. The same actuator was used to position the cutter relative to the trees when operated in the active mode. Also it was used to park the cutter arm below the chassis for transport.
Fig. 4.6. Cutter arm suspension (side view). The arm is fixed onto a height adjustable pivot axel and can deflect upwards in case it hits an obstacle (i.e. in case of uneven ground the drag shoe formed by the bump below the rotor causes the cutter arm to deflect upwards). 5 Control system development
As already described in chapter 3 the basis for control of the ACW was a route plan and a tree location map, including positions of the field borders and a docking station. 5.1 RequirementsThe requirements to the control system were that the machine should:
5.1.1 Procedure of weeder operationAssuming that an ACW would have to weed several plantations a normal weeding operation would consist of tree steps:
When placed at the docking station and started up in autonomous mode it should first initialise, i.e. check if its location corresponds to the location of the plantation map allocated, or, alternatively, choose the plantation map and route plan appropriate for its present location. It should also check and initialise its own settings before starting up on the planned route through the plantation. After completion of the weeding it should return to the docking station and report back that the job has been done. It should also report back if any serious errors or faults have occurred during the operation. 5.1.2 Safety and reliabilityWhen operating commercially, the ACW should check for unexpected obstructions, major malfunctions, and classify its condition and reaction to one of the groups in table 5.1. If the coordinator wants to stop the ACW he should be able to do that just by activating an easily recognisable emergency button. 5.2 Control principlesAs already stated the ACW would need two main areas of control: The deterministic vehicle tracking control and the cutter positioning control. The route plan was used to control the movement of the vehicle, while the tree map was used to control the rotor cutter position relatively to the vehicle. Table 5.1. Safety modes, built in checks and reactions selected for the ACW control system.
5.2.1 Vehicle tracking controlThe principle of vehicle route plan tracking is shown in Fig. 5.1. The vehicle is controlled to follow the straight line between two waypoints until it crosses a set switch distance line. Then it starts to track the next line segment from P2 to P3, and so on, until the switch line of the last waypoint when it should stop.
Fig. 5.1. Line tracking principle. The vehicle tracks the line between two waypoints until the switch line. Then it tracks the next line. Another word for “switch distance” is “tolerance”. When the reference is updated (waypoints shifted) it will appear to the controller as a step function. The controller will do a “best effort” to track the reference. In case of a 90 degrees turn some deviation will occur due to the limits of the vehicle turning radius. The shape of the path can be adjusted by changing the “switch distance” or tolerance. The controller has a quite good smooth transfer between modes but there are limits. In other words, a 90 degrees turn with switch distance 0 when starting treatment in the middle of a row, should be avoided (since the path deviations will most likely cause the vehicle to drive into the trees). This is mainly done by starting the “inter-row strip center-line” tracking prior to the beginning of the row, or, in case treatment has to be started in the middle of the row, with a smooth approach (small change of vehicle heading). 5.2.2 Cutter positioning systemThe cutter mechanism (Fig. 4.5 and 4.6) could be controlled either passively or actively. In the passive mode (Fig. 5.2) it would be pulled out in its outer position by the spring. If the cutter in this position hits an obstruction, e.g. a tree trunk, it would be pressed back against the spring force and slide around the obstruction. In the active mode (Fig. 5.3) the control system would pull the cutter back when passing a tree, thus avoiding contact. 5.2.2.1 Passive cutter positioning If the vehicle always moves forward this approach could be used without an actuator for cutter arm positioning. All that is needed would be a route plan, which will take the ACW along the tree row at the proper distance with the cutter working in the intra row area sliding around the tree trunks. However, this system might cause problems of damage to newly planted trees which are less resistant to impact and wear. However, in older stands this might be an advantage because it might help to reduce the growth of the top shoot. The impact force exerted on the trees by the cutter would be proportional to the acceleration of the cutter, which would be proportional to the square of the forward speed. Therefore, speed is an important factor in the design of passive control.
Fig. 5.2 Time series showing cutter with passive control 5.2.2.2 Active cutter control In order to have contact free positioning of the cutter the actuator should pull it back from the intra-row area at the appropriate time when a tree is approaching, and restore its position relative to the row when the tree has been passed (Fig. 5.3).
Fig. 5.3. Time series showing cutter with active control 5.3 System architectureTo meet the above requirements to control the system the architecture shown in Fig. 5.4 and 5.5 was developed. It contains the three main functions:
The purpose of the VTC (Fig. 5.4) was to get the ACW to track the route plan so precisely that it would be possible to control the cutter sufficiently well. This was achieved on basis of a mathematical model of the vehicle dynamics, sensor inputs and optimization of the simulated response according to the principles described by (Omae, 1999). The simulated error was continuously minimized about 1 s ahead. This error was a function of the position, orientation, steering angle (all relative to the current reference line) and to the speed of the vehicle. In the current version the vehicle speed (throttle setting) is controlled by just two commands, i.e. a setting for start of the engine and a setting for working speed. When the throttle was set at working speed the engine speed was held fairly constant by a speed regulator. Thus the vehicle forward speed and the cutter speed were fairly constant. The VTC is further described in appendix A.
Fig. 5.4. Main elements and information flow of the vehicle tracking control (VTC), (top half) and weed cutter arm positioning control (WCP), (lower half) of the ACW system architecture. The objective of the WCP was to get the cutter to follow the desired route as shown in Fig. 5.3, i.e. it should be kept out in the proper position and not hit the trees when passing. The controller used was a simple quasi-static controller, i.e. when the calculated distance to a tree goes below a certain threshold the arm is pulled back from the row and vice versa. If the system for some reason fails to pull the cutter in, at the right time, the cutter will hit the tree trunk, and the passive cutter arm control will come into action. The objective of the VFR (Fig. 5.5) was to check for a number of faults and to generate an appropriate behavior as stated in Table 5.1. So far the system checks whether:
If any of these are false the control system would stop the engine. This function is facilitated by a closed-loop system that updates values at a frequency of 1 Hz for the navigation and 40 Hz for the cutter positioning. The controllers shown in Fig. 5.5 are only able to issue commands to the actuators when they are enabled. Thus the VFR will watch for error conditions and, in case of an error, disable the controllers and take over actuator commanding from the task specific controllers.
Fig. 5.5. Main elements and information flow of the vehicle fault and obstruction reaction system (VFR) in the ACW system architecture. 5.4 System hardware and information flowsAn overview of the system hardware is presented in Fig. 5.6. The control system was built around a 400 MHz embedded PC, which controls the actuators on basis of data from the sensors. Six actuators (LINAK) are operating the steering system, throttle, brake/clutch, gear, cutter arm position and cutter clutch. During operation the main parameter values were transferred through the WLAN-connection to a laptop computer using the “screen shot” function for the xPC Target. Also, the large number of parameter values sampled each cycle, were stored in a log for possible later uploading. These parameters could also be transferred in UDP (Ethernet) packets to any computer on the network for real-time access to the ACW status information. At this stage only Run/Stop command are used (from the laptop to the xPC Target).
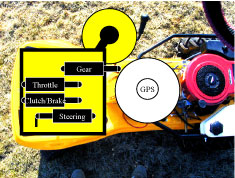
Fig. 5.6. ACW hardware components and information flows. 5.4.1 Control panelA control panel was used for operation in joystick mode and sequencing prior to switching to Navigation mode. It consists of 3 buttons and 3 LED's as shown in Fig. 5.7.
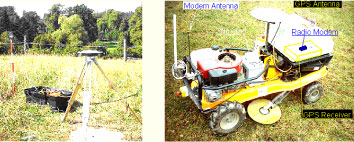
Fig. 5.7. Sketch of the ACW control panel. 5.4.2 Sensor systemsThe sensor systems used so far were a RTK GPS receiver, which was used to measure the absolute position, and a tilt-meter to measure vehicle tilt for corrections of vehicle position relative to the antenna position. The GPS antenna height was approx. 95 cm above the ground. Investigations on inclusion of more sensors, e.g. a laser range scanner for detection of tree rows and obstructions were also undertaken, but these sensors were not integrated with the ACW control system within this project. 5.4.2.1 Positioning The GPS used was a Trimble model MS750 (or rover for the ACW) and a MS7400 (for the base station). The rover was operated at 10 measurements per second in RTK-FIX-mode, i.e. the measured positions were corrected on basis of signals from the base station. The correction signals were transferred via radio modem (Satel model SATELLINE 3ASd, operating in the 380 to 470 MHz range). Fig. 5.8 shows how the components of the system were placed in the field and on the vehicle.
Fig. 5.8. Arrangement of reference station (left) and components on the ACW platform (right). 5.4.2.2 Laser range scanner Laser range scanners are able to measure distance and direction to objects. They can therefore be used to detect (and map) locations of objects in the surroundings (e.g. Guivant et al. 2000, Folkesson and Christensen, 2004). Holmgren (2003) applied a laser range scanner together with a simple GPS and an inertial navigation system to estimate forest variables. The system, which was carried by an aircraft, provided absolute positions of laser beam hits on trees and ground and a following sequence of data processes yielded good estimates of positions of individual trees, position of ground level, tree species, tree canopy volumes, tree height, stem position and thickness. In the present project an existing 2D laser range scanner (SICK LMS 200) was tested briefly to find out whether it would be suitable for detections of Christmas trees and obstructions. The purpose was to see if this scanner could be used to improve vehicle navigation and safety. 5.4.2.3 Tilt-meter The tilt-meter used (Applied Geomechanics, model MD900-TS) was mounted parallel to the ACW chassis (Fig. 5.8, right). The purpose of this sensor was to measure the vehicle pitch and roll, in order to calculate a correction to the vehicle position. 5.4.2.4 Position sensors in linear actuators All the actuators had built in potentiometers that sensed their length and thus via calibration functions could feed back information about the actual steering angle, gear ratio, clutch/brake position, engine speed (throttle setting), position of cutter and the state of the cutter clutch. A special supplementary electronic circuit was built to adapt these sensors to the control system requirements. The change in position when the actuator was energized was also used to determine whether the actuator had stalled. 5.4.2.5 Engine ignition sensor system The engine revolution was counted by a special circuit attached to the primary side of the ignition coil, and used by the control system to check the engine operation status. 5.4.3 Digital I/O adaptor and power circuitsThe embedded computer of the control system was connected to the sensors and actuators through a number of digital I/O adaptors comprising level conversion and frequency division. The ports on the I/O board (Diamond MM-32) were configured as 8 digital inputs (Fig. 5.9) and 16 digital output connections. The outputs were used for controlling the LINAKs (12), LED's (3) and a switch in the Safety Circuit chain (1).
Fig. 5.9. Digital inputs. 5.4.4 Power supply systemsAs the original electrical power system of the vehicle (17 Ah) was considered too noisy for the control system an additional 12 V battery (40 Ah) was mounted on the vehicle. This battery supplied power for the embedded computer and all the sensors, while the original battery supplied power for the actuators and basic vehicle functions. An overview of the power systems is shown in Fig. 5.10.
Fig. 5.10. ACW power circuits for engine ignition (bottom), actuators (middle) and high level electronics (top). 5.5 System softwareThis section presents the control software, including the principle of vehicle and tool control used, the vehicle fault and obstruction reaction system (VFR), the processing of sensor inputs, the tracking control, and the cutter positioning control. An overview of the information flows is shown in Fig. 5.4 and 5.5. 5.5.1 Processing of sensor dataThe GPS receiver and inclinometer outputs NMEA (National Marine Electronics Association) ASCII strings via an RS232 port. These strings are checked for errors and then, parsed by a specific C-function before being made available for the system. 5.5.1.1 GPS The Trimble GPS receiver outputs a string comprising time, date, northing, easting, GPS-quality, number of satellites, DOP (Dilution Of Precision), height and checksum on the serial port 10 times per second. If no errors were detected (Fig. 5.11) all messages were considered valid and passed on to the Simulink environment. In Simulink the GPS-quality value was evaluated. A value of 3 corresponds to RTKFIX-mode, the most precise mode and the only usable for centimetre level positioning. When the RTK-GPS is the only sensor for positioning, the vehicle should stop if the value differs from 3. This verification of the mode is done in a Stateflow chart, which makes it easy to shift to another GPS mode at a later stage. Also, a dynamic check was made of the measured positions to detect and remove outliers. This was done by applying a rule saying that the latest measured position had to be in close proximity to at least one of the previous two measurements to be accepted. The limit is configurable through a parameter in the specific block mask – and was set according to the vehicle maximum speed, maximum tilt rate and GPS antenna height. (If the tiltmeter were enabled, the filtered correction vectors were applied to the position, before it was distributed to the rest of the system). Apart from estimating the delays (when configuring the controller) and doing time-tag based filtering of the incoming instrument data, nothing was done with respect to synchronization of inputs. 5.5.1.2 Tilt-meter The inclinometer outputs a text string approx. 8 times per second. This string is converted and the values are range checked, written again and compared. The checksum is calculated and compared to the transmitted value. It appeared that heavy filtering of the tilt-meter output was needed to reduce the noise to an acceptable level. Thus the asynchronous arrival of tilt-meter messages (compared to GPS messages) was not a problem, as much as the delays in the noise filter. 5.5.1.3 Actuator position potentiometers The actuator potentiometers returned a voltage proportional to the length of the actuators. This voltage was transformed to the actual physical parameters like steering angle, gear number etc. by use of appropriate calibration constants. 5.5.2 Vehicle tracking controlThe principles of the vehicle tracking control are described in section 5.2.1. The details of this were that the tracking controller compared the current position (GPS-antenna) and heading of the ACW with the line between to waypoints (i.e. it calculates the cross track error and the heading relative to the line). The position of the vehicle was calculated on basis of the current position and recent history of positions, while the vehicle orientation was calculated and extrapolated also from recent history using dead reckoning based on speed and steering angle to compensate for the delay in the filter. Once an estimate for the current position and heading was obtained, the response (i.e. future position and heading) to a number of control pulses applied to the steering system were simulated, and the one expected to result in the least error was chosen. The pulses simulated were of different duration (i.e. time before the output returns to: (0) No change) and polarity: (1) Turn left, (-1) Turn right. All actuator settings were done by maximum speed of the actuator motor. Wheel slip was not considered. The Simulink block for all these processes is shown in Appendix A. 5.5.3 Cutter positioning controlTo get sufficiently accurate position estimates for the cutter position it is important to have an accurate estimate of the vehicle position, as well as a frequent update of the conditions, i.e. 40 Hz instead of the slower GPS update of 10 Hz. Also it would be important to have a minimum computer process time delay. The set up of this control is described further in Appendix B. 5.5.4 Safety systemThe purpose of the supervisory logics, which is described in Appendix C, is to have safe operation, i.e. make sure that the ACW will work only when conditions are safe and within normal ranges (table 5.1). For instance it should only be able to operate when in the right plantation, when it has a proper route plan, when the sensor inputs are received and they are of appropriate quality etc. 5.5.4.1 Geo Fence One of the safety blocks is "ValidField", which prevent the vehicle from driving if it is outside the field or plantation borders defined. The input to this block is the latest GPS position received. The output is a flag (boolean), stating whether the GPS position is within the field boundary or not. To ensure that this system works properly the route plan should always be defined within the limits of the geo fence. 5.5.4.2 Condition check block The "NavigationSuitable" block collects the relevant inputs and evaluates whether they would preclude Navigation mode (or Implement Task mode). The output is an error mask (Navigation Error Mask). If this mask is zero then everything is normal and Navigation mode is allowed. Otherwise a “bit” is set in the mask to signal, which condition failed. 5.5.4.3 Mode Sequencer The "ModeSequencer" block controls which of the low level controllers are enabled and what their objectives are (Table 5.2). Table 5.2. Overview of the actuator modes used
5.5.4.4 Actuator protection The actuators are only capable of intermittent use. If an actuator is blocked for some reason the current will increase and quickly cause overheating. To avoid this the actuators were protected by a two-level safety system: 1) A software controlled on/off switch (controlled on basis of detection of “actuator blocked” and a rough estimate of the motor temperature from “on-time”) that allowed continuous operation and avoided replacement of fuses, and 2) An ordinary thermal fuse in case the first level of protection should fail. 5.6 Simulink representationsThe Simulink diagram (Fig. 5.12) shows the top-level control loops in the ACW. Each of the boxes contains subsystems in several layers down to the hardware drivers. 5.7 Simulations and tests of the control systemDuring development, the function of the different elements and the whole control system were concurrently simulated in Simulink until they appeared to work properly. Then the vehicle part of the model was replaced by the real vehicle including the proper electronic connections, and tested physically. This was first done in a model of a Christmas tree plantation at the University Campus (Fig. 4.2, left) and then in a Christmas tree plantation with different sizes and types of trees. The model plantation at the campus was used for the initial trial and measurements of the spatial precision of the vehicles operation, while the real plantation was used for test of the practical performance of the weeder. The campus plantation model comprised 27 white plastic pipes placed in iron pipes that were fixed in the ground in the usual pattern for Christmas trees , i.e. 1.2 m between the rows and 1.2 m between the trees. Also 5 markers specifying the position of the docking station and the field boundary were set up according to the general definition (Fig. 3.4). 6 Results
This chapter describes the results of adaptation of sensors, simulation of control components, accuracy of vehicle operation in relation to route plans and operation in the plantation model and a Christmas tree plantation. 6.1 Sensor capabilities and reliabilitiesThis section describes the results obtained during the work on integrating the RTK GPS, the tilt-meter and the laser range scanner. 6.1.1 RTK GPSStatic tests of the RTK GPS at an open location showed high reliability and high accuracy (±1-2 cm in the horizontal plane). However, when attached to the ACW during different operations conditions, the quality of the signal dropped if the number of satellite contacts became too small (less than 5). This happened mostly when the vehicle was close to larger trees or other high structures. When happening it was recognised by the supervisory logic system and the engine was stopped automatically, just as it should (section 5.5.4). 6.1.2 Tilt meterAs the GPS-antenna was placed above the vehicle it translated laterally as the vehicle rolled over uneven ground. This led to errors in the measurements of the vehicle position, which of course had a disturbing effect on the tracking control. To correct for this a tilt-meter was integrated as described in section 5.4. However, this instrument was found to be of little use, as it was very sensitive to the vibration characteristics of the ACW. This problem needs to be solved, but was not prioritized in the project because of lack of time. 6.1.3 Laser scannerThe preliminary trial of the laser range scanner in the laboratory showed (Fig. 6.1.) that this instrument is able to detect distances to Christmas trees, and therefore should be suitable for measurement of tree row location and orientation. This may help to make the vehicle navigation between rows much more robust. The laser scanner also appears suitable for detection of larger obstructions between the rows, at least in stands of young trees. The challenge is to develop a distance profile analysis model that can extract the needed information. 6.2 Computer simulations of vehicle behavioursDuring the computer simulations the control system sent control pulses to the simulated vehicle, and received corresponding feedback signals. Thus a simulated operation along a virtual row of trees could be performed. In this way the influence of noise on the GPS positions and delays in availability of the GPS measurements were evaluated. Also different steering models were assessed by this method to find the most appropriate solution.
Fig. 6.1. Example of a laser range scan of two Christmas trees and four persons as indicated. The graph shows that both trees and people can be detected, and that discrimination may be possible on basis of the different variation in distances measured to these objects. 6.2.1 Route trackingAn example of the results obtained from simulations of the vehicle route tracking system is presented in Fig. 6.2. This route is placed symmetrically on either side of a row as it should be when the machine as in this case only has one rotor cutter. 6.2.2 Cutter positioning systemThe computer simulation of the control system for cutter positioning around the trees (section 5.5.3) showed ratter inaccurate results (Fig. 6.3). Also the distance from the tree to the cutter is rather large. 6.3 Tests in plantation modelThe physical tests of the ACW comprised its ability to track the defined route plan, which was done in the plantation model at KVL, and its ability to do the weeding task it was designed for, which was done in the test plantation. 6.3.1 Route trackingTable 6.1 shows the route tracking performance of the vehicle together with the originally defined requirements. The route travelled by the ACW varied very little on even ground, where the GPS antenna rod was nearly vertical all the time. It followed the route plan in a consistent manner over many repetitions, which showed that the controller was stable under these conditions. This route tracking performance was found to be accurate enough to position the cutter unit accurately enough in the intra row area, when in the passive mode.
Fig. 6.2. Example of a simulated ACW route (as represented by the GPS antenna route) during a run along the route plan for a row of the Christmas tree test plantation.
Fig. 6.3. Example of simulated cutter head trace around a tree centre. Table 6.1. Results of route tracking performance compared to the requirements in different conditions and without tilt-meter corrections.
*) Under the assumption that GPS-readings had low noise and that the base station was close by. In the Christmas tree plantation where the ground roughness was ± 2-4 cm the route tracking was less accurate and sometimes not good enough as it resulted in considerable cross route fluctuations, which in the worst cases lead to clashes with trees (Fig 6.4). The response of the system to uneven ground was investigated in the model plantation by placing some 5 cm thick pieces of wood in the track of the left wheels. After the ACW had passed this obstacle it wobbled for a short distance, which also was observed in the plantation with similar uneven ground. Thus it was clear that the influence of the varying vehicle tilt on the performance of the route tracking system would have to be decreased. 6.3.2 Precision of weed cutter positioning near treesThe cutter position relative to trees was measured physically at the even ground in the model plantation, and just observed in the plantation tests. In both cases it was found that the passive control worked very satisfactorily in terms of weeding close to the trees, while the precision of the active positioning was insufficient. 6.3.2.1 Passive positioning The highest accuracy of cutter positioning was achieved by the passive control where the rotor was positioned within the intra row area as shown in Fig. 5.2. During operation it remained in this position until it came in contact with a tree trunk; then it flexed back while sliding around the trunk out in the set position again. With this passive control practically all weeds around the tree trunks were cut. 6.3.2.2 Active positioning In the model plantation where the ground was even and the vehicle tilt therefore nearly constant and small, the traces shown in Fig. 6.5 were logged. Although the machine moved the cutter nearly at the right time the precision relative to the trees was poor. Therefore, improvements are needed.
Figure 6.4. Example of cross track error (without tilt-meter corrections) logged in the Christmas tree plantation in Tappernøje. Input to the tracking controller shown. The mean error is -8.5 cm and the standard deviation is 2.6 cm.
Fig. 6.5. Example of two tracks of the cutter centre movements in an absolute reference system as logged during two operations with the quasi-static controller on the basis of absolute geo-positions measured by the vehicle GPS. The zig-zag shapes of the traces are due to the “stair-case” nature of the GPS signal used as input (GPS updated at 10 Hz, other sensors at 40 Hz). The tree is the same as used in the simulation plot. 6.3.3 Fault and obstruction behavioursThe faults and reliability system (VFR) developed so far was described in section 5.5.4 worked as expected and generated the planned behavior. The vehicle would not operate when being positioned outside the appropriate plantation area. It also stopped if the GPS-signal was of insufficient quality. Also the safety circuit including the emergency stop button worked as expected. 6.4 Plantation testsThe practical tests of the ACW were limited, but the results were rather good and encouraging for further developments. The tests were carried out at the beginning of October and November 2004 in a Christmas tree plantation at Tappernøje in Southern Zealand. The trees in the 3 test plots selected consisted of 4-year-old Norway Spruce (Picea abies) and 5-year-old and 7-year-old Normann fir (Abies Nordmanniana) from planting. 6.4.1 Plot conditions and preparationsThe ground surface of the prepared plots can be characterised as even with little slope (<10%). Larger stones and some trees, which could interfere with the test-runs, including turns, were removed before the tests were started. Only stones with a diameter less than 10 cm were left on the test area. Before the tests the plots had been weeded mechanically in two extensive treatments in June and August, 2004 with a manually operated brush cutter mounted with a grass cutting unit. Before 2004 the area had been sprayed with a mixture of terbuthylazin and diuron. The weed pressure was therefore not very heavy apart from the tree rows along the tracks, where weed vegetation (primarily couch grass and meadow grass) was dominant. The plots had a weed cover of about 30-40%. It consisted primarily of grass (10-40 cm high), spread Canadian fleabane (50-100 cm high), field horsetail (15-20 cm high), willow herb (30-40 cm high) a few creeping thistles (50-60 cm high) and mugwort (60-80 cm high). In addition a few trees in all plots were totally covered with cleavers. The distance between the rows in the test plots was 115-120 cm and the plant distance varied from 100 to 120 cm in the rows. The average sizes of the trees in the 3 test plots are shown in Table 6.2: Table 6.2. Ages and sizes of the trees in the test plots
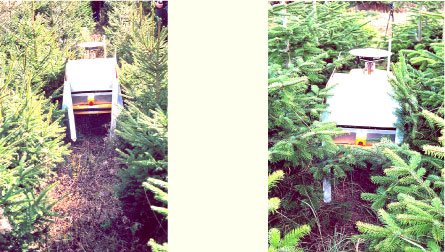
6.4.2 Quality of weedingFig. 6.6 shows the ACW at work in two different stands. As can be seen the space for the ACW in the row intervals is limited when the tree height exceeds 1.5 m. This is especially the case with the Normann fir, which due to a slow starting phase becomes very wide.
Fig. 6.6. The ACW at work in Norway Spruce (height 141 cm and width 92 cm), (left) and Normann fir (height 160 cm, width 142 cm), (right). All the plantation tests were done with the cutter positioning system in passive mode. The cutter followed the surface of the ground very neatly and the movements of the cutter around the trees created an approximately 35 cm band of cut weed plants on each side of the rows. Only in a very few cases the force of the spring was not sufficient to press the cutter below the lowest branches of the trees. In these cases the lowest branches were cut if not too thick – see fig. 6.7.
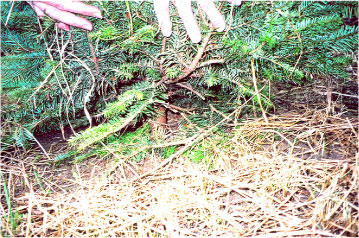
Fig. 6.7. Some low-sitting branches of a Normann fir has been cut off. In most Christmas tree plantations the pruning of the lower branches has been carried out already when the trees are about 1 meter high. The lower branches will therefore not cause any problems regarding this method of weeding. The weed plants were cut up to 1-2 cm from the stem of the trees, however as the weed standing close to the stem had grown up within the branches of the tree, it stuck to the tree even after the ACW had passed – see Fig. 6.8. This might have led to the impression of an unsuccessful weeding, however, when pulling these plants, it appeared that they actually had been cut, but still were stuck in the tree. – Within pruned trees and with regular mechanical weeding this phenomenon will not occur as the weeds never will reach such heights.
Fig. 6.8. Long weed plants that had grown up through the trees were held back by the branches although they were cut near the ground. This problem would not occur if weeding was done regularly. It was expected that cutting of heavy weeds like the mugwort with a stem thickness of 1.5 cm would be difficult with the knife used for the cutter. However, this turned out not to be the case. But the knives, which were made from polypropylene, did not last long, especially because of contact with stones. It was therefore necessary to replace them a couple of times during the test. This problem is however easily solved with use of knives made from a stronger material. The weeding performed with the passive cutter in the test plots was thus satisfactory, but in connection with mechanical weeding in new-planted and 1- 2-years-old trees it will be necessary to use the active cutter control unit (fig. 5.3). 6.4.3 Damages to treesNo considerable tree damage was observed, neither at the trunks or the branches where the machine had touched. However, with 4-5 weeding operations per season, wounding of the stems by the passive cutter cover may occur. Faint wounding of the bark at the base of the stem is, however, not very harmful and can even sometimes have a positive growth inhibiting effect on the leader shoot, when the tree is more than 1 meter high. Should such a wounding appear to be a problem it is possible to equip the cutter with a soft protection shield, which can rotate when it comes into contact with the trunk. The ACW was shielded by aluminium screens, partly to protect the machine and partly to avoid damage to the trees. It worked well during the test period, but should preferably be made more robust with a surface of synthetic material to reduce friction during work in the plantation. 7 Economic feasibilityThis content of the previous chapters indicates that it is realistic to apply an autonomous weeder to Christmas trees from a technical point of view. However, it should also be economically feasible. In order to provide an idea about this the following brief cost calculation was made on estimates for two scenarios: 1) current prices and performances, and 2) prices and performances in 5 years. 7.1 Calculation methodThe calculation was performed in two steps. First the machine area capacity was estimated by: Ah = k v b e and As = Ah t n where: Ah = area capacity (ha/h) The annual costs of ownership and use of a machine was calculated by: C = P cf + t n N (m + f + L) in which: P = vehicle total purchase price, (DKK) 7.2 Chosen parameter valuesThe most important factors in the calculation are the initial purchase price and the performance of a future commercial autonomous weeder. The usual picture for this kind of technology is that a new product is introduced at a relatively high price to get the development costs covered as soon as possible. However, after some time, when competitors emerge it is often seen that prices drops, while the technical performances are improved. To reflect this picture two scenarios were chosen. One is set up with approximate present price and performance levels, while the other is set up with assumed prices and performances 5 years ahead. 7.2.1 Purchase priceThe purchase price (Table 7.1) was estimated on the basis of current prices of the major components and software used for the developed experimental vehicle. No costs was included to cover development and assembling of the machine. On the other hand the sensors may be bought at much lower prices than estimated when they are to be used in considerable numbers for commercial vehicles rather than for research. Table 7.1. Estimated investments needed (2005 and 2010 price-levels in DKK)
7.2.2 Weeder performances parametersThe performance parameter values of the 2005 set-up (Table 7.2) are estimated on basis on experience with the ACW assuming that it will be possible to achieve a high operational availability. The values used in the 2010-scenarie are just rough estimates. Table 7.2. Estimates of parameter values for capacity and cost calculations
1) Operation assumed possible in all weather conditions. 7.3 ResultsThe results (table 7.3) shows that an ACW built in 2005 would be competitive with the present manual mechanical weeding equipment (current cost price: 3000 DKK/ha), while the anticipated changes in parameter values during the next five years will appear to bring the costs down to the level of spraying (about 1500 DKK/ha). Table 7.3. Results of costs calculation
7.4 Sensitivity analysisAs the selected parameter values only are estimates a sensitivity analysis was made of the following 3 groups of parameter values:
Table 7.4. Cost sensitivity analysis (2005 scenario)
Table 7.5. Cost sensitivity analysis (2010 scenario)
The tables 7.4 and 7.5 show that an increase of the capacity will result in a nearly as large reduction of the costs, while the capacity costs, running cost rates, the number of weedings per year and the number of daily working hours are less important. It also appear that this picture only is changed moderately with the more favourable parameter values used in the year 2010 scenario. 8 Discussion
The development work reported above has shown good and encouraging results but has also clearly indicated that more work is needed before the concept is reliable and safe enough for commercialisation. In the present chapter these issues are discussed in relation to the different elements of the vehicle. 8.1 The ACW platformThe platform selected for the ACW was found to be well suited for the purpose. The width fits well in between rows placed at the normal distance of 1.2 m, and the chassis ground clearance was found sufficient for operation in the test plantation, which was established on even farmland. However, it would have been an advantage to have a smaller turning radius to ease turnings. Also it would have been an advantage to have slightly larger wheels. 8.2 The weed mechanical cutter conceptThe applied cutter concept (fig. 4.5 and 4.6) worked satisfactory in the rather limited tests performed so far. The only improvement that appears to be needed is the durability of the cutter knives. The knives used were made from a kind of hard plastic material but not strong enough to resist contact with stones. No tests were performed in areas with harvest residues from a previous tree crop, but it is unlikely that it would be able to handle it. If this is required a special designed and stronger cutter head would be needed. Alternatively, the residue could be removed or chopped before planting of new trees. 8.3 Control systemThe tests have shown that improvements are needed both in the vehicle path tracking control and the cutter arm positioning control in order to have reliable operation. 8.3.1 Vehicle tracking controlAs the vehicle control is important both for proper operation and for precise positioning of the cutter head it should be reliable under all reasonable conditions. Our attempt to apply the existing tilt-meter was not successful because of its unsuitable dynamic characteristics. This problem has to be solved as one of the first things. The other problem that the GPS-signal occasionally is of insufficient quality can be solved by addition of a supplementary sensor and fusion of the signals in a Kalman filter (see below). The simplest supplementary sensor would be wheel encoders, but these are only useful over short distances because of error accumulation. 8.3.1.1 Laser range scanner as row detector Another possibility would be a laser range scanner as already mentioned in section 6.1.3. This sensor appear to be suitable for measurement of the distances to trees in the rows ahead, which can be transferred into vehicle orientation relative to the rows. 8.3.1.2 Kalman filter To have optimum utilisation of sensor information and compensation for sensor faults and drop outs it is necessary to apply a Kalman filter, which on a statistical basis can merge the information from several sensors and get the best possible values for the control system (Welch and Bishop, 2003). Initial work has already been done on this in a student project, but further work is needed to adapt and integrate it into the ACW control system. 8.3.2 Weed cutter arm controlAlso the cutter arm control should be more accurate. The current controller is of the “quasi-static” type, i.e. the mode is changed when the perceived distance to the nearest tree is below or above some threshold. A considerable improvement may be achieved on basis of previous simulations of the movements in response to certain actuator impulses before selecting the most appropriate impulse and time combinations for precise positioning. 8.3.3 Vehicle fault and obstruction detection and system reactionIn table 5.1, a list of vehicle fault and corresponding response was defined for the ACW. So far the following fault detection functions were made:
The system reaction to all of these is just: Stop of the engine. An important future task would be to build in the relevant reactions (Table 5.1) as well as further detection and reaction abilities as described in the following. 8.3.3.1 Detection of large obstructions The ACW should be able to detect larger obstructions like people or animals in front of the machine. A possible candidate for this purpose would be the laser range scanner discussed above, which on basis of the initial investigations (fig. 6.1) appear to be suitable for detection of obstructions in the inter-row strip. It may also be suitable for detection of “negative obstructions”, i.e. deep tracks or water filled holes. Future investigations are needed to see if this is possible. 8.3.3.2 Detection of collisions Even when much effort is used to prevent contact with obstructions, collisions may still occur. Therefore, it is necessary to have a mechanical bumper with switches or gauges that can detect forces above a certain threshold. If such an activation is detected the vehicle should stop immediately. 8.3.3.3 Detection of engine overload The engine RPM sensor may be used for detection of vehicle overload. A sudden change of speed may indicate some sort of blockage, e.g. of the rotor cutter. 8.3.3.4 Detection of rotor cutter operation problems The rotor cutter rotational speed should be measured continuously to detect problems like power transmission failure (e.g. v-belt broken or slipping), or broken cutter knife. A sudden change of speed will indicate a sudden overload, which for instance could be caused by some sort of blockage. 8.4 Tree mapping and cutter head controlThe control of an ACW may be based on tree mapping at two different precision levels:
The first of these levels would allow active, touch free weed cutter head positioning close to each tree even if rows are curved or somewhat irregular. This mapping method would make it possible to do autonomous weeding during the complete growing period of trees. The second level would be sufficient to define a proper route plan for the simpler passive cutter head control, i.e. the cutter head would hit each tree and slide passively around it providing good weeding but also a risk of damage to young trees. This control method would therefore only be appropriate if the trees are sufficient resistant, which may be the case 2 years after planting. Before this time weeding may be done with a special spring tooth harrow, which already is used like that in practical conditions. Another alternative might be to control the ACW by means of a row detecting sensor, although this most likely only would be precise enough for passive cutter control. 8.4.1.1 Automatic mapping during planting As the detailed manual mapping of trees is rather costly an automatic method would be of interest. One such alternative method would be to map tree positions during planting by recording of the positions (RTK-GPS) where the trees are placed in the ground. A system like this has already been developed for mapping of the placements of sugar beet seeds (Griepentrog et al. 2003). 8.4.1.2 Mapping by use of laser scanner Another possibility would be automatic measurement of position of already planted trees using the ACW itself with a laser scanner and a mapping software system (Folkesson and Christensen, 2004). This would mean that the autonomous weeder (or another vehicle) would have to be operated manually through the plantation for mapping before the route planning and start of weeding can take place. 8.5 Economic feasibilityThe result of the feasibility study (chapter 7) is of course very dependent on whether the assumed parameter values can be achieved. One of the most uncertain figures are the machine capacity and the running cost. For instance if service personel is far away, and the frequency of faults is high the machine capacity would be low and the repair costs high. On the other hand if a few more man years are spent on improving the reliability and safety, the estimates may well be realistic. 9 ConclusionThe conducted work on development of an autonomous Christmas tree weeder consisting of a modified self-propelled lawn mower equipped with a special weed cutter devise and a suitable control system has shown that:
10 PerspectivesThe work reported has mainly dealt with development of the concept and the basic functions of the vehicle. Much more work is needed to develop sufficient reliability and safety for real autonomous operation. Still, the work has shown promising results and generated ideas for further work. 10.1 Scientific perspectivesTo work reliably and safe enough for practical use the ACW should be able to react sensibly to occurring faults and abnormal conditions inside the machine itself, in relation to the working tool, and in relation to the surroundings. To obtain these abilities it should be able to percept occurrences of such conditions and to behave in an appropriate way. Better perception reliability can be achieved through sensor redundancy, which means that a parameter or condition should be measured in more than one way. But this requirement does not necessarily mean that all sensors should be duplicated. Many of the measured parameters are mutual related. This means that a systematic comparison of already measured parameter may be sufficient to detect errors not measured directly. One example is that vehicle movement measured by the GPS is related to engine speed, gear ratio, and wheel slip. If for instance the engine is running, and the vehicle not moving something is wrong. A few other examples are discussed in section 8.3.3. An important future task would therefore be to make a systematic analysis of this type of sensor redundancy to obtain the required level of perception quality and certainty with a minimum number and costs of sensors. This would help vehicle operational reliability and safety. It would also reduce costs. 10.2 Practical perspectivesThe used method of individual tree mapping would allow implementation of several new tree specific management practices, e.g. tree growth regulation, tree shaping, monitoring of pests, deceases and nutrient deficiencies, applications of pesticides and fertilisers according to needs, and selective harvest. Also automatic monitoring of quality factors of trees may be used for marketing and sale purposes. Apart from Christmas trees the ACW could be applied in other cultures like fruit trees, berry bushes, wine and ornamental trees. Down scaled to smaller row distance and plants it may be applied in a range of row crops like vegetables, maize and sugar beets – perhaps with a different weed control tool. Also the developed autonomous vehicle would be suitable for simpler jobs like grass cutting, which would improve its utilisation and economy. All these potential market areas may contribute to commercial interest and cost reduction because of larger production numbers. 11 ReferencesBak, T. and Jakobsen, H. (2003) Agricultural Robotic Platform with Four Wheel Steering for Weed Detection. Biosystems Engineering 87:2125-136. Bak, T.; Nielsen, J.; Sørensen, C.G. and Have, H.(2004): A Software Framework for Agricultural Robotic Systems Development. -Proceedings of the 2004 CIGR International Conference Beijing, China. Christensen,B.K. (2003): Juletræets miljøprofil – fup eller fakta? – PS Nåledrys 43/03: 33-40. Blackmore, B. S., Fountas, S., Tang, L., and Have, H. (2004): Design specifications for a small autonomous tractor with behavioural control. The CIGR Journal of AE Scientific Research and
Development Blackmore, B. S., Griepentrog, H.W., Nielsen, H., Nørremark, M. and Resting-Jeppesen, J. (2004): Development of an deterministic autonomous tractor- -CIGR International conference, Beijing. Folkesson, J. and Christensen, H. (2004): Graphical SLAM - A self-Correcting Map. -Paper presented at the web site of the centre of Autonomous Systems, Royal Institute of technology, Stockholm, Sweden. Griepentrog, H.W.; Nørremark, M.; Nielsen, H. and Blackmore, B.S. (2005): Seed mapping of sugar beets. -Precision Agriculture 6, 157-165. Guivant, J. , Nebot, E. and Baiker, S. (2000): Autonomous navigation and map building using laser range sensors in outdoor applications. - Journal of Robotic Systems. Vol 17, No. 10, October 2000, pp 565-583. Have, H.; Blackmore, S.B.; Keller, B.; Fountas, S.; Nielsen, H.; Theilby, F. (2002): Development of an autonomous Christmas tree weeder – a feasibility study. - Pesticide Research No. 59. Danish Environmental Protection Agency, 88p. Hollingum, J. (1999): Robots in agriculture. Industrial Robot 26:6438-445. Holmgren, J. (2003): Estimation of forest variables using airborne laser scanning. -Ph.D.- dissertation, Acta Universitatis Agriculturae Sueciae, Silvestria 278, Swedish University of Agricultural Sciences. Jacobsen, L.W.; De Jonge, H.; Villeholth; Ullum & Møldrup (2000): Pesticider bundet til jordpartikler kan udvaskes. (Pesticides can leach attached to soil particles). -Naturens Verden, Særnummer Pesticider, Februar 2000. Keller, B. (1997): Mekanisk renholdelse af kulturer plantet på agerjord. (Mechanical weed control in cultures on farm land). -Miljørapport nr. 353, Miljøstyrelsen 1997. Kjærbølling, L. (1997): Jorddækning som alternativ til kemisk ukrudtskontrol. Pyntegrøntserien nr 6, Skov & Landskab, Hørsholm. 66 pp. Omae, M. and Fujioka, T. (1999): DGPS-based position measurement and steering control for automatic driving. Proceedings of the American Control Conference, San Diego, California. Pedersen, L.B.,Riis-Nielsen, T., Ravn,H.P., and Christensen,C.J. (2002): Traditionel ukrudtssprøjtning og alternative behandlingsstrategier -–effekt på vækst, kvalitet miljø og naturindhold i juletræskulturer på skovjord. Pyntegrøntserien nr 18, Skov & Landskab, Hørsholm. 66 pp. Pilarski, T., Happold, M., Pangels, H., Ollis, M., Fitzpatrick, K., and Stentz, A. (2002) The Demeter System for Automated Harvesting. Autonomous Robots 13:19-20. Theilby, T. (1997): Regulering af uønsket vegetation i pyntegrøntskulturer ved afgræsning med får. Miljøprojekt nr. 362, Miljøstyrelsen 1997. Welch, G. and Bishop, G. (2003): An introduction to the Kalman filter. - Paper No.TR 95-041, Department of Computer Sciences, University of North Carolina, 15 pp. Wilson, J. N. (2000): Guidance of agricultural vehicles -- a historical perspective. Computers and Electronics in Agriculture 25:1-23-9. Yavuz, H. and Bradshaw, A. (2002): A new conceptual approach to the design of hybrid control architecture for autonomous mobile robots. Journal of Intelligent and Robotic Systems 34:1-26. Appendix A : Tracking controlThe tracking controller controls the vehicle position and heading by applying pulses to the steering system as shown in table A1. A design constraint imposed on the controller was that it should not issue a pulse more than once every second to match with the implementation of the electromechanical relays of the steering hardware. It should be noted that the hardware does not provide “ramping” (or soft start) of the DC motor turning the spindle. It is just an on-off control. Table A1 Steering system pulses and effects
The steering controller can apply control pulses of length N sample periods and since the sampling time was 25 ms, the pulse length could be 0, 25 ms, 50 ms, etc. These steering pulses were based on:
1.1 Principle of simulation and error evaluationThe idea was (see Omae 1999) to look at the current vehicle state vector and simulate what the response would be to a given control input, to calculate the error J from the response, and then minimize J. In the ACW case the question is: What would happen if a control pulse of a given length and polarity was applied starting now. This is done for a large number of different control pulses and the controller selects the one promising the least error at a “look ahead”-time. Figure A1 shows the principle. From the current state (box shown at an angle) the simulated positions are computed for various control pulses, and these predicted states are then evaluated with respect to the “error” as described. This error function would take position, heading and steering angle (all relative to reference) into account.
Figure A1 Array of simulated positions as results of different changes of steering angle. The “error” of these positions relative to the reference path is then calculated and used to choose the best change in setting. 1.2 Control pulse length sweep in SimulinkFigure A2 shows how the sweep across different pulses is performed in Simulink, as well as how the error function is invoked. The input to the error function is the position relative to the reference line, the heading relative to the reference vector, the steering angle (relative to vehicle) and the vehicle speed. The speed is currently ignored. Note that the position exchanged is the antenna position and not the Origo (rear wheel center) (since heading is also provided the Origo can be calculated from the Antenna position and vice versa). Notes on computational complexity: the current approach has complexity O(N) where N is the number of possible control pulses to apply. Due to the short look-ahead time (compared to vehicle turn time) it is expected that there will only be one “local minimum” for the error function. Thus the search could be improved to O(log N) or even better. With the current combination of On-Board Computer and sample interval, the execution time is not a problem. In case anyone are wondering why the HoldMinimum block does not have a reset input, this is because the iterated subsystem shown is encapsulated in an Enabled subsystem which is configured to start “from scratch” whenever it is enabled. 1.3 The Error FunctionThe current error function (which is a rough first) defines optimum steering angle (relative to reference vector) and vehicle heading as a function of distance to reference line (and this function is configured with the vehicle turn radius). Figure A3 shows which steering angle (relative to reference) which is considered optimal. This is an arbitrary function. It does not take the turn speed (how fast the steering angle can be changed by the steering actuator) into account. Figure A4 shows what is considered an optimal vehicle heading (this is related to the minimum turning radius, although it does not follow a “maximum-turn-approach” (where the optimal heading would be arcos(1 – y/rmin)) – the gradient close to y=0 is less than it would have been if a “maximum turn” were used to model the optimum heading. Actually this makes the assumption of “instant change of steering angle” less critical). The function is identical to the steering angle function.
Figure A3 Steering angle considered optimal. Using the “bicycle” model for the vehicle, the optimal steering wheel angle can be derived from the steering wheel position. The figure shows steering wheels with “optimal” direction for various position errors.
Figure A4 Heading considered optimal (i.e. for the vehicles sketched: given a position deviation, the heading shown, for each vehicle, is the one considered “optimal”) The errors for steering angle and heading are then calculated as the deviation from these “optimal” values. When the vehicle heading is not way off, the total error is a weighted sum of the α, Ψ and y contributions. The y-contribution is calculated according to figure A5. The error contribution saturates, when position is more than minimum turn radius away from reference.
Figure A5 “Cross track error” cost contribution Note that the simulation takes the actuator response time into account (as well as GPS delay), so another way to take the delays into account in the controller would be to increase the look-ahead time beyond the controller sample time interval (1 s) plus the sum of delays. Thus the controller will perform a new simulation sufficiently early to set the steering angle to “anything” at the time the look-ahead time “position” is reached. (Increasing the look-ahead time corresponds (in some respect) to lowering the “gain”). 1.4 LineServerThe previous sections described how a line is tracked. This section describes how the LineServer block takes a line segment from the route plan (Table A.2)and presents it to the tracking controller. As seen in the screen dump (figure A6) the ImplementCode is taken from the P1 (the point travelled from) and the switch distance from P2 (the point travelled towards). i.e. when a point is reached, the ImplementCode from this point becomes the new reference ImplementCode (i.e. the command to the implement controller). The switch distance tells when the point travelled towards is “reached” (Fig. 5.1). When the point database is exhausted, the points are reused. The blocks P1_Server and P2_Server references the matrix 'routeplan' which should be set up by a “get_routeplan” script. Table A2 Example of route plan points (one waypoint per line)
The file is read using MATLABs DLMREAD function. The order of values is: Northing, Easting, ImplementCode and SwitchDistance. When the RelPos_x input is positive (corresponding to “vehicle” past endpoint) the index into the matrix is updated (i.e. the next line segment is chosen). The relative distance of the vehicle to “switch line” should be calculated (outside this block) and fed to the input port RelPos_x. Appendix B: Data processes for the cutter arm controlWhen active control of the cutter arm position is used (Figure 5.3), the controller needs to know where the trees (obstacles) are, or at least where the tree nearest to the cutter head is, in order to pull in the arm at the right time. Assuming a tree spacing of 1.2 m, and the dimensions and dynamics of the cutter arm and head, at most one tree will be “within scope” at any given time (i.e. the cutter arm controller will only have to consider one tree when positioning the arm – it is fast enough to reposition the arm when the next tree in the row becomes the nearest tree (and this is pretty much implicit by the nature of the desired “path” of the cutter head)). This appendix describes:
The prox_tree function takes a position as input, performs look-up in the database of trees and returns the data on the tree (with center) closest to the input position – provided that the distance is less than 1 m (configurable as DIST_LIM). Figure B1 shows how the block is used in the “ClosestTree” block.
Figure B1 Simulink block diagram showing how the 'ProxTree' block is used by the 'ClosestTree' block. The outputs 'status' and 'tree_id' are discarded. The 'status' (which tells whether a match was found or not) and the 'tree_id' outputs are currently ignored (the default 'TreeNE' will give large distance to cutter head position and thus not trigger “avoidance” – thus an explicit look-up status or tree-ID is not needed). 1.1 ImplementationThe implementation of the ProxTree block is done using an S-Function written in C according to the principles shown in Fig. B2.
Figure B2 Information flow and file relations when configuring the ProxTree block. The hooks are indicating where a file references another file, while an arrow denote processes, for instance converting arbitrary arranged measured data into a sorted list of tree positions). The database (or array of tree records) is derived from the measurements file, using the utility “prox” (input data on 'stdin', generated C source written to 'stdout'). In order to obtain fast look-up the trees are “sorted” in the database written. The ordering is according to Northing coordinate. When the application (executing on the xPC Target) requests a look-up the function first locates the range of trees whose Northing coordinates are valid candidates (this can be accomplished in O(log N) time because of the ordering), and then it tests each of the trees in this range to find the one closest to the input position (again, ignoring any trees, which are in a longer distance than DIST_LIM (1 m)). 1.2 The prox utilityAs indicated above the prox utility reads a number of tree definitions from 'stdin', stores them in a database, sorts the database, and outputs the sorted database to 'stdout' in a format digestible by a C compiler (i.e. C source). Calling syntax (at Command Prompt): prox <measurements_file.txt >gen_prox_data.c Figure B3 shows an example of output (the first lines) from the ”prox” program (when fed with full list of all measured trees/poles and viewed in the MS Visual Studio editor).
Figure B3 Sorted list, automatically generated C source. Configuration data (or database) for the ProxTree block. Appendix C: Supervisory logics for safetyThe purpose of the supervisory logic is to react to some of the unacceptable faults or conditions in a structure that ensures a proper sequencing of the different functions. The top level of this logic is shown in Fig. C1. 1.1 Navigation SuitableThe NavigationSuitable block collects the relevant inputs and evaluates whether Navigation mode (or Implement Task mode) is acceptable. The output is an error mask (Navigation Error Mask). If it is zero then the situation is acceptable for Navigation, otherwise a “bit” is set in the mask to signal, which condition failed. Since the early xPC Target scopes could not print in binary, octal or hexadecimal format, but only numbers in decimal base, it was chosen to adapt the error mask such that it would look like an error mask printed in octal format (even though it was decimal format). Example: Looking at the second digit in the mask (the tens) it is seen when looking at the Stateflow chart that 3 conditions influence this (Tab. C1). Table C1 “Bit” values for the second digit of the NEM (Navigation Error Mask). If the engine is not running there is no point in staying in Navigation mode. If the vehicle is not within the field, then it should stop immediately. If the actuator for the steering wheels is not operative due to overheating then “steering” is not available to the controller and the vehicle should stop.
Table C2 Break-down into individual “bits” and interpretation, for all valid values of the second digit in the NEM.
1.2 The Mode SequencerThe ModeSequencer block contains the states and it controls which low level controllers are enabled and what their references (objectives) are. Fig. C2 shows a part of the (rather large) “Finite State Automation” (or state machine) which makes up the ModeSequencer. When invoked the first time the ModeSequencer initializes the actuator positions. When prompted by the user it will enter Joystick mode (i.e. gearbox in neutral and brake disengaged), where the steering angle can be controlled from the panel, and the vehicle can be pushed (the rear wheels will turn with minimal resistance). Then the safety circuit should be energized and the engine started (and throttle set accordingly). After that the cutter unit clutch can be engaged and the vehicle can be started (i.e. enter Navigation mode). Depending on configuration the vehicle could also enter JoyStickCutting mode – where the cutter may be engaged (again, configurable), the vehicle moves forward powered by engine, and the steering wheels are controlled by buttons on the rear panel. This combination were used for test of the cutter unit (i.e. drive the cutter unit into weeds and evaluate the result). 1.3 Geo FenceOne of the safety blocks on the ACW are the ValidField block which prevent the vehicle from driving if it is outside the field or plantation borders defined. The input to this block is the latest GPS position received. The output is a flag (boolean), stating whether the GPS position is within the field boundary. To ensure that this system works properly the route plan should always be defined within the limits of the geo fence (unless the fence is used to terminate the operation when the treatment is completed). The block is configured using a "perimeter" script (which provides the block with 4 positions, which are taken to be vertices of a polygon, which is assumed to be convex). Due to implementation limitations the vertices must be supplied in counter clockwise order (Fig. C3).
Figure C3 Interpretation of positions supplied to the ValidField-function. The red grid shows the “invalid” positions. Construction (adaptation) of perimeter script for new plantation:
The route plan should stay within the limits of the geo fence.
|