Fuel use and emissions from non-road machinery in Denmark from 1985-2004 - and projections from 2005-2030
5 Fuel use and emissions
- 5.1 Agriculture
- 5.2 Forestry
- 5.3 Industry
- 5.4 Household and gardening
- 5.5 Inland waterways
- 5.6 Uncertainties
An overview of the fuel use and emission results for non road machinery in 2004 is given in Table 27 for agriculture, forestry, industry, and household and gardening. The diesel fuelled machinery in agriculture and industry are the most important source of fuel use and emissions of SO2, NOx, CO2, N2O, NH3 and TSP, whereas for NMVOC, CH4 and CO most of the emissions come from gasoline fuelled machinery. For the latter machinery types, household and gardening equipment are the most important source.
In Annex 2 the 1985-2004 fuel use and emission results are given in CollectER format (agriculture, forestry, industry, and household and gardening) together with fuel related emission factors. A more detailed description of the 2004 fuel use and emission results, and 1985-2004 emission trends are given in the following paragraphs.
Table 27 2004 Sectoral fuel use, emissions and percentage shares for land based non road machinery
For recreational craft Table 28 shows the total results of fuel use and emissions in 2004. The diesel engines are the most important source of fuel use and emissions of SO2, NOx, CO2, N2O, NH3 and TSP, whereas for NMVOC, CH4 and CO most of the emissions come from gasoline engines. In Annex 2 the 1985-2004 fuel use and emission results are given in CollectER format together with fuel related emission factors. The 2004 fuel use and emission results, and 1985-2004 emission trends are described in more details later in this chapter.
Table 28 2004 Sectoral fuel use, emissions and percentage shares for recreational craft
| Fuel type | Fuel | SO2 | NOx | NMVOC | CH4 | CO | CO2 | N2O | NH3 | TSP |
| [TJ] | [tons] | [tons] | [tons] | [tons] | [tons] | [ktons] | [tons] | [tons] | [tons] | |
| Diesel | 1002 | 94 | 879 | 170 | 3 | 454 | 74 | 3 | 0 | 105 |
| Gasoline | 404 | 1 | 161 | 1020 | 22 | 6411 | 30 | 0 | 0 | 49 |
| Grand total | 1406 | 95 | 1040 | 1191 | 25 | 6865 | 104 | 3 | 0 | 154 |
| Diesel | 71 | 99 | 85 | 14 | 11 | 7 | 72 | 87 | 83 | 68 |
| Gasoline | 29 | 1 | 15 | 86 | 89 | 93 | 28 | 13 | 17 | 32 |
| Grand total | 100 | 100 | 100 | 100 | 100 | 100 | 100 | 100 | 100 | 100 |
5.1 Agriculture
The subsectoral distribution of fuel use and emissions for agriculture in 2004 is shown in Table 29, together with the corresponding shares of the agricultural sector in total.
Table 29 2004 Subsectoral fuel use, emissions and percentage shares for agriculture
| Subsector | Fuel type | Fuel | SO2 | NOx | NMVOC | CH4 | CO | CO2 | N2O | NH3 | TSP |
| [TJ] | [tons] | [tons] | [tons] | [tons] | [tons] | [ktons] | [tons] | [tons] | [tons] | ||
| Tractors | Diesel | 9467 | 222 | 8398 | 1031 | 17 | 4713 | 701 | 29 | 2 | 748 |
| Harvesters | Diesel | 2019 | 47 | 1724 | 176 | 3 | 917 | 149 | 6 | 0 | 155 |
| Machine pools | Diesel | 1869 | 44 | 1620 | 131 | 2 | 727 | 138 | 6 | 0 | 84 |
| Other machinery | Diesel | 84 | 2 | 69 | 7 | 0 | 35 | 6 | 0 | 0 | 4 |
| Diesel total | 13439 | 315 | 11811 | 1346 | 22 | 6393 | 994 | 42 | 2 | 991 | |
| Other machinery | Gasoline | 256 | 1 | 26 | 264 | 35 | 5730 | 19 | 0 | 0 | 6 |
| Tractors | Gasoline | 55 | 0 | 1 | 58 | 5 | 2919 | 4 | 0 | 0 | 0 |
| Gasoline total | 311 | 1 | 27 | 322 | 40 | 8649 | 23 | 0 | 0 | 7 | |
| Grand total | 13750 | 315 | 11837 | 1667 | 62 | 15042 | 1017 | 42 | 3 | 998 | |
| Subsector | Fuel type | FC | SO2 | NOx | NMVOC | CH4 | CO | CO2 | N2O | NH3 | TSP |
| [%] | [%] | [%] | [%] | [%] | [%] | [%] | [%] | [%] | [%] | ||
| Tractors | Diesel | 69 | 70 | 71 | 62 | 27 | 31 | 69 | 69 | 62 | 75 |
| Harvesters | Diesel | 15 | 15 | 15 | 11 | 5 | 6 | 15 | 15 | 13 | 16 |
| Machine pools | Diesel | 14 | 14 | 14 | 8 | 3 | 5 | 14 | 14 | 13 | 8 |
| Other machinery | Diesel | 1 | 1 | 1 | 0 | 0 | 0 | 1 | 1 | 1 | 0 |
| Diesel total | 98 | 100 | 100 | 81 | 35 | 43 | 98 | 99 | 89 | 99 | |
| Other machinery | Gasoline | 2 | 0 | 0 | 16 | 56 | 38 | 2 | 1 | 11 | 1 |
| Tractors | Gasoline | 0 | 0 | 0 | 3 | 9 | 19 | 0 | 0 | 0 | 0 |
| Gasoline total | 2 | 0 | 0 | 19 | 65 | 57 | 2 | 1 | 11 | 1 | |
| Grand total | 100 | 100 | 100 | 100 | 100 | 100 | 100 | 100 | 100 | 100 |
Diesel tractors account for most of the fuel use (69%) and have the largest shares of agricultural non road emissions for most of the emitted substances. In this respect the diesel tractor emission shares of TSP, NOx, SO2, CO2, N2O, NMVOC and NH3 are 75, 71, 70, 69, 69, 62 and 62%, respectively. For CH4 and CO the gasoline fuelled equipment in the subsector “other machinery” has the largest emission shares of 56 and 38%.
5.1.1 Tractors
In general, the total fuel use is determined as the product of the total kWh’s produced and the aggregated specific fuel consumption in g/kWh. For diesel tractors, Figure 19 shows the 1985-2004 trends for these two parameters. In terms of total kWh’s, the effect of increasing engine sizes is opposite the effect of, with some fluctations though, generally decreasing tractor numbers (see Figure 3). The end result is, however, a decline in the total kWh’s produced from 1985 to 2004. The decrease in the average specific fuel consumption in g/kWh throughout the period is due to an increase in fuel efficiency as engines become larger and newer.
Figure 19 Total kWh’s produced and aggregated specific fuel consumption (g/kWh) for diesel tractors from 1985-2004
The resulting total fuel use and emissions development from 1985 to 2004 is shown in Figure 20. The fuel use curve incorporates the effect from kWh fluctuations and fuel efficiency levels. From 1985 to 2004 the total fuel use and directly derived CO2 emissions drop by 23%.
For N2O and NH3, the 1985-2004 emission declines at 17% are slightly smaller than the fuel use drop, because fuel efficiency increases and the N2O and NH3 emission factors in g/kWh are constant throughout the period. The significant reduction in SO2 emissions from 1985 to 2004 (92%) is due to the step wise lowering of the sulphur content in diesel fuel used for non road purposes.
For NOx the emission decrease is only 4% from 1985-2004, the main reason being the large emission contribution from 1991-Stage I engines (characterised by high NOx emission factors) which more or less outbalances the emission effect of decreasing fuel use. The emission declines of 61, 50, 50 and 42% for TSP, NMVOC, CH4 and CO, respectively, are larger than the decrease in fuel use. This is explained by the gradually improved engine emission technology and the strenghtened EU emission standards from 2001.
The stock of gasoline tractors is almost phased out by the end of the 1985-2004 time period, and the fuel use and emission effect of this is clearly visible from the curves on Figure 20. Still, taking into account the figures for total diesel and gasoline fuel use, the emissions of CO og CH4 from gasoline tractors, and to a smaller extend the NMVOC emissions, are still significant. This is due to the very high CO, CH4 and NMVOC emission factors for old gasoline engines. For all other components, the emission contribution from gasoline tractors is only marginal.
Figure 20 1985-2004 Time series of fuel use and emissions for tractors in agriculture
The EU strengthening of emission standards has a strong effect on the emission level specific shares of total emissions for diesel tractors (Figure 21). In this way the total fuel use share for stage I and II engines (20%) is larger than the emission shares of NOx, NMVOC, CO and TSP, which are 12, 6, 8 and 5%, respectively. For 1991-stage I engines specifically, Figure 21 also show the difference in NOx emissions and fuel use shares, being the main explanation for the small total NOx decrease for diesel tractors.
Figure 21 Fuel use and emissions for diesel tractors in 2004 split into emission levels
The emission level specific fuel use and emission developments from 1985-2004 are shown in Figure 22, and from this it becomes clear that the emission shares for newer emission levels are generally smaller than their corresponding shares of fuel use.
Figure 22 Fuel use and emissions for diesel tractors from 1985-2004 split into emission levels
In Annex 2 the 1985-2004 fuel use, emissions and fuel related emission factors are listed for diesel and gasoline tractors, respectively.
5.1.2 Harvesters
Figure 23 shows the 1985-2004 trends for total kWh’s and aggregated specific fuel consumption in g/kWh for harvesters. The total kWh’s produced are more or less maintained at the same level over this time period, as a balance between the decrease in total numbers and the increase in average engine size shown in Figure 8. The overall decrease in the average specific fuel consumption throughout the period is due to an increase in fuel efficiency for newer and larger engines.
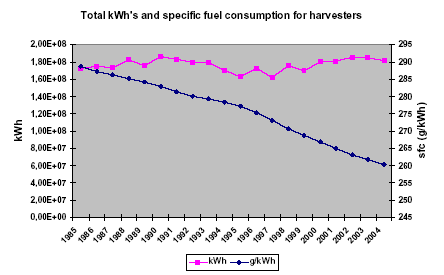
Figure 23 Total kWh’s produced and aggregated specific fuel consumption (g/kWh) for diesel tractors from 1985-2004
The resulting total and emission level specific fuel use and emission developments from 1985 to 2004 are shown in Figure 24. The fuel use curve incorporates the effect from kWh fluctuations and fuel efficiency levels. From 1985 to 2004 the total fuel use and directly derived CO2 emissions drop by 5%.
The emission explanations given for diesel tractors also apply for harvesters. Though especially for NOx, the emission development for harvesters as a total is less positive than for tractors. This is mainly due to the large emission contribution from 1990-Stage I engines as a product of high emission factors and large fuel quantities being burned. For NOx, N2O and NH3, the emissions increase with 25, 5 and 5% from 1985-2004, whereas the emission declines for SO2, TSP, NMVOC, CH4 and CO are 91, 62, 56, 56 and 42%, respectively.
Figure 24 1985-2004 Time series of fuel use and emissions for agricultural harvesters
The EU strengthening of emission standards improves the emission levels from harvesters. Figure 25 shows that total fuel use share for Stage II engines (21%) in 2004 is larger than the emission shares of NOX, NMVOC, CO and TSP, which are 11, 7, 10 and 3%, respectively. The reason for an almost zero fuel use and NOX emissions for Stage I engines, is a very small number of harvesters complying with this emission level.
Figure 25 Fuel use and emissions for harvesters in 2004 divided into layers
In Annex 2 the 1985-2004 fuel use, emissions and fuel related emission factors are listed for harvesters.
5.1.3 Machine pools
For machine pools, the total fuel use and emissions development from 1985 to 2004 are shown in Figure 26. It must be noted that the large uncertainties on parameters such as engine age and size distributions and annual working hours, influence the certainty of the calculated results.
Tractors are the most important for fuel use and emissions. The fuel use and emission shares for self-propelled vehicles and harvesters are considerably smaller. The shares for self-propelled vehicles, though, grow from zero in 1992 to around double the shares for harvesters in 2004.
The total fuel use and directly derived CO2 emissions increase with 35%, and for NOx, N2O and NH3 the emission increases are 67, 48 and 48%, respectively, from 1985-2004. For SO2, TSP, NMVOC, CH4 and CO the respective emission decreases are 87, 59, 38, 38 and 18%, in the same time period.
Figure 26 1985-2004 Time series of fuel use and emissions for machine pools
The lifetimes for machine pool machines are small, and the stock modernity means that the relative emissions are always low. This is reflected in the overall fuel use and emission split for 2004 on Figure 27, where only three emission levels are present.
Figure 27 Fuel use and emissions for machine pools in 2004 divided into layers
In Annex 2 the 1985-2004 fuel use, emissions and fuel related emission factors are listed for machine pool tractors, harvesters and self-propelled vehicles.
5.1.4 Other machinery
The fuel use and emission shares for other machinery in agriculture are marginal compared with the non road totals. The results for 2004 are shown in Table 30 divided into types of machinery.
Table 30 Fuel use and emissions in 2004 for other machinery types
| Machinery type | Fuel type | Fuel | SO2 | NOX | NMVOC | CH4 | CO | CO2 | N2O | NH3 | TSP |
| [TJ] | [tons] | [tons] | [tons] | [tons] | [tons] | [ktons] | [tons] | [tons] | [tons] | ||
| Self-propelled vehicles | Diesel | 84 | 2 | 69 | 7 | 0 | 35 | 6 | 0 | 0 | 4 |
| ATV professional | Gasoline | 136 | 0 | 15 | 146 | 22 | 2225 | 10 | 0 | 0 | 4 |
| Fodder trucks | Gasoline | 76 | 0 | 5 | 53 | 5 | 2528 | 6 | 0 | 0 | 1 |
| ATV private | Gasoline | 41 | 0 | 5 | 61 | 8 | 905 | 3 | 0 | 0 | 2 |
| Sweepers | Gasoline | 1 | 0 | 0 | 1 | 0 | 32 | 0 | 0 | 0 | 0 |
| Scrapers | Gasoline | 1 | 0 | 0 | 1 | 0 | 19 | 0 | 0 | 0 | 0 |
| Bedding machines | Gasoline | 1 | 0 | 0 | 1 | 0 | 14 | 0 | 0 | 0 | 0 |
| Other (gasoline) | Gasoline | 0 | 0 | 0 | 0 | 0 | 6 | 0 | 0 | 0 | 0 |
| Gasoline total | 256 | 1 | 26 | 264 | 35 | 5730 | 19 | 0 | 0 | 6 | |
| Grand total | 340 | 3 | 95 | 271 | 35 | 5764 | 25 | 1 | 0 | 11 |
It should be noted that the use of ATV’s has increased during the later years; no driving was made with professional and private vehicles before 1992 and 2000, respectively. Going from zero in 1992/2000 the 2004 shares for ATV’s are 69% for fuel use, CO2 and SO2, 78% for NOX and NMVOC, and 55, 73, 92 and 98% for CO, N2O, CH4, TSP and NH3, respectively.
In Annex 2 the 1985-2004 fuel use, emissions and fuel related emission factors are listed per fuel type for other machinery, and for ATV’s as a single category.
5.2 Forestry
The subsectoral distribution of fuel use and emissions for forestry in 2004 is shown in Table 31, together with the corresponding shares of the forestry sector total.
Table 31 2004 Subsectoral fuel use, emissions and percentage shares for forestry
Chain saws (2-stroke engines) account for 33% of all fuel use in forestry in 2004, and have very high emission shares of NMVOC (98%), CH4 (96%) and CO (96%). For chain saws, the fuel use and emissions have been reduced by 75% from 1990 to 2004, because of similar reductions of in the number of forestry workers in the same time period.
For diesel, the largest emission shares are calculated for NOx (97%), SO2 (95%), N2O (94%), NH3 (82%), CO2 (68%) and TSP (56%). The largest source of fuel use and emissions is chippers, followed by forwarders and harvesters.
In Annex 2 the 1985-2004 fuel use, emissions and fuel related emission factors are listed for diesel and gasoline fuelled machinery, respectively.
5.3 Industry
The subsectoral distribution of fuel use and emissions for industry in 2004 is shown in Table 32, together with the corresponding shares of the industry non road total.
Table 32 2004 Subsectoral fuel use, emissions and percentage shares for industry
Construction machinery accounts for most of the fuel use (71%) and is the most important source of emissions from industry. The emission shares for SO2, TSP, NOX, NMVOC, CO and CH4 are 79, 71, 68, 51, 50 and 30%. For CO2, N2O and NH3 the emission share is 72%.
5.3.1 Construction Machinery
Table 33 shows the fuel use and emissions in 2004 for the types of construction machinery where specific sales figures exist. This subgroup of machinery is a major diesel fuel consumer and accounts for 86% of the total diesel fuel used by construction machinery in 2004. The fuel use and emission results for the remaining construction machinery types are shown later in this chapter.
Table 33 2004 Fuel use, emissions and percentage shares for selected types of construc-tion machinery
The large track type excavators and wheel loaders (>5,1 tons) are equally important in terms of fuel use and emissions, and have the largest shares of fuel use and NOx, SO2, CO2, N2O, NH3 and CO emissions in 2004. For NMVOC, CH4 and TSP, small track type excavators (0-5 tons) are the largest emission source. The fuel use and emission shares for wheel type excavators, dump trucks and track type dozers and loaders are only 4% or less.
The total and emission level specific fuel use and emission developments from 1985 to 2004 are shown in Figure 28, for the machinery types listed in Table 19. The general machinery lifetime is 10 years, except for mini loaders where a lifetime of 14 years is expected. On Figure 28, small fuel use and emission contributions from mini loaders appear for four more years at any given emission level, after the contributions from other machinery types have been phased out.
The total fuel use and directly derived CO2 emissions increase by 8% from 1985 to 2004, and this is explained by the growth in the activity level for the machinery types as a whole. However, it should be noted that the total development incorporates both fuel use increases and decreases, cf. the stock development curves shown in the Figures 14 and 15. Prior to 1990, the 1990 stock and operational data are used, and the slight fuel use decrease from 1985 to 1990 is explained by the improved fuel efficiency for 1981-1990 machinery being phased in.
For the remaining components the emission explanations given for diesel tractors also appy for construction machinery. From 1985-2004, the emissions of N2O and NH3 increase by 16%, whereas the emissions decrease for SO2, TSP, NMVOC, CH4, CO and NOx are 89, 45, 37, 37, 26 and 4% in the same time period.
Figure 28 1985-2004 Time series of fuel use and emissions for selected types of construction machinery
The emission level specific shares of fuel use and emissions in 2004 are shown in Figure 29. The effect of the strengthened stage I and II emission standards is visible since fuel use shares per emission level are always higher than their corresponding emission shares. As for machine pool machinery, a quick penetration of new emission levels into the machinery stock occurs due to the relatively small lifetimes for the machinery types in question.
Figure 29 Level specific shares of fuel use and emissions for selected construction machinery in 2004
In Annex 2 the 1985-2004 fuel use, emissions and fuel related emission factors are listed for construction machinery.
5.3.2 Fork lifts
The 2004 fuel use and emission results for diesel and LPG fork lifts were shown in Table 13 in the beginning of this chapter. The 1985-2004 time series of results are shown in Figure 30.
For diesel fork lifts the total stock increases from 1985-2004 and causes the fuel use and CO2 emissions to increase by 38%. In the same time period the emission increases of NOx, N2O and NH3 are 58, 50 and 50%, whereas the emissions of SO2, TSP, NMVOC, CH4 and CO emission decrease by 86, 37, 22, 22 and 7%, respectively. The explanations for the emission changes relative to the fuel use development are generally the same as for tractors (see Chapter 5.1.1).
For LPG fork lifts the fuel use and emissions decrease by 14% from 1985 to 2004, due to a decrease in stock numbers and the application of constant emission factors. Though, for LPG fuels the sulphur percentage is zero, and hence no SO2 emissions occur related to the usage of LPG.
Compared with diesel, the LPG emissions for TSP, CO and NMVOC are generally low, but on the contrary high for NOx, CH4, N2O and NH3. The two emission tendencies rely on the values of the emission factors.
Figure 30 1985-2004 time series of fuel use and emissions for fork lifts
The emission level specific shares of fuel use and emissions in 2004 are shown in Figure 31. The effect of the strenghtened stage I and II emission standards is visible since fuel use shares per emission level are always higher than their corresponding emission shares.
Figure 31 Level specific shares of fuel use and emissions for selected construction machinery in 2004
In Annex 2 the 1985-2004 fuel use, emissions and fuel related emission factors are listed for diesel and LPG fuelled fork lifts, respectively.
Other machinery
Fuel use and emissions estimates are listed in Table 34 for other mobile machinery in industry. Figures for individual percentage shares are listed in Table 35.
Table 34 2004 fuel use and emissions for other industrial non road machinery
Table 35 2004 fuel use and emission percentage shares for other industrial non road machinery
5.4 Household and gardening
The subsectoral fuel use and emissions distributions in 2004 for household and gardening equipment are shown in Table 36, together with the corresponding shares of total results.
Table 36 2004 Fuel use, emissions and percentage shares for household and gardening equipment
| Subsector | Fuel type | Machinery type | Fuel | SO2 | NOx | NMVOC | CH4 | CO | CO2 | N2O | NH3 | TSP |
| [TJ] | [tons] | [tons] | [tons] | [tons] | [tons] | [ktons] | [tons] | [tons] | [tons] | |||
| Riders (professional) | Gasoline | 4-stroke | 1151 | 3 | 77 | 739 | 72 | 39336 | 84 | 2 | 0 | 8 |
| Riders (private) | Gasoline | 4-stroke | 1033 | 2 | 72 | 776 | 63 | 34427 | 75 | 1 | 0 | 7 |
| Lawn movers (private) | Gasoline | 4-stroke | 565 | 1 | 68 | 1354 | 54 | 13632 | 41 | 1 | 0 | 3 |
| Chain saws (professional) | Gasoline | 2-stroke | 393 | 1 | 19 | 2513 | 21 | 6242 | 29 | 0 | 0 | 29 |
| Cultivators (professional) | Gasoline | 4-stroke | 362 | 1 | 44 | 364 | 34 | 8724 | 26 | 0 | 0 | 2 |
| Lawn movers (professional) | Gasoline | 4-stroke | 209 | 0 | 24 | 301 | 21 | 5180 | 15 | 0 | 0 | 1 |
| Shrub clearers (professional) | Gasoline | 2-stroke | 116 | 0 | 4 | 905 | 7 | 1875 | 8 | 0 | 0 | 13 |
| Hedge cutters (professional) | Gasoline | 2-stroke | 62 | 0 | 2 | 483 | 4 | 1000 | 5 | 0 | 0 | 7 |
| Trimmers (professional) | Gasoline | 2-stroke | 43 | 0 | 1 | 341 | 3 | 703 | 3 | 0 | 0 | 5 |
| Shrub clearers (private) | Gasoline | 2-stroke | 41 | 0 | 1 | 330 | 3 | 648 | 3 | 0 | 0 | 4 |
| Cultivators (private-large) | Gasoline | 4-stroke | 32 | 0 | 2 | 54 | 4 | 1121 | 2 | 0 | 0 | 0 |
| Chain saws (private) | Gasoline | 2-stroke | 29 | 0 | 1 | 237 | 2 | 459 | 2 | 0 | 0 | 3 |
| Trimmers (private) | Gasoline | 2-stroke | 25 | 0 | 1 | 200 | 2 | 393 | 2 | 0 | 0 | 3 |
| Hedge cutters (private) | Gasoline | 2-stroke | 11 | 0 | 0 | 91 | 1 | 170 | 1 | 0 | 0 | 1 |
| Cultivators (private-small) | Gasoline | 4-stroke | 1 | 0 | 0 | 2 | 0 | 27 | 0 | 0 | 0 | 0 |
| Other machinery | Gasoline | 2-stroke | 6 | 0 | 0 | 41 | 0 | 133 | 0 | 0 | 0 | 1 |
| Other machinery | Gasoline | 4-stroke | 0 | 0 | 0 | 0 | 0 | 2 | 0 | 0 | 0 | 0 |
| Total | 2-stroke | 719 | 2 | 30 | 5100 | 42 | 11491 | 52 | 0 | 0 | 65 | |
| Total | 4-stroke | 3359 | 8 | 287 | 3631 | 249 | 102582 | 245 | 5 | 0 | 23 | |
| Gasoline total | 4078 | 9 | 317 | 8731 | 290 | 114073 | 298 | 5 | 0 | 87 | ||
| Fuel | SO2 | NOx | NMVOC | CH4 | CO | CO2 | N2O | NH3 | TSP | |||
| [%] | [%] | [%] | [%] | [%] | [%] | [%] | [%] | [%] | [%] | |||
| Riders (professional) | Gasoline | 4-stroke | 28 | 28 | 24 | 8 | 25 | 34 | 28 | 34 | 30 | 9 |
| Riders (private) | Gasoline | 4-stroke | 25 | 25 | 23 | 9 | 22 | 30 | 25 | 30 | 27 | 8 |
| Lawn movers (private) | Gasoline | 4-stroke | 14 | 14 | 22 | 16 | 19 | 12 | 14 | 15 | 13 | 4 |
| Chain saws (professional) | Gasoline | 2-stroke | 10 | 10 | 6 | 29 | 7 | 5 | 10 | 3 | 9 | 33 |
| Cultivators (professional) | Gasoline | 4-stroke | 9 | 9 | 14 | 4 | 12 | 8 | 9 | 9 | 9 | 2 |
| Lawn movers (professional) | Gasoline | 4-stroke | 5 | 5 | 8 | 3 | 7 | 5 | 5 | 5 | 5 | 1 |
| Shrub clearers (professional) | Gasoline | 2-stroke | 3 | 3 | 1 | 10 | 3 | 2 | 3 | 1 | 2 | 14 |
| Hedge cutters (professional) | Gasoline | 2-stroke | 2 | 2 | 1 | 6 | 1 | 1 | 2 | 0 | 1 | 8 |
| Trimmers (professional) | Gasoline | 2-stroke | 1 | 1 | 0 | 4 | 1 | 1 | 1 | 0 | 1 | 5 |
| Shrub clearers (private) | Gasoline | 2-stroke | 1 | 1 | 0 | 4 | 1 | 1 | 1 | 0 | 1 | 5 |
| Cultivators (private-large) | Gasoline | 4-stroke | 1 | 1 | 1 | 1 | 1 | 1 | 1 | 1 | 1 | 0 |
| Chain saws (private) | Gasoline | 2-stroke | 1 | 1 | 0 | 3 | 1 | 0 | 1 | 0 | 1 | 4 |
| Trimmers (private) | Gasoline | 2-stroke | 1 | 1 | 0 | 2 | 1 | 0 | 1 | 0 | 0 | 3 |
| Hedge cutters (private) | Gasoline | 2-stroke | 0 | 0 | 0 | 1 | 0 | 0 | 0 | 0 | 0 | 1 |
| Cultivators (private-small) | Gasoline | 4-stroke | 0 | 0 | 0 | 0 | 0 | 0 | 0 | 0 | 0 | 0 |
| Other machinery | Gasoline | 2-stroke | 0 | 0 | 0 | 0 | 0 | 0 | 0 | 0 | 0 | 1 |
| Other machinery | Gasoline | 4-stroke | 0 | 0 | 0 | 0 | 0 | 0 | 0 | 0 | 0 | 0 |
| Total | 2-stroke | 18 | 18 | 10 | 58 | 14 | 10 | 18 | 6 | 15 | 74 | |
| Total | 4-stroke | 82 | 82 | 90 | 42 | 86 | 90 | 82 | 94 | 85 | 26 | |
| Gasoline total | 100 | 100 | 100 | 100 | 100 | 100 | 100 | 100 | 100 | 100 |
The 4-stroke engines have a fuel use share of 82% and emission shares between 80 and 90% for all components, except NMVOC and TSP. The 2-stroke engine emission shares for these two components are high, in the order of 58 and 74%, respectively, due to high emission factors. The fuel use and emission contributions are marginal from machinery types (other machinery) for which no specific data are gathered in the present project.
The largest individual emission sources for all other components than NMVOC and TSP are professional and private riders, whereas for NMVOC and TSP the highest emitters are chain saws, shrub clearers and lawn movers (NMVOC).
From 1985 to 2004 there has been a 113% increase in total fuel use, SO2 and CO2 emissions. For NOx, NH3, N2O, TSP, NMVOC, CO and CH4, the emissions have increased by 179, 132, 123, 117, 87, 78 and 51%, respectively.
Figure 32 shows the 1985-2004 fuel use and emission trends per machinery type.
Even though some fuel efficiency improvements have been obtained, per machinery type the fuel use more or less follow the activity level. Following this, it is clear from Figure 32 that the overall rise in total fuel use is to a large extent due to the increased use of riders which has been even more pronounced after 2000. The visible NMVOC, CH4 and CO emission reductions for cultivators and lawn movers (1985-2000) and for chain saw TSP (1985-1993) are due to emission factor improvements.
Figure 32 1985-2004 time series of fuel use and emissions for household and gardening equipment
Figure 33 shows the fuel use and emission developments per emission level from 1985-2004, split into 2-stroke and 4-stroke results. For 4-stroke NMVOC and CO, and for 2-stroke TSP the emission factors become gradually lower as engines become newer, whereas for 4-stroke NOx the opposite situation occurs. These emission tendencies become clear when the emission and fuel use graphs are compared, for 2-stroke and 4-stroke engines individually.
Figure 33 1985-2004 time series of fuel use and emissions per emission level for 2-stroke and 4-stroke household and gardening equipment
In Annex 2 the 1985-2004 fuel use, emissions and fuel related emission factors are listed for 2-stroke and 4-stroke gasoline engines, respectively.
5.5 Inland waterways
An overview of the fuel use and emission results for recreational craft in 2004 is given in Table 37. The diesel fuelled engines account for 71% of the total fuel use, and have SO2, N2O, NOx, NH3, CO2, and TSP emission shares of 99, 87, 85, 83, 72 and 68%, respectively. The most important single source is motor boats (27-34 ft) followed by motor boats (>34 ft), motor sailors, sailing boats (<26 ft) and motor boats (<27 ft).
For CO, CH4 and NMVOC most of the emissions come from gasoline fuelled machinery. The CO, CH4 and NMVOC emission shares are 93, 89 and 8, respectively. Here the most important single sources are speed boats (4-stroke, in board engines), speed boats (2-stroke) and yawls/cabin boats (2-stroke).
Table 37 2004 Fuel use, emissions and percentage shares for recreational craft
From 1985 to 2004 there has been a 188% increase in total fuel use. The N2O, NH3, NOx, SO2, CO2, TSP, CO, CH4 and NMVOC emissions have increased by 300, 258, 239, 201, 189, 106, 81, 75 and 13%, respectively.
Figure 34 shows the 1985-2004 fuel use and emission trends split into totals for diesel, 2-stroke gasoline and 4-stroke gasoline.
The EU directive 2003/44 strengthened emission standards apply for new engines in 2006 (diesel and gasoline 4-stroke) and 2007 (gasoline 2-stroke), and therefore the fuel use and emissions per boat type directly follow the activity level in the 1985-2004 time period. So, the main reason for the SO2, NOx, CO2, N2O, NH3 and TSP emission growth is the overall rise in total diesel fuel use.
From 1998 and onwards the 2-stroke emission decreases and the 4-stroke emission increases even stronger due to the gradual shift towards the more environmentally friendly 4-stroke gasoline engine technology. In terms of NMVOC and TSP, the total gasoline engine result is a 1% increase for NMVOC and a 4% decrease for TSP from 1985 to 2004 set in relation to a fuel use increase of 50% in the same period.
Figure 34 1985-2004 time series of fuel use and emissions for recreational craft
In Annex 2 the 1985-2004 fuel use, emissions and fuel related emission factors are listed for diesel engines and 2-stroke and 4-stroke gasoline engines, respectively.
5.6 Uncertainties
Uncertainty estimates for fuel use and emissions are made according to the guidelines formulated in the Good Practice Guidance and Uncertainty Management in National Greenhouse Gas Inventories (IPCC, 2000).
For 2004, the detailed uncertainty calculation sheets are shown in Annex 6, and input for these are uncertainty factors for activity data and fuel use/emission factor uncertainties.
The uncertainty factors for activity data shown in Table 24 are calculated as:
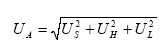 (8)
(8)
Where UA = activity data uncertainty factor, US = stock uncertainty factor, UH = working hours uncertainty factor, UL = load uncertainty factor.
The determination of the stock, hours and load uncertainty factors shown in Table 38 are based on own judgements and are given as 95% confidence ratios.
Table 38 Uncertainty factors for machinery stock, working hours and engine loads
| Category | Stock | Hours | Load factor | Activity data uncertainty |
| US | UH | UL | UA | |
| Agriculture | 0,1 | 0,1 | 0,2 | 0,24 |
| Forestry | 0,1 | 0,2 | 0,2 | 0,30 |
| Industry (constr. machinery, fork lifts) | 0,2 | 0,2 | 0,2 | 0,35 |
| Industry (other) | 0,3 | 0,2 | 0,2 | 0,41 |
| Household and gardening | 0,2 | 0,2 | 0,2 | 0,35 |
| Recreational craft | 0,2 | 0,3 | 0,2 | 0,41 |
The fuel use and emission factor uncertainties given as 95% confidence ratios are shown in Table 39. For fuel use the uncertainty factors are based on own judgements. The emission factor uncertainties for CO2, CH4 and N2O come from IPCC (2000) and for SO2, NOx, NMVOC, CO, NH3 and TSP the uncertainty factors are used as proposed by the Good Practice Guidance for CLRTAP Emission Inventories (Pulles et al. 2001).
Table 39 Fuel use and emission factor uncertainties
| Category | Fuel | SO2 | NOx | NMVOC | CH4 | CO | CO2 | N2O | NH3 | TSP |
| Agriculture | 0,1 | 0,5 | 0,5 | 0,5 | 0,5 | 0,5 | 0,05 | 1000 | 1000 | 0,5 |
| Forestry | 0,1 | 0,5 | 0,5 | 0,5 | 0,5 | 0,5 | 0,05 | 1000 | 1000 | 0,5 |
| Industry (constr. machinery, fork lifts) | 0,1 | 0,5 | 0,5 | 0,5 | 0,5 | 0,5 | 0,05 | 1000 | 1000 | 0,5 |
| Industry (other) | 0,1 | 0,5 | 0,5 | 0,5 | 0,5 | 0,5 | 0,05 | 1000 | 1000 | 0,5 |
| Household and gardening | 0,1 | 0,5 | 0,5 | 0,5 | 0,5 | 0,5 | 0,05 | 1000 | 1000 | 0,5 |
| Recreational craft | 0,1 | 0,5 | 0,5 | 0,5 | 0,5 | 0,5 | 0,05 | 1000 | 1000 | 0,5 |
In Table 40 the uncertainty results are shown, expressed as the 95% confidence ratios.
Table 40 uncertainty results (95% confidence ratios) for fuel use and emissions in 2004
| Category | Fuel | SO2 | NOx | NMVOC | CH4 | CO | CO2 | N2O | NH3 | TSP |
| Agriculture | 26 | 56 | 56 | 56 | 56 | 56 | 26 | 1000 | 1000 | 56 |
| Forestry | 32 | 58 | 58 | 58 | 58 | 58 | 32 | 1000 | 1000 | 58 |
| Industry (constr. machinery, fork lifts) | 36 | 61 | 61 | 61 | 61 | 61 | 36 | 1001 | 1001 | 61 |
| Industry (other) | 42 | 65 | 65 | 65 | 65 | 65 | 42 | 1001 | 1001 | 65 |
| Household and gardening | 36 | 61 | 61 | 61 | 61 | 61 | 36 | 1001 | 1001 | 61 |
| Recreational craft | 42 | 65 | 65 | 65 | 65 | 65 | 42 | 1001 | 1001 | 65 |
| Total | 18 | 35 | 37 | 40 | 43 | 48 | 18 | 621 | 619 | 35 |
Version 1.0 June 2006, © Danish Environmental Protection Agency