In Vivo Investigation of Dietary Exposure to 5 Pesticides
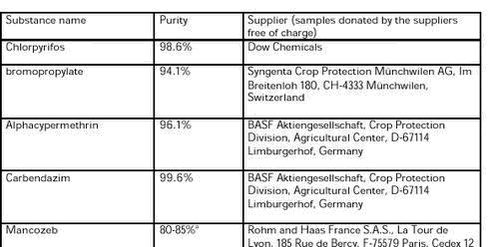
5 Combined exposure study5.1 Hypothesis and objectives of the combined exposure study5.2 Material and methods 5.2.1 Animals 5.2.2 Environment 5.2.3 Diet and water 5.2.4 Test and control substances 5.2.6 Experimental procedures 5.2.7 Plasma pesticide concentrations 5.2.8 Terminal procedures 5.2.9 Data evaluation 5.3 Results 5.3.1Clinical signs, morbidity and mortality 5.3.2 Body weights 5.3.3 Relative food and water consumption 5.3.4 Functional observational battery (FOB) 5.3.5 Motor activity measurement 5.3.6 Eye examinations 5.3.7 Acetylcholinesterase activity 5.3.8 Plasma pesticides concentrations 5.3.9 Haematology 5.3.10 Pathology 5.4 Conclusions of the combined exposure study 5.1 Hypothesis and objectives of the combined exposure studyIt is hypothesised that the effect of chlorpyrifos on brain acetylcholinesterase inhibition is enhanced by the co-administration of the four pesticides: alphacypermethrin, bromopropylate, carbendazim and mancozeb. The primary objectives of this study were first to confirm the effects identified in the initial study (increased brain acetylcholinesterase inhibition), and if possible to show a dose-response of brain acetylcholinesterase by varying the concentration of chlorpyrifos while keeping the concentration of the other four pesticides at a constant concentration. Second, to examine if liver metabolism of chlorpyrifos to the active metabolite chlorpyrifos-oxon was the mode of action. 5.2 Material and methodsThe study design followed OECD guideline 407 ’repeated dose 28 day oral toxicity study’ with minor deviations. 5.2.1 AnimalsMale and female rats, 96 of each sex, of the Brl:WIST Han@Mol strain were obtained from M&B A/S, Ry, Denmark. The animals were 4 weeks of age on arrival (on May 13, 2002). Groups of eight animals per sex were formed by stratified randomisation. The group mean body weight was within 5 % of the overall mean for each sex. Males weighed between 49 and 66 g (overall mean 55.0 g), females weighed between 48 and 67 g (overall mean 54.8 g). The animals were approximately 5 weeks old at the start of dosing (May 20, 2002). The combined exposure study included two subsets of rats, each consisting of 6 groups with 8 rats of each sex, with a total 48 rats per sex. The two subsets of rats were given the same test diets (starting on May 20, 2002). One subset was sacrificed after 1 week of dosing (May 27, 2002), while the other subset was sacrificed after 4 weeks of dosing. The purpose of the first subset was to obtain 1-week blood samples for analysis of chlorpyrifos, chlorpyrifos metabolites, bromopropylate, carbendazim and alphacypermethrin. The first subset is referred as satellite study under plasma pesticide concentration. The second subset was the core study population on which all other examinations were done. 5.2.2 EnvironmentThe animals were housed in a single, exclusive room, air-conditioned to provide a minimum of 10 air changes per hour. The temperature was 22±1°C, and the relative humidity was 55%±5%. Fluorescent lighting was controlled automatically to give a cycle of 12 hours light (0900 to 2100) and 12 hours dark. The animals were housed in pairs by sex in Macrolon cages type III with Tapvei aspenwood bedding. 5.2.3 Diet and waterDiet was provided ad libitum. All rats received standard diet (not containing vehicle) during the 7-day period from arrival to the start of dosing. During the dosing period, the rats received test diet according to dose group. Acidified tap water was provided ad libitum in nipple bottles (citric acid, pH=3). Drinking water was from the municipal water supply. 5.2.4 Test and control substancesThe test substances, purity and supplier are shown in Table 7. Table 7. Test substances names, purity and supplier a 15-20% related reaction products
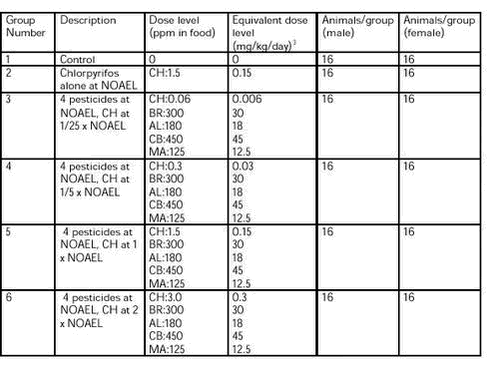
The control substance and vehicle for the test substances was acetone. The test substances were administered orally in the diet. The animals received the substance in the diet for 28 days excluding the day of sacrifice. 5.2.4.1 Dose levels The dose levels selected are shown in Table 8. 5.2.4.2 Test substance formulation and preparation Altromin International, Germany, prepared the 6 test diet. Diets were prepared once for the entire study. The test substances according to 6 dose levels were dissolved in 50 ml of acetone and added to 1000 g of powdered diet altromin 1321, which was homogenised. The 1000 g were mixed and homogenised with another 4000 g of diet altromin 1321. The 5000 g were mixed and homogenised with another 20000 g of diet altromin 1321. The powdered diet was made in to pellets. 5.2.4.3 Storage The diets were stored in the original bags at room temperature. Table 8. Group number, group description and dose levels in ppm and mg/kg/day for amount of chlorpyrifos (CH), bromopropylate (BR), alphacypermethrin (AL), carbendazim (CB) and mancozeb (MA) given to each dose group, and number of animals (male/female)
((mg/kg/day)3 ) It was planned to take samples of 50 g of each test diet during week 4 of the dosing period. However, by a mistake the samples were taken (14 July 2002) weeks later. Analyses for alphacypermethrin, bromopropylate, chlorpyrifos, and carbendazim were performed at the Institute of Food Safety and Nutrition. Analysis for mancozeb was done at Food Region Copenhagen. Confirmation analysis of mancozeb was performed by the Pesticide laboratory for analysis of pesticides in fruit, vegetables, water and soil at the Plant Protection Centre, Ås, Norway. All laboratories are accredited. Each sample was analysed twice. The measured concentrations (mean of 2 replicates) and percentages of the intended concentration are shown in Table 9. The concentration of mancozeb was clearly below the intended concentration, and the concentration of chlorpyrifos in group 3 was three times the intended. The pesticide concentrations in the feed are therefore not regarded as satisfactory in relation to the intended. To examine homogeneity five samples were taken from the test diet for group 3. The five samples were taken from various places in the bag. The results (mean of 2 replicates) of the analysis are shown in Table 10. The homogeneity is regarded as satisfactory.
Table 9. The measured concentration of pesticides in the diet (mg/kg)/ and the percentages of the intended concentrations for the six dose groups. Chlorpyrifos (CH), bromopropylate (BR), alphacypermethrin (AL), carbendazim (CB) and mancozeb (MA). See dose groups in table 8.
Table 10. Measured concentrations (mg/kg) of pesticides Chlorpyrifos (CH), bromopropylate (BR), alphacypermethrin (AL), carbendazim (CB) and mancozeb (MA) in the diet of dose group 3. Samples are taken from various places in the bag of the diet for group 3.
All animals were given a health inspection on arrival and observed daily during the 7-day acclimatisation period. The animals were assigned to treatment groups during the acclimatisation period using a randomisation procedure based on body weight. Group body weight means and standard deviations were calculated and inspected to ensure there were no unacceptable differences between groups. The animals were individually identified by ear clipping (see Table 11). Table 11. Ear clip animal identity number for males and females in the 6 dose groups
Cages were appropriately identified with study information including study number and animal numbers. 5.2.6 Experimental procedures5.2.6.1 Clinical signs, morbidity and mortality All animals were observed twice daily in their cage for signs of adverse health or overt toxicity. A record was maintained of the clinical conditions for the study population as a whole. If adverse clinical signs were observed, an individual record was to be kept for the animals concerned. 5.2.6.2 Body weights Individual body weights were recorded at weekly intervals. The last of these measurements was done in the morning on the first day of sacrifice (June 17, 2002), and these body weights were used for calculation of relative organ weights. 5.2.6.3 Food and water consumption The amount of food and water consumed by the animals in each cage was measured weekly. 5.2.6.4 Eye examinations Eye examinations were performed during the acclimatisation period on all rats scheduled for sacrifice after 4 weeks. A second examination was performed in the fourth test week. The week 4 examination included rats in group 1 and 6 (vehicle control and highest dose group), while the intermediate groups were only to be included if an increased incidence of eye abnormalities were found in group 6. As this was not the case, groups 2-5 were not examined at the examination in the fourth week. The assessment included evaluation of pupil response to light, and examination of the eye by direct observation. Subsequently, pupillary dilatation was achieved by application of 1 drop of 0.5% tropicamide applied to each eye 5-15 minutes prior to examination, allowing examination of the superficial and deeper eye structures with slit lamp and by indirect ophthalmoscopy. 5.2.6.5 Functional observational battery (FOB) All animals were subjected to a battery of behavioural tests and observations (as listed below) during the fourth week of the dose period. At the time of testing, the observer was unaware of each animal’s dose level. Each animal was assigned a code number and moved to a new cage (1 animal/cage) by an independent person. Observational measurements were performed before and upon removal from the home cage. The animal was placed into a square arena for 3 minutes. During this time, behaviour was evaluated as indicated (open field). Various manipulative tests were also done. The following observations and measurements were done: In the home cage: posture, eye opening, convulsions, and vocalisation. During removal from the cage: reaction to handling, piloerection, lacrimation, salivation and eye opening. In the open field arena: number of rears during 3 minutes, convulsions, gait, ease of movement, arousal, number of faecal boli and urine pools during 3 minutes. Reflex testing: reaction to an object moved towards the face, to a push to the hindquarter, to a sudden noise, to a tail pinch, and the pupil response to light. Righting reflex, foot splay, grip strength of fore- and hind limbs, body weight and temperature. Any other observations of behaviour or appearance made during testing were noted. 5.2.6.6 Motor activity measurement Following FOB testing, the motor activity of each animal was assessed in an automated photocell activity recorder for 30 minutes. Activity counts were recorded in 5-minute intervals. Thus, data were obtained from six 5-minute motor activity intervals, called periods. 5.2.6.7 Haematology Blood samples (0.5 ml intended) were drawn from all animals the week before sacrifice. The rats were anaesthetized with 0.2 ml/100 g of a solution of Hypnorm®/Dormicum®4 s.c., and the blood was collected from the tail vein. WBC, RBC, Hgb, HCT, MCV, MCH, MCHC, Plt was measured on an animal blood counter, Pentra 120 (Triolab, Brøndby, Denmark). Differential blood cell count was made under light microscope on blood smears on glass slides stained with May-Grünwald colour (Merck 1424). Differential counts were made as duplicates for each animal in groups 1 and 6. 5.2.6.8 Plasma acetylcholinesterase activity Blood samples (as much as possible, 4-5 ml intended) were drawn from all animals on the day of sacrifice. The rats were anaesthetized with Hypnorm®/Dormicum® as described under haematology, and the blood was collected from the heart. For analysis of plasma acetylcholinesterase activity 1 ml of blood was collected in heparinized tubes and analysed for acetylcholinesterase activity. Samples were analysed on the day of sacrifice or refrigerated and analysed the following day. Principally, the analysis is a minor modification of the method originally described by Ellman et al.(4). The analysis was performed at 37° C on a Hitachi 912 auto analyser applying CFAS® Roche as the calibrator. 5.2.6.9 Brain acetylcholinesterase activity and protein concentration At sacrifice the brain was removed and separated sagittally into two halves. The left half was used for measurement of brain acetylcholinesterase activity. The tissue was homogenized, and a 2 ml sample of the homogenate was analysed for acetylcholinesterase activity and protein content. Relative brain acetylcholinesterase activity was calculated (units/g protein). Samples were analysed on the day of sacrifice or refrigerated and analysed the following day. The protein analysis was performed on a Hitachi 912 auto analyser by use of a commercially available kit obtained from Roche applying CFAS® Roche as the calibrator. 5.2.7 Plasma pesticide concentrationsMethod for analysis of rat plasma for alphacypermethrin, bromopropylate, carbendazim, chlorpyrifos and its degradation products chlorpyrifos-oxon and 3,5,6-trichloro-2-pyridinol (TCP) are described below. We did not get enough plasma from the rats to develop and validate a method for mancozeb analysis, which is why mancozeb is not measured. 5.2.7.1 Extraction The rat plasma samples were extracted with acetonitril. Precisely 0.50 g of rat plasma was weighed directly into extraction tubes, 20.0 ml of acetonil was added and then extracted for 2 min. by an Ultra-Turrax mixer. Hereafter, 5.0 g anhydrous sodium sulphate was added and the extraction went on for another 2 min. The sample was filtered and evaporated using a gentle stream of nitrogen to nearly dryness, and diluted with acetonitril to 0.50 ml. The extract was further analysed by GC-MS, LC-MS and LC-MS-MS.
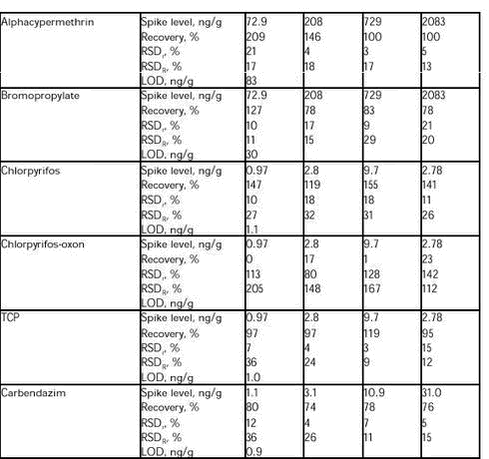
5.2.7.2 GC-MS-NCI analysis (chlorpyrifos, bromopropylate and alphacypermethrin) Aliquots of 1µl were analysed by ion trap GC/MS with chemical ionisation. Methane was used as reagent gas. Chlorpyrifos was measured by the masses 313 and 315, bromopropylate by the masses 78.3-82 and alphacypermethrin by the masses 207, 209 and 343. The sample extracts from each analytical series were analysed together and quantified using bracketing calibration curves at five concentration levels at 0.87, 2.78, 8.7, 27.8 and 55.5 pg/µl for chlorpyrifos and 32.6, 104, 326, 1041 and 2083 pg/µl for bromopropylate and alphacypermethrin. 5.2.7.3 LC-MS analysis (TCP) Aliquots of 10µl were analysed by LC/MS. The mass spectrometer was operated with electrospray in the negative ion mode (ESI-). Detection was performed in Single Ion Monitoring (SIM) mode. SIM conditions for TCP were mass 195.40. The sample extracts from each analytical series were analysed together and quantified using bracketing calibration curves at four concentration levels at 2.60, 8.68, 26.0 and 86.8 pg/µl. 5.2.7.4 LC-MS-MS analysis (carbendazim and chlorpyrifos-oxon) Aliquots of 10µl were analysed by LC/MS/MS. The mass spectrometer was operated with electrospray in the positive ion mode (ESI+). Detection was performed in Multiple Reacting Monitoring (MRM) mode. MRM conditions for carbendazim were mass 191.76? 159.57 and for chlorpyrifos-oxon 335.41?279.46. The sample extracts from each analytical series were analysed together and quantified using bracketing calibration curves at four-five concentration levels at 2.60, 8.68, 26.0 and 86.8 pg/µl carbendazim and 0.87, 2.60, 8.68, 26.0 and 86.8 pg/µl for chlorpyrifos-oxon. The method was partly validated together with the analysis of the samples. The validation was performed at four different concentration levels as double determination and with four repetitions. Recoveries, relative repeatability’s (RSDr), relative reproducibility’s (RSDR) and Limit of Determination (LOD) are shown in Table 12. As seen in Table 12 it was not possible to validate the method for chlorpyrifos-oxon. Prior to the validation, a preliminary recovery study was performed on water and rat plasma, in order to see whether the method gave acceptable recoveries of the spiked amount of chlorpyrifos-oxon. These results showed recoveries between 103-125%. Furthermore, recoveries performed in the first analytical series were between 83-117 (analytical series was carried out). These recoveries were carried out on the same rat plasma as used in the preliminary study. This rat plasma was provided from other control animals. The rest of the recoveries were carried out on plasma from group 1 of the first subset of animals. These recoveries were very low and it seems like this plasma has degraded the added chlorpyrifos-oxon. It is likely that the content of the enzyme paraoxonase is responsible for degrading the added chlorpyrifos-oxon (see Table 12). The plasma used for the initial studies was quite old and maybe the paraoxonase was inactive. The plasma from group 1 has been stored at – 80 degree and therefore the paraoxonase has properly been very active and has rapidly degraded (under 30 min.) chlorpyrifos-oxon. However further investigation should be carried out. For the other compounds the RSDr and RSDR were acceptable and below the relative reproducibility derived from the Horwitz equation (12). Table 12.
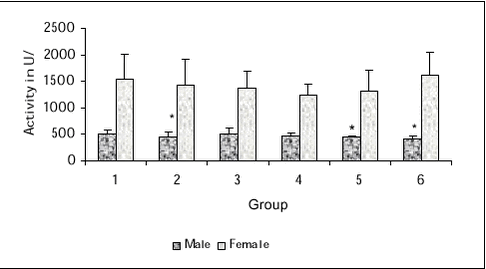
5.2.8 Terminal procedures5.2.8.1 Necropsy and macroscopic pathology All animals were subjected to necropsy. The order of necropsy was balanced with respect to dose group and sex. The animals were euthanized by decapitation in Hypnorm®/Dormicum® anaesthesia. A full macroscopic examination was performed and all lesions were recorded. 5.2.8.2 Organ weights The following organs of all animals were weighed: liver, kidneys, adrenal glands, spleen, thymus, thyroid glands, testes, epididymis (males only), heart and brain. The last of the weekly body weight measurements, obtained on the Monday of the week of sacrifice, was used for calculation of relative organ weights. 5.2.8.3 Histology The following tissues were formaldehyde preserved and evaluated by histopathology: intestinal tract, liver, kidneys, adrenal glands, spleen, thymus, thyroid glands, trachea, lungs, gonad’s, accessory sexual organs, bladder, lymph nodes, heart, bone marrow, peripheral nerve, spinal cord, left half of the brain and in addition tissues with macroscopically lesions. 5.2.9 Data evaluationData from treated animals were compared with control data. Males and females were evaluated separately. No statistical analysis was done on data where it was obvious that no group difference was present (some FOB data, eye examination data). Continuous data were evaluated with respect to conformity with normal distribution and variance homogeneity, and it was determined whether a parametric or a non-parametric test would be more suitable. Parametric data were analysed by a parametric analysis of variance followed by Dunnetts test. Non-parametric data were analysed by Wilcoxons test of one-way analysis of variance followed by Kruskal Wallis test. Differences with P < 0.05 were regarded statistical significant. 5.3 Results5.3.1Clinical signs, morbidity and mortalityNo adverse clinical signs were observed. Two animals died during the study (one male in group 1, one male in group 5) while anaesthetized for blood sampling for haematology during the 4th week of dosing. These deaths are regarded as unrelated to the exposure to test substances. 5.3.2 Body weightsAll groups gained weight during the study period (statistically significant effect of time). There was no statistically significant difference among groups within each sex. 5.3.3 Relative food and water consumptionAll groups showed the normal decrease in relative food and water consumption during the study period (statistically significant effect of time). There was no statistically significant difference among groups within each sex. 5.3.4 Functional observational battery (FOB)No unusual behaviour was observed. The only statistically significant difference was an 11% reduced forelimb grip strength in males of group 5 compared with vehicle control. However, as no dose response was found, this is considered unrelated to treatment. 5.3.5 Motor activity measurementThe variability in the data was large, which is commonly observed. Total motor activity during 30 minutes was unaffected by treatment. In all groups, a statistical significant decline in activity over time was found indicating that habituation to the novel situation occurred and this is a normal finding. There was no difference between treatment groups in the repeated measures analysis of individual 5-minute activity periods. 5.3.6 Eye examinationsNo treatment-related abnormalities were observed. Persistent pupillary membrane was observed in 9 rats at the first assessment (May 15 and 16, before start of exposure). This is regarded as a normal finding. The distribution was: group 1: 3 males (nos. 1, 6, 17), group 2: 1 male (no. 34), group 3: 2 males (nos. 65, 70), group 4: 1 male (no. 101), group 5: 1 male (no. 129) and 1 female (no. 150), group 6: 1 male (no. 164). At the second assessment (June 12) during exposure week 4, where only groups 1 and 6 were assessed, no incidence of persistent pupillary membranes were observed, except in one male rat (no. 6 of group 1). In addition to the observations made during the scheduled assessments of group 1 and 6 during exposure week 4, a pathological finding was observed in one rat (no. 37, male, group 2) whose right eye was severely enlarged and opaque. This is regarded as an incidental finding and is probably caused either by spontaneously occurring glaucoma, which has been observed in rats of this strain before, or by trauma. 5.3.7 Acetylcholinesterase activity5.3.7.1 Plasma acetylcholinesterase activity A slight but statistically significant lower activity in plasma acetylcholinesterase was found in males of group 2, 5 and 6 compared with the vehicle control group (see Figure 2). The plasma acetylcholinesterase level was approximately three times higher in females compared to males (see Figure 2), this is a normal finding. 5.3.7.2 Relative brain acetylcholinesterase activity No treatment-related difference was found. The relative brain acetylcholinesterase level was the same in females and in males.
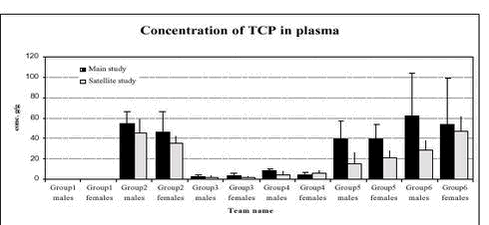
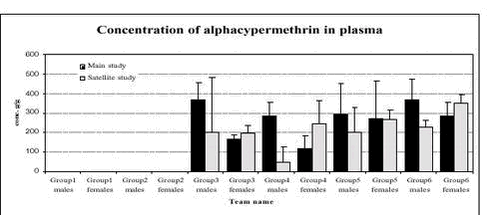
Figure 2. Plasma acetylcholinesterase activity (units/L) in male and female rats in the 6 dose groups. See dose group in table 8. * Statistical significant different (P < 0.05) from group 1 (control) 5.3.8 Plasma pesticides concentrationsChlorpyrifos was found in some samples but in very low concentration below the determination limit (1 ng/g). The degradation product from chlorpyrifos, chlorpyrifos-oxon was not found in any samples, but TCP, another degradation product, was found in all samples from group 2-6 (see Figure 3). The concentrations seem to be dose dependent. The concentration found in samples from the satellite study seems to be lower than the concentration in the samples from the main study. No differences were observed between males and females. No alphacypermethrin, bromopropylate and carbendazim were detected in group 1 or 2. Bromopropylate was found in all samples analyses from groups 3-6 with a mean concentration of 263 ng/g ranging between 54-1383 ng/g (see Figure 4). The concentration found in samples from the satellite study seems to be lower than the concentration in the samples from the main study. No differences were observed between males and females. Alphacypermethrin was found in most of the samples (63 out of 68) from groups 3-6 (see Figure 5). The mean concentration was 247 ng/g with result between 0-636 ng/g. No differences were observed between the main and satellite study or between males and females. Carbendazim was found in almost half of the samples (30 out of 68) from groups 3-6 (see Figure 6). The mean concentration was 0.8 ng/g with result between 0-8 ng/g. No differences were observed between the main and satellite study or between males and females.
Figure 3. Plasma pesticide concentration of the metabolite TCP of chlorpyrifos after 1 week (satellite study) and after 4 weeks (main study) in male and female rats for the 6 dose groups. See dose groups in Table 8. Figure 4. Plasma pesticide concentration of bromopropylate after 1 week (satellite study) and after 4 weeks (main study) in male and female rats for the 6 dose groups. See dose groups in Table 8.
Figure 5. Plasma pesticide concentration of alphacypermethrin after 1 week (satellite study) and after 4 weeks (main study) in male and female rats for the 6 dose groups. See dose groups in Table 8.
Figure 6. Plasma pesticide concentration of carbendazim after 1 week (satellite study) and after 4 weeks (main study) in male and female rats for the 6 dose groups. See dose groups in Table 8. 5.3.9 HaematologyThere were no differences in white blood cell count (WBC) or differential count for male rats. Group 6 female rats had a significantly lower WBC, but there was no statistically significant difference in differential WBC counts (see Appendix C, Table 1-4C). There was a significant reduction in red blood cell count (RBC) of group 3, 5 and 6 male rats and in group 5 and 6 female rats. There was a significant reduction in haemoglobin (Hb) in group 3, 4, 5 and 6 male rats and in group 2, 5 and 6 female rats. There was a significant reduction in haematocrit (Hct) in group 2, 3, 4, 5 and 6 male rats and group 2, 5 and 6 female rats. There were no significant changes in mean corpuscular volume (MCV), mean corpuscular haemoglobin (MCH), mean corpuscular haemoglobin concentration (MCHC) in any of the groups except for group 2 female rats where there is a higher MCHC (see Appendix C, Table 1C and 3C). 5.3.10 Pathology5.3.10.1 Necropsy and macroscopic pathology There were two un-scheduled deaths, one male rat in group 1 and one male rat in group 5 died following blood sampling after Hypnorm-Dormicum sedation. At autopsy they were found to have enlarged haemorrhagic livers and large adrenal glands. Macroscopic findings: None of the macroscopic lesion was dose-related. In group 2 males, one male had bilateral increased size of lnn. Axillaris, this male also had glaucoma of the right eye. In group 2 females, one female was very thin (No. 52) and two females had a superficial skin wound in the inguinal area. In group 3 males, one male had a very small (atrophic) right adrenal gland. In group 5 females, one female had a superficial skin wound in the inguinal area. In group 6 males, one male had a superficial skin wound in the inguinal area and in group 6 females; one female had a superficial skin wound in the inguinal area. All of the above mentioned superficial skin wounds were caused by the injection with Hypnorm-Dormicum. 5.3.10.2 Organ weights Body weight and absolute and relative organ weights for brain, heart, liver, spleen, kidneys, adrenal glands, thymus, thyroid gland, uterus, ovaries, testis and epididymis are presented in Appendix C, Table 5-8C as group means with standard deviation. All organ weights except the weight of the thyroid gland were normally distributed. There was a statistical significant increase in relative liver weight in group 3-6 in both male and female rats. There was a statistically significant increase absolute weight of the Thyroid gland in group 3, 5 and 6 in male rats and in group 3-6 in female rats. There was a statistically significant increase in relative weight of the thyroid gland in group 2-6 in male rats and group 3-6 in female rats. There was a statistically significant decrease in absolute weight of the thymus in group 3-6 in both male and female rats, and a decrease in relative thymus weight in group 3-6 in male rats and group 3 and 4 in female rats. 5.3.10.3 Histopathology All organs were evaluated by histopathology in the controls (group 1) and in the highest dose group (group 6). All the histopathological findings and remarks are shown in Appendix C under histopathology Table 9C. In the liver, 8 out of 8 males in group 6 had a mild degree of centrilobular cell hypertrophy and 3 out of 8 females in group 6 had a mild degree of centrilobular cell hypertrophy. None of the livers of group 1 males and females showed these changes. One to three Foci of inflammatory cells were found in 7 out of 7 males in group 1, 6 out of 8 males in group 6, 4 out of 8 females in group 1 and 5 out of 8 females in group 6. In the thyroid gland 1 out of 8 females in group 1, 6 out of 8 females in group 6 and 7 out of 8 males in group 6 had a mild degree of follicular cell hypertrophy. An increased number of animals in the high dose group (group 6) have dose-related findings with a mild degree of centrilobular cell hypertrophy in the liver and a mild degree of follicular cell hypertrophy in the thyroid gland. The histological changes in the liver could indicate an increased cytochrome-P450 activity. The histological changes in the thyroid gland indicate an increased activity probably stimulated by increased levels of TSH. The weight changes in the thymus did not reflect any histological changes. The decrease in weight of thymus might be the beginning of an involution of the thymus not yet recognizable histological. The histological finding of foci of inflammatory cells in the liver in the combined exposure study is not considered substance related as this finding was seen in both control and high dose group. 5.4 Conclusions of the combined exposure studyIt was hypothesised that the effect of chlorpyrifos on brain acetylcholinesterase inhibition is enhanced by the co-administration of the other four pesticides: alphacypermethrin, bromopropylate, carbendazim and mancozeb. The primary objective of this study was to confirm or reject the hypothesis and if possible show a dose-response of brain acetylcholinesterase inhibition by varying the dose of chlorpyrifos and keeping the four other pesticides at constant concentration. The second objective was to examine the possibility of increased liver metabolism of chlorpyrifos to the active metabolite chlorpyrifos oxon. It is concluded that it was not possible to confirm the hypothesis that the effect of chlorpyrifos on brain acetylcholinesterase inhibition is enhanced by co-administration of the other four pesticides. It was therefore not possible to show a dose-response of chlorpyrifos in combination with the four other pesticides. However, some combination effects were observed, since there were increased weights of liver and the thyroid gland including histological changes in these organs. There was a decreased weight of the Thymus without histological changes. Furthermore some changes in haematology were found. These findings will be discussed below. It cannot be concluded that the mode of action is through increased liver metabolism of chlorpyrifos to the active metabolite chlorpyrifos-oxon. Chlorpyrifos-oxon could not be found in plasma and TCP increased in a dose-related manner. The increase in relative liver weight together with a mild degree of centrilobular cell hypertrophy is indicative of liver enzyme induction. However, the mode of action might be through other mechanisms than chlorpyrifos metabolisation in the liver.
3 based on OECD guidance notes for analysis and evaluation of chronic toxicity studies 2000(24)
|
