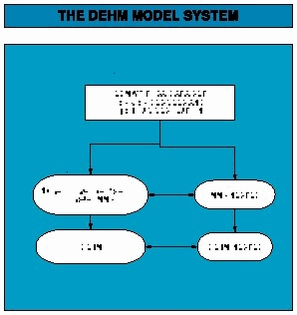
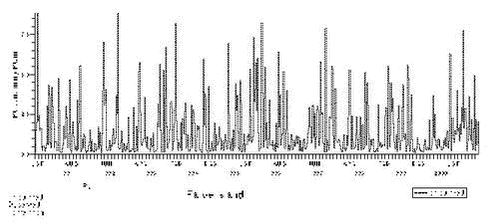
AMAP Greenland and the Faroe Islands 1997-20013 Atmospheric ModellingSummary and conclusions1 Atmospheric Modelling 1.1 The DEHM modelling system 1.2 Modelling of Sulphur and Lead 1.3 Modelling of mercury 2 References Jesper Christensen National Environment and Research Institute Department of Atmospheric Environment Summary and conclusionsThe Danish Hemispheric Eulerian Model system has been used to model the atmospheric transport of sulphur, lead and mercury to the Faroe Islands. When modelling sulphur (SOX) and lead (Pb), the model was run from October 1990 to May 2001. The mean calculated concentrations of SOX (=SO2+SO42-) for the surface level and the total depositions are shown as are similar figures for Pb. The general pattern of both the SOX and Pb is quite similar. The main pathway for the transport to Faroe Island is by directly transport from Europe. The model have been compared with measurements many places in Europe and generally there is a very good agreement between the calculated values and the measured. For the Faroe Islands however, the model results have not been compared with actual measurements of SOX and lead. In the current version of DEHM the emissions of anthropogenic mercury are based on the new global inventory of mercury emissions for 1995 on a 1ox1o grid, which includes emissions of Hg0, reactive gaseous mercury (RGM) and particulate mercury. There are no re-emissions from land and oceans, instead a background concentration on 1.5 ng/m3 of Hg0 are used as initial concentrations and boundary conditions.The mercury model has been run for October 1998 to December 2000. The model has been compared with measurements from Faroe Island. The results show that there is a poor agreement between the calculated and the observed concentrations of elemental mercury (Hg0). The total deposition of mercury is split up in three components: the contribution from the deposition of RGM, chemically made particulate mercury and directly emitted particulate mercury. It has been shown that the depletion phenomena is important for the deposition of mercury in the high Arctic areas at Greenland, while for Faroe Islands the depletion phenomena have only a minor influence on the mercury deposition. The deposition is increased by 8%. The deposition is a factor of two lower compared to the depositions in Denmark. The contribution from directly emitted particulate mercury is small (2%) at Faroe Islands. It is mainly the large atmospheric reservoir of elemental mercury, which contributes to the deposition, and which all global emissions both anthropogenic and natural contributes to. 1 Atmospheric ModellingA model is a mathematical tool for the study of processes and mechanisms of complex system as f.ex. the atmosphere and the processes inside the atmosphere as transport of air pollution. This tool should therefore take into account all processes, which the transports depend on. The air pollution in the Arctic depends on the emissions from the sources, transport from the emissions area into the Arctic by the wind, dispersion of the pollution by diffusion, chemical transformations during the transport, removal of pollutants due to precipitation and deposition on the surface. An air pollution model for the Arctic must take into account all these physical and chemical processes. The different processes must be described very precisely to reduce the uncertainties in the model. It is only possible to handle such a model on a very powerful computer, because the processes and the interactions between the different processes are very complex. There are several reasons why one should use a model. A model is a good tool for improving the understanding of the atmospheric pathways to the Arctic. The model can be used to estimate the contributions from the different sources in the Northern Hemisphere to the Arctic pollution, or a model can be used to quantify the importance of different processes as f.ex. mercury depletions importance for the transport of mercury into Arctic. Both examples are shown in the following sections. The Danish Eulerian Hemispheric Model (DEHM) model has been used for this assessment. The DEHM model has earlier been used in 1. phase of AMAP (see Kämäri et al., 1998), and the model have been described in several papers, see e.g. Christensen (1997,1999). Barrie et al. (2001), Lohmann et al.(2001) and Roelofs et al. (2001). Model results from the DEHM will be shown in the following. 1.1 The DEHM modelling systemThe system consists of two parts: a meteorological part based on the PSU/NCAR Mesoscale Model version 5 (MM5) modelling subsystem (see Grell et al, 1995) and an air pollution model part, the DEHM model. The MM5 model produces the final meteorological input for the DEHM model. Global meteorological data, used as input to the MM5 mesoscale modelling system, are obtained from the European Centre for Medium-range Weather Forecasts (ECMWF) on a 2.5ox2.5o grid with a time resolution of 12 hours. The whole system includes 2-way nesting capabilities, so it is possible to do finer (150 km –> 50 km –> 16.67 km, etc) model calculations over e.g. Greenland or Faroe Island. 23 years of meteorological data from 1979 to 2001 are available, but the MM5 model system for the mother domain has only been run for a period of 11 years from 1990 to 2001, while the model system with 1 nest have been run for the period 1995-2001 for Europe (50 km) and 1 month for Greenland (50 km) as demonstration.
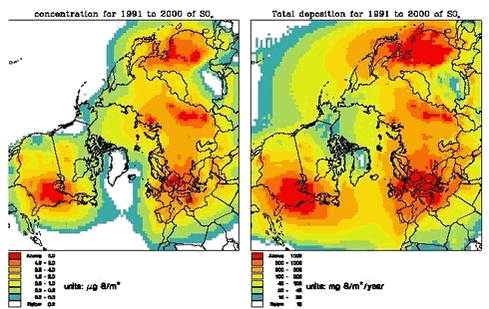
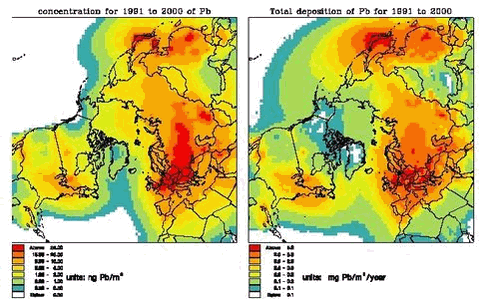
The DEHM model is based on set of coupled full three-dimensional advection-diffusion equations, one equation for each specie. The horizontal mother domain of the model is defined on a regular 96x96 grid that covers most of the Northern Hemisphere with a grid resolution of 150 km ‘ 150 km at 60oN. The vertical discretization is defined on an irregular grid with 20 layers up to = 15km. 1.2 Modelling of Sulphur and LeadIn the basic version the emissions of anthropogenic sulphur are based on the global GEIA inventory of sulphur emissions, version 1A.1, for 1985 on a 1ox1o grid (see Benkowitz et al., 1996) and GEIA Global Lead Emissions Inventory, Version 1, for 1989 on a 1ox1o grid (see Pacyna et al, 1995). These emissions are redistributed to the grid used in the model. The EMEP emissions of sulphur (for Europe) for the years 1990-1997 are used for the part of the grid, which is equal the EMEP grid. The model has been run from October 1990 to May 2001. In figure 2 the total mean concentrations of SOX (=SO2 +SO4 2-) for the surface level and the total depositions are shown. The similar figures for Pb are given on figure 3. The general pattern of both the SOX and Pb is quite similar. The main pathway for the transport to Faroe Island is directly transport from Europe. The model have been compared with measurements many places and generally there is a very good agreement between the calculated and measured concentrations not only in the Arctic but also in Europe and North America, see-Christensen (1997,1999), Barrie et al. (2001), Lohmann et al.(2001) and Roelofs et al. (2001). Therefore one should expect that even though the model results have not been compared with measurements of sulphur and lead from Faroe Island, the results can be used to assess the air pollution levels at the Faroe Island
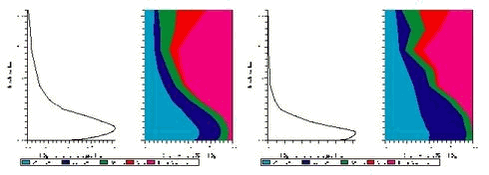
In figures 6 and 7 the vertical distributions of SOX and Pb and the contribution from different anthropogenic sources to these vertical distributions for Faroe Island and Denmark are shown. The highest concentration levels for the total mean are a factor of 10 lower than the similar calculated mean concentrations for Denmark. The largest contribution to the atmospheric burden of sulphur for Faroe Island is coming from West European sources (up to 60 % in the lowest 1.5 km part of the atmosphere) and East Europe contributes with up to 20%. At higher levels it is mainly the North America sources, which contribute. Denmark have much larger contribution from East Europe (35 %) compared to Faroe Island. For lead it is mainly West Europe, which contributes to the concentration levels (up to 70%).
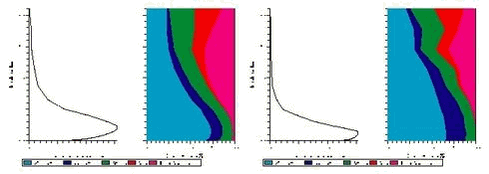
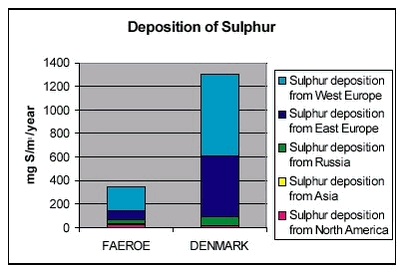
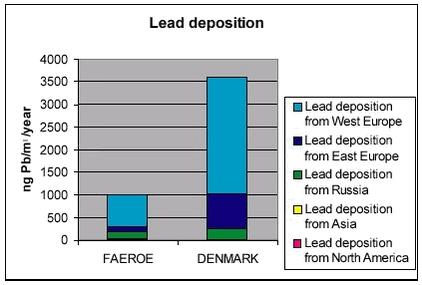
In figures 8 and 9 the total deposition and the contribution from different sources are shown for Faroe Island and Denmark. The deposition levels for both sulphur and lead are a factor 4 lower than the calculated deposition levels in Denmark. West Europe contributes with 58% to the total deposition of sulphur, East Europe with 23% and Russia with 11%. The similar numbers for lead are 70% from West Europe, 13% from East Europe and 14% from Russia.
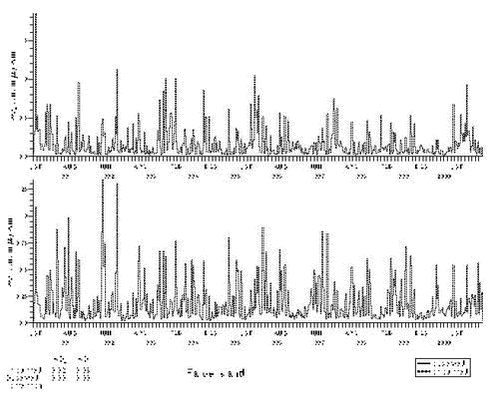
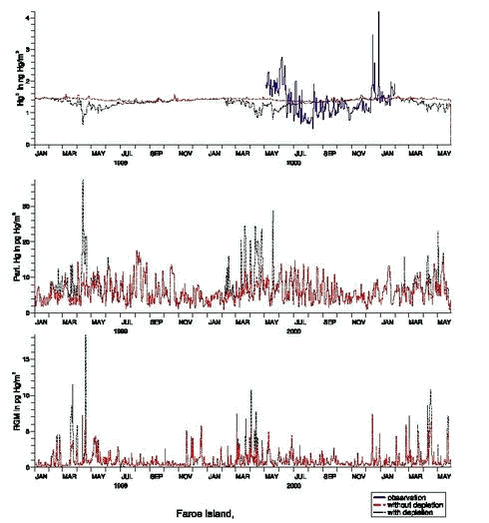
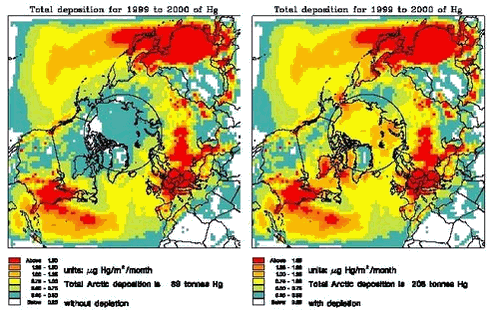
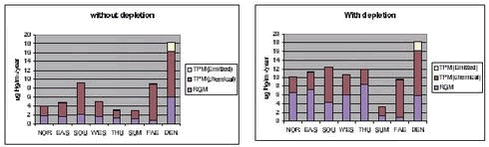
1.3 Modelling of mercuryIn general, activities aimed at modeling Hg are less developed, although major improvements in regional (European) and global modeling of Hg have been made. An example of a mercury model is the mercury version of the Danish Hemispheric Eulerian Model system (DEHM), which have been used to study the transport of mercury into the Arctic. The main reason for the development of the model was fulfill the Recommendation from the AMAP workshop: “Modelling and sources: A workshop on Techniques and associated uncertainties in quantifying the origin and long-range transport of contaminants to the Arctic. Bergen, 14-16 June 1999” to “Assess spring Hg and O3 depletion using atmospheric model with high-resolution boundary layer. Therefore there has not been so much focus on the results for Faroe Island, but still the model results can be used for the assessment of the atmospheric mercury. In the present mercury version of DEHM there are 13 mercury species, 3 in gas-phase (Hg0 , HgO and HgCl2), 9 species in the aqueous-phase and 1 in particular phase. The dry deposition velocities of the reactive gaseous mercury species are based on the resistance method, where the surface resistance similar to HNO3 is used, which have a very high deposition velocity. The wet deposition of reactive and particulate mercury is parameterized by using a simple scavenging coefficients formulation with different in-cloud and below-cloud scavenging coefficients (see Christensen, 1997). The mercury model has been run for October 1998 to December 2000. The model has been compared with measurements from Faroe Island. The results show that there is a poor agreement between the calculated and observed concentrations of elemental mercury (Hg0), see Fig. 10 (see also the discussion in the chapter about measurements of mercury). For central Europe and in Sweden the model have been compared with measurements of both Hg0 and particulate mercury with a much better agreement. At the figure there are also shown the calculated concentrations of reactive gaseous mercury (RGM) and particulate mercury. For Faroe Island the depletion phenomena have only a minor influence on the concentrations levels. In figure 11, the total depositions of mercury for the years 1999 and 2000 are shown. This example shows the importance of the mercury depletion in the Arctic for the total deposition of mercury. The total deposition increases in the whole Arctic and the surrounding areas, and for the area north of the Polar Circle the total deposition of mercury increases from 89 to 208 tonnes pr. year due to the depletion according to the model runs. For the areas around Faroe Islands there is only a small increased deposition of mercury. In figure 12 the total deposition of mercury in µg Hg/m2/year for 8 different localities (6 in Greenland, Faroe Island and Denmark) are shown. The total deposition is split up in three components: the contribution from the deposition of RGM, chemical made particulate mercury and directly emitted particulate mercury. At the figure it is shown very clearly how important the depletion phenomena is for the deposition of mercury for the high Arctic areas at Greenland, while for Faroe Islands the depletion phenomena have only a minor influence on the mercury deposition. The deposition is increased by 8%. The deposition is a factor of two lower compared to the depositions in Denmark. The contribution from directly emitted particulate mercury is small (2%) at Faroe Islands. It is mainly the large atmospheric reservoir of elemental mercury, which contributes to the deposition, and which all global emissions both anthropogenic and natural contributes to.
2 ReferencesBenkowitz, C. M., T. Scholtz, J. Pacyna, L. Tarrasón, J. Dignon, E. Voldner, P. A. Spiro and T. E. Graedel (1996): Global Gridded Inventories of Anthropogenic Emissions of Sulphur and Nitrogen. J. Geophys. Res., 101, 29239-29253. Christensen, J. (1997): The Danish Eulerian Hemispheric Model - A Three Dimensional Air Pollution Model Used for the Arctic. Atm. Env, 31, 4169-4191. Christensen, J. (1999): An overview of Modelling the Arctic mass budget of metals and sulphur: Emphasis on source apportionment of atmospheric burden and deposition. In: Modelling and sources: A workshop on Techniques and associated uncertainties in quantifying the origin and long-range transport of contaminants to the Arctic. Report and extended abstracts of the workshop, Bergen, 14-16 June 1999. AMAP report 99:4. see also http://www.amap.no/ Grell, G. A., Dudhia J. and Stauffer D. R., 1995: A Description of the Fifth-Generation Penn State/NCAR Mesoscale Model (MM5). NCAR/TN-398+STR. NCAR Technical Note. June 1995, pp. 122. Mesoscale and Microscale Meteorology Division. National Center for Atmospheric Research. Boulder, Colorado. Kämäri, J., P. Joki—Heiskala, J. Christensen, E. Degerman, J. Derome, R. Hoff and A.-M Kähkönen: Acidifying Pollutants, Arctic Haze, and Acidifications in the Arctic, Chapter 9 in: AMAP Assesment Report: Arctic Pollution Issues. Arctic Monitoring and Assessment Programme (AMAP). S. Wilson, J. Murray and H. Huntington, Ed, 1998. Pacyna, Jozef M., M. Trevor Scholtz and Y-F. Li, (1995): Global Budgets of Trace Metal Sources, Environmental Reviews, 3, 145-159. Pacyna, E.G., and J.M. Pacyna, Global emission of mercury from anthropogenic sources in 1995. Water, Air, and Soil Pollution, 137, pp.143-165, 2002. Petersen, G. Munthe, J. Pleijel, K. Bloxam, R. and Vinod Kumar, A.; A comprehensive eulerian modeling framework for airborne mercury species: development and testing of the tropospheric chemistry module (TCM). Atm. Env., 32. (1998) 829-843. L. A. Barrie, Y. Yi, U. Lohmann, W.R.Leaitch, P. Kasibhatla, G.-J. Roelofs, J. Wilson5, F. McGovern, C. Benkovitz, M.A. Meliere, K. Law, J. Prospero, M. Kritz, D.Bergmann, C. Bridgeman, M. Chin, J. Christensen, R. Easter, J. Feichter, A. Jeuken, E. Kjellstrom, D. Koch, C. Land, P. Rasch: A comparison of large scale atmospheric sulphate aerosol models (cosam): overview and highlights. Tellus, 53B, pp 615-645, 2001. U. Lohmann, W.R. Leaitch, K. Law, L. Barrie, Y. Yi, D. Bergman, C, Bridgeman, M. Chin, J. Christensen, R. Easter, J. Feichter, A. Jeuken, E. Kjellstrom, D. Koch, C. Land, P. Rasch, G.-J Roelof: Vertical distributions of sulphurspecies simulated by large scale atmospheric models in cosam: Comparison with observations. Tellus, 53B, pp 646-672, 2001 G.J. Roelofs, P. Kasibhatla, L. Barrie, D. Bergmann, C, Bridgeman, M. Chin, J. Christensen, R. Easter, J. Feichter, A. Jeuken, E. Kjellström, D. Koch, C. Land, U. Lohmann, P. Rasch: Analysis of regional budgets of sulfur species modelled for the COSAM exercise. Tellus, 53B, pp 673-694, 2001 |