AMAP Greenland and the Faroe Islands 1997-20014 RadionuclidesSummary and conclusions1 Radioactivity in Faroese environment. Measurements from 1999 and 2000 1.1 Marine environment 1.2 Freshwater lakes 1.3 Soil 1.4 Grass 1.5 Moss 1.6 Potatoes 1.7 Cow milk 1.8 Lamb meat 2 References Hans Pauli Joensen Henning Dahlgaard Summary and conclusionsRadioactivity measurements have been carried out for samples collected in 1999 and 2000. The samples are from marine as well as terrestrial environment, including freshwater lakes. The average Caesium (137Cs) aktivitet in seawater are around 1.6 Bq/m3 for both 1999 and 2000, with a declining trend from 1999 to 2000 in Tórshavn/Hoyvík and Kirkjubøur. The average 137Cs/90Sr concentration ratio from the measurements is 1.49, which corresponds to the global fallout ratio. Results for 137Cs concentrations in marine biota are presented, all showing low values, with cod having the relative highest value of around 0.2 Bq/kg fresh weight. Geografical variations of 137Cs activity are seen for soil and grass samples. Also in cows milk geographical variations are seen resulting in significantly higher levels in 137Cs activity in cows milk at the southern location than at the two northern locations. Due to the expected transport time of Technetium (99Tc) to Faroese waters of 12-15 years, the results presented are therefore not related to the latest releases from Sellafield, but mainly to discharges in the 1970s and to global fallout from nuclear weapons tests. 1 Radioactivity in Faroese environment. Measurements from 1999 and 2000Radioactivity measurements have been carried out for samples collected in 1999 and 2000. The samples are from marine as well as terrestrial environment, including freshwater lakes. The analytical metods are as described in Aarkrog et al. 1997 and Chen et al. 1994. In some cases, 40K measured by gamma-spectrometry has been expressed as the equivalent amount of potassium. One gramme of potassium holds 30.65 Bq of the natural gammaemitter 40K. 1.1 Marine environmentThe collection of samples covers biota as well as seawater. The measurements for seawater are presented in Table 1. The average 137Cs concentrations in seawater are around 1.6 Bq/m3 for both 1999 and 2000, with a declining trend from 1999 to 2000 in Tórshavn/Hoyvík and Kirkjubøur. The average 137Cs/90Sr concentration ratio from the measurements is 1.49, which corresponds to the global fallout ratio. The peak release of 99Tc from Sellafield in 1995 has raised environmental and political awareness of this particular radionuclide. The radionuclide is transported from the Irish Sea to Faroese waters by ocean currents, having an expected transport time to Faroese waters of 12-15 years (Dahlgaard 1995). The results presented in Table 1 for 99Tc are therefore not related to the latest releases from Sellafield, but mainly to discharges in the 1970s and to global fallout from nuclear weapons tests. Comparing 137Cs and 99Tc activities in Fucus shown in Table 2 with activities in seawater in Table 1 show a concentration factor for 137Cs from seawater to Fucus of 209-274 Bq kg-1 dry / Bq L-1, or L kg-1. The similar number for 99Tc is 60000-83000.
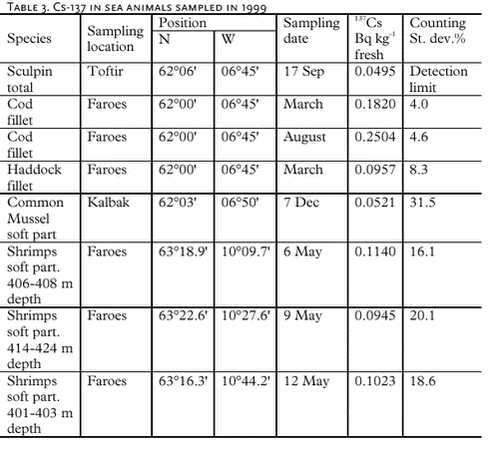
Results for 137Cs concentrations in other marine biota can be found in Table 3, all showing low values, with cod having the relative highest value of around 0.2 Bq/kg fresh weight. Table 4 show measured 137Cs activity concentrations in pilot whale meat, sampled on three locations in 1999.
1.2 Freshwater lakesMeasurements of water from three freshwater lakes in 1999 are presented in Table 5. The 137Cs/90Sr ratio is 0.89, 0.80 and 0.77 in Eiðisvatn, Toftavatn and Leynavatn, respectively.
1.3 SoilMore extensive analyses have been carried out for soil samples, collected at two locations in the central part of the country. The results are presented in Tables 6 and 7. The most significant variation with soil depth is observed for 137Cs, where most of the radionuclide is retained in the uppermost 10cm. The 137Cs activity at Toftavatn is about a factor two higher than in Hvalvík, where the results are around the values that should be expected in 1999 (Joensen, 1999).
1.4 GrassResults of measurements for mixed grass from three locations in 1999 are presented in Table 8. There is a significant geographical variation in the 137Cs activities as well as in the concentration of 40K. High values of 137Cs tend to correlate to low values of K, although it is not obvious to make this conclusion from Table 8.
1.5 MossMoss has been collected on one location in 1999. The measurements are presented in Table 9. There is no information about the moss species, and it is not possible to give a satisfying explanation about the difference in the two 137Cs values. 1.6 PotatoesThe 137Cs activity concentration in potatoes from 1999 is in the range 1.07- 1.51 Bq/kg fresh weight, and 0.28-0.35 (Bq 137Cs).(g K)-1.
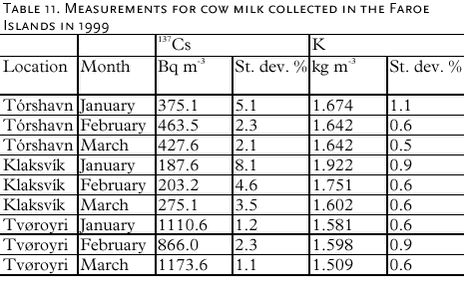
1.7 Cow milkCow milk has been collected from three locations, monthly in the first quarter of 1999. The highest 137Cs activity concentration is found at the southernmost location, Tvøroyri, where the levels are significantly higher than at the two northern locations. This may possibly be related to a higher deposition from the Chernobyl accident in the southern part of the country, but this is still to be confirmed. The 137Cs/K ratio is in the range 98-778 (Bq 137Cs).(g K)-1.
1.8 Lamb meatLamb meat has been collected at the time of slaughter in October 1999 from Bøur and Sandur. The measurements are presented in Table 12. The 137Cs activity concentration range is 3.67-6.54 Bq/kg fresh weight, and 0.85-1.49 (Bq 137Cs) .(g K)-1.
2 ReferencesAarkrog, A., P. Aastrup, G. Asmund, P. Bjerregaard, D. Boertmann, L. Carlsen, J. Christensen, M. Cleemann, R. Dietz, A. Fromberg, E. Storr-Hansen, N. Zeuthen Heidam, P. Johansen, H. Larsen, G. Beyer Paulsen, H. Petersen, K. Pilegaard, M. E. Poulsen, G. Pritzl, F. Riget, H. Skov, H. Spliid, H. Weihe & W. Wåhlin. 1997. AMAP Greenland 1994-1996. Environmental Project 356: 792pp. Ministry of Environment and Energy, Copenhagen. Chen, Q. J., Dahlgaard, H. & Nielsen, S. P. (1994). Determination of Tc-99 in Sea Water at Ultra Low Levels. Analytica Chimica Acta, 285, 177-180. Joensen, H. P.: Long-Term Variation of Radiocaesium in the Foodchain of Lamb in the Faroe Islands. Journal of Environmental Radioactivity 46 (1999), p. 345-360. Dahlgaard, H. (1995). Transfer of European coastal pollution to the Arctic: Radioactive tracers. Marine Pollution Bulletin 31, 3-7. |


